No fluff. Just the config that works.
Your firewall keeps logging WAN link-monitor failures, a health check on a server times out a few times a day, and every call to the ISP ends with “reboot the gateway.” This guide builds the thing that ends that conversation: an independent probe that records ISP packet loss at one-minute resolution, hop by hop, with a second ISP running as a control. When you open the ticket, the evidence points at their network, not yours.
| Item | Details |
|---|---|
| Objective | Measure loss and latency on the primary ISP from outside the firewall, layered so the first failing hop is obvious, with a second ISP as a control path. |
| Audience | Network and security engineers running a dual-WAN FortiGate in a lab, home office or small site. |
| Result | A Raspberry Pi 5 running SmokePing and timed mtr snapshots, plus a tuned FortiGate link monitor. |
Why the probe has to sit outside the firewall
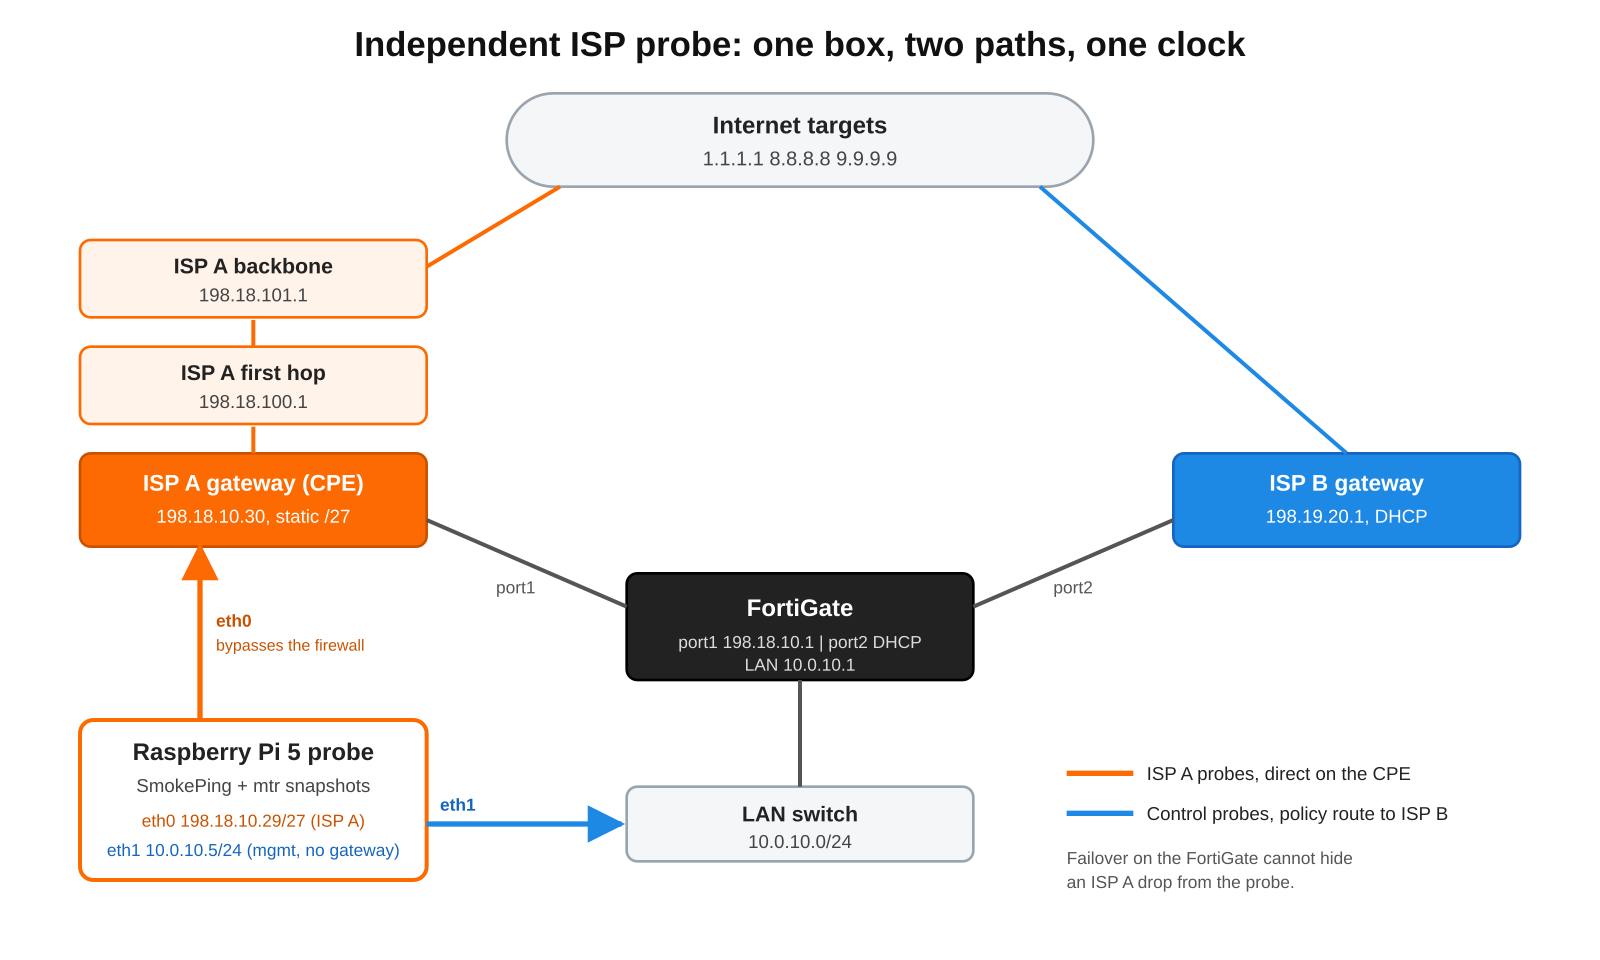
If you measure through the firewall, two things work against you. First, failover hides the outage: with update-static-route and update-policy-route enabled on the link monitor, the FortiGate moves traffic to the backup WAN, so a probe behind it sees a latency bump instead of loss. Second, the ISP can always say the firewall caused it. A probe plugged straight into a spare LAN port on the ISP gateway, using a spare address from your static block, removes both problems.
The probe also needs a second network interface. The built-in port lives on the ISP gateway with a public address and nothing in front of it, so it must accept nothing inbound. A USB Ethernet dongle on the internal LAN carries management and the control probes.
Prerequisites and architecture
- Raspberry Pi 5 (4 or 8 GB is plenty), official 27 W USB-C supply, active cooling.
- A high-endurance microSD card. A probe writes all day, every day.
- A USB 3 Gigabit Ethernet dongle for the management interface.
- One unused address from the primary ISP’s static block and a free LAN port on its gateway.
- A UPS outlet. A power blip on the probe looks exactly like an ISP outage in the graphs.
- A FortiGate with two WANs on FortiOS 7.x, and Docker on the Pi.
| Component | Lab address | Role |
|---|---|---|
| ISP A gateway (CPE) | 198.18.10.30 | First layer 3 hop for the static block |
| FortiGate port1 | 198.18.10.1/27 | Primary WAN on ISP A |
| FortiGate port2 | DHCP, gateway 198.19.20.1 | Backup WAN on ISP B |
| FortiGate LAN | 10.0.10.1/24 | Internal gateway |
| Probe eth0 | 198.18.10.29/27 | ISP A probes, default route, nothing inbound |
| Probe eth1 (dongle) | 10.0.10.5/24 | SSH, web UI, ISP B control probes, no default gateway |
| ISP A first hop | 198.18.100.1 | First router past the CPE that answers ping |
| ISP A backbone | 198.18.101.1 | A core hop further upstream |
Figure 1: Probe topology: ISP A probes leave eth0 directly on the CPE, control probes ride ISP B through the FortiGate
Step 1: Fix the link monitor before you blame the ISP
Goal: Stop false failovers so you are chasing real loss.
Action: A link monitor pinging one public resolver is fragile. Many resolvers rate-limit or deprioritize ICMP, so a healthy circuit can lose a burst of pings to one target. With update-static-route enabled (the default), the FortiGate then removes the default route for a few seconds and resets sessions. Probe three independent providers and give it more tolerance.
config system link-monitor
    edit "wan1-sla"
        set srcintf "port1"
        set gateway-ip 198.18.10.30
        set server "1.1.1.1" "8.8.8.8" "9.9.9.9"
        set protocol ping
        set interval 500
        set failtime 10
        set recoverytime 5
        set update-static-route enable
    next
end
interval is in milliseconds and failtime counts missed probes, so 500 ms with a failtime of 10 means about five seconds of loss before the route is pulled. Defaults are documented in the FortiOS link-monitor CLI reference.
GUI Verification: Log and Report, System Events shows link-monitor up and down events with timestamps. Keep these; they become corroborating evidence later.
diagnose sys link-monitor statusStep 2: Flash and harden the Pi
Goal: A headless, key-only Linux host.
Action: In Raspberry Pi Imager, choose Raspberry Pi OS (other), then Raspberry Pi OS Lite (64-bit). In the settings screen set the hostname, your user, SSH with public-key only, and your time zone. Boot it on the internal LAN first, then update and install Docker.
sudo apt update && sudo apt full-upgrade -y
timedatectl                  # System clock synchronized: yes
curl -fsSL https://get.docker.com | sh
sudo usermod -aG docker $USER
sudo reboot
Verification: docker run --rm hello-world succeeds after the reboot. Accurate time matters more than anything else on this box; every piece of evidence is a timestamp.
Step 3: Two interfaces, two jobs
Goal: eth0 owns the default route onto ISP A. eth1 carries management with no default route, and anything sourced from its address returns through the FortiGate.
Action: NetworkManager handles both, including a source-based routing rule into a separate table. Run this while the Pi is still on the LAN; it writes the profiles without touching the live connection, so your SSH session survives.
#!/usr/bin/env bash
set -euo pipefail
LAN_GW=10.0.10.1

# Keep existing DHCP profiles from returning after reboot
nmcli -g NAME,TYPE con show | while IFS=: read -r n t; do
  [ "$t" = "802-3-ethernet" ] || continue
  case "$n" in isp-a|lan-mgmt) continue ;; esac
  nmcli con mod "$n" connection.autoconnect no
done

# eth0: ISP A, public static, default route
nmcli con add type ethernet ifname eth0 con-name isp-a \
  ipv4.method manual ipv4.addresses 198.18.10.29/27 \
  ipv4.gateway 198.18.10.30 ipv4.dns "1.1.1.1 8.8.8.8" \
  ipv6.method disabled

# eth1: LAN, no default route in main, own table 200
nmcli con add type ethernet ifname eth1 con-name lan-mgmt \
  ipv4.method manual ipv4.addresses 10.0.10.5/24 \
  ipv4.never-default yes \
  ipv4.routes "10.0.10.0/24 table=200, 0.0.0.0/0 $LAN_GW table=200" \
  ipv4.routing-rules "priority 100 from 10.0.10.5 table 200" \
  ipv6.method disabled
The routing rule is the trick: packets sourced from 10.0.10.5 (SSH replies, the web UI, the control probes) use table 200 and leave eth1 toward the FortiGate. Everything else follows the main table out eth0.
Verification: after the cable move in Step 7, ip rule shows from 10.0.10.5 lookup 200 and ip route show table 200 shows the default via 10.0.10.1.
Step 4: Lock down the public interface with nftables
Goal: eth0 answers nothing. Management only on eth1.
Action: Manage a single table so Docker’s own rules are left alone on reload. Install it now, enable it for boot, and do not load it until the cables move, or you will cut your own SSH session.
#!/usr/sbin/nft -f
table inet probe
delete table inet probe

table inet probe {
  chain input {
    type filter hook input priority filter; policy drop;
    iif "lo" accept
    ct state established,related accept
    ct state invalid drop
    iifname "eth1" tcp dport { 22, 80 } accept
    iifname "eth1" icmp type echo-request accept
    iifname "docker0" accept
  }
}
sudo install -m 0644 nftables.conf /etc/nftables.conf
sudo systemctl enable nftablesVerification: sudo nft list table inet probe after boot, and a scan of 198.18.10.29 from outside your network (a phone on cellular is enough) gets no answer, not even ping.
Step 5: Pin the control path to ISP B on the FortiGate
Goal: Probes sourced from 10.0.10.5 always leave through ISP B, so you have a clean comparison for the same minutes.
Action: An IP pool only changes what the source is translated to; it does not choose the egress interface. Routing does. Add a policy route, then a firewall policy that allows the traffic out port2 with NAT.
config router policy
    edit 0
        set input-device "lan"
        set src "10.0.10.5/255.255.255.255"
        set dst "0.0.0.0/0.0.0.0"
        set gateway 198.19.20.1
        set output-device "port2"
        set comments "Probe control path via ISP B"
    next
end
Policy routes are evaluated before the routing table, top down, and a route that names both a gateway and an interface only matches when that gateway is reachable through the interface. See FortiOS policy routes. Set the gateway explicitly: if ISP B’s default route has a higher distance, it is not in the active routing table while ISP A is up, so a lookup by interface alone can fail.
diagnose firewall proute list
diagnose sniffer packet port2 'host 10.0.10.5 and icmp' 4 10
GUI Verification: Network, Policy Routes lists the entry, and Policy and Objects shows hits on the LAN to port2 policy.
Step 6: SmokePing in Docker with layered targets
Goal: One-minute loss and latency for each layer of the ISP A path, plus the same internet targets through ISP B.
Action: Use the LinuxServer image with host networking so the probes use the Pi’s real interfaces and routing rule. The image keeps its configuration in /config and graphs in /data, and serves the UI under /smokeping/ (LinuxServer SmokePing docs).
services:
  smokeping:
    image: lscr.io/linuxserver/smokeping:latest
    container_name: smokeping
    network_mode: host
    environment:
      - PUID=1000
      - PGID=1000
      - TZ=America/New_York
    volumes:
      - ./config:/config
      - ./data:/data
    restart: unless-stopped
Put these three files in ./config before the first start. The FPing probe’s sourceaddress is a probe-level variable (it maps to fping’s -S option per the SmokePing FPing probe manual), so the control path gets its own subprobe.
Probes
*** Probes ***
+ FPing
binary = /usr/sbin/fping

++ FPingISPA

++ FPingISPB
sourceaddress = 10.0.10.5
Database
*** Database ***
step     = 60
pings    = 20

# consfn mrhb steps total
AVERAGE  0.5   1  20160
AVERAGE  0.5  15   8640
AVERAGE  0.5  60   8760
    MIN  0.5  15   8640
    MAX  0.5  15   8640
That is 20 pings every 60 seconds: 14 days at one-minute resolution, 90 days at 15 minutes, a year at one hour.
Targets
*** Targets ***
probe = FPingISPA
menu = Top
title = ISP A vs ISP B packet loss

+ ISPA
menu = ISP A (direct on CPE)
title = ISP A path from 198.18.10.29
++ cpe
menu = 1 CPE gateway
title = CPE 198.18.10.30
host = 198.18.10.30
++ access
menu = 2 ISP access
title = First answering hop 198.18.100.1
host = 198.18.100.1
++ backbone
menu = 3 ISP backbone
title = Backbone 198.18.101.1
host = 198.18.101.1
++ cloudflare
menu = 4 Cloudflare
title = 1.1.1.1
host = 1.1.1.1
++ google
menu = 4 Google
title = 8.8.8.8
host = 8.8.8.8

+ ISPB
menu = ISP B (control)
title = Control path via FortiGate
probe = FPingISPB
++ fortigate
menu = 1 FortiGate LAN
title = 10.0.10.1
host = 10.0.10.1
++ cloudflare
menu = 2 Cloudflare
title = 1.1.1.1 via ISP B
host = 1.1.1.1
++ google
menu = 2 Google
title = 8.8.8.8 via ISP B
host = 8.8.8.8
Find your own layer targets with traceroute -n 1.1.1.1 from the primary path. The first hop is the CPE. The next hop often ignores ping, which is normal; use the first hop past it that answers.
Step 7: Move the cables and start collecting
Goal: The probe in its permanent spot, everything starting on its own.
sudo shutdown -h now
# eth0 to a spare CPE LAN port, dongle to the LAN switch, Pi on the UPS
cd ~/probe/smokeping && docker compose up -d
docker logs -f smokepingNote the time of the move. That gap in the graphs is you, not the ISP.
Step 8: Hop-by-hop snapshots every 15 minutes
Goal: An mtr report near every event, so you can show the ISP the exact hop where loss started.
#!/usr/bin/env bash
OUT="$HOME/probe/mtr/$(date +%F)"
mkdir -p "$OUT"
{
  echo "# $(date '+%F %T %Z') source 198.18.10.29 (eth0)"
  mtr -rwzbc 100 -I eth0 1.1.1.1
} > "$OUT/$(date +%H%M).txt" 2>&1
find "$HOME/probe/mtr" -mindepth 1 -maxdepth 1 \
  -type d -mtime +60 -exec rm -rf {} +
(crontab -l 2>/dev/null; echo "*/15 * * * * $HOME/probe/mtr-capture.sh") | crontab -Verification and validation
Both paths must leave where you think they do. Check from the Pi:
curl -4 -s ifconfig.me; echo
curl -4 -s --interface 10.0.10.5 ifconfig.me; echo
ip rule; ip route show table 200
docker ps --format '{{.Names}} {{.Status}}'
Expected success output:
198.18.10.29
198.19.20.10
0:      from all lookup local
100:    from 10.0.10.5 lookup 200
...
default via 10.0.10.1 dev eth1
smokeping Up 10 minutes
The first address is the probe’s own static on ISP A. The second is ISP B’s public address. If the second one shows an ISP A address instead, the control traffic is matching your normal LAN policy; see the gotchas below. Open http://10.0.10.5/smokeping/ after an hour and drill into a single target for the most detail.
Reading the graphs: whose problem is it?
| Loss starts at | Points to | What to ask for |
|---|---|---|
| CPE gateway | Cable, port or the gateway itself | Gateway swap or a line test |
| ISP first hop | The ISP access network | Line test, dispatch, port check at the node |
| ISP backbone | Upstream in the ISP core | Escalation to network operations |
| Internet targets only | Peering or the destination | Usually not the access circuit |
| ISP B too, same minutes | Your side: power, LAN, the probe | Fix your house before calling anyone |
The ISP packet loss evidence package
- A list of events: date, time, duration and loss percentage.
- SmokePing graphs showing the layer where loss starts.
- The ISP B graphs for the same windows, showing a clean control.
- The mtr snapshot closest to each event.
- The CPE’s own event log entries and the FortiGate link-monitor events at the same timestamps.
A week of this, ideally covering a few link-monitor alerts, is a ticket front-line support cannot close with a reboot script.
Troubleshooting and gotchas
SSH key rejected on first boot
If ~/.ssh/authorized_keys is missing on the Pi, the key never got applied during imaging. Enabling password login with a file named 99-temp.conf can still fail, because sshd keeps the first value it reads for each setting. Check what is in effect, then name the override so it sorts first:
sudo sshd -T | grep -i passwordauthentication
echo "PasswordAuthentication yes" | \
  sudo tee /etc/ssh/sshd_config.d/00-temp.conf
sudo systemctl restart ssh
# from your workstation: ssh-copy-id user@10.0.10.5
sudo rm /etc/ssh/sshd_config.d/00-temp.conf
sudo systemctl restart ssh
Control probes still leave through ISP A
The traffic from 10.0.10.5 is hitting the normal LAN to WAN1 policy and its IP pool. Confirm the policy route’s input-device is the interface the LAN actually arrives on (a VLAN subinterface if you use one), and that it sits above other policy routes. Then watch the decision:
diagnose debug flow filter addr 10.0.10.5
diagnose debug flow show function-name enable
diagnose debug flow trace start 20
diagnose debug enable
The dongle is not called eth1
Some builds name USB adapters by MAC address. Check before running the network script, and edit ifname and the nftables rules to match.
ip -br link