
If you've spent any time configuring user authentication on... Full Story
By Manny Fernandez
August 1, 2026
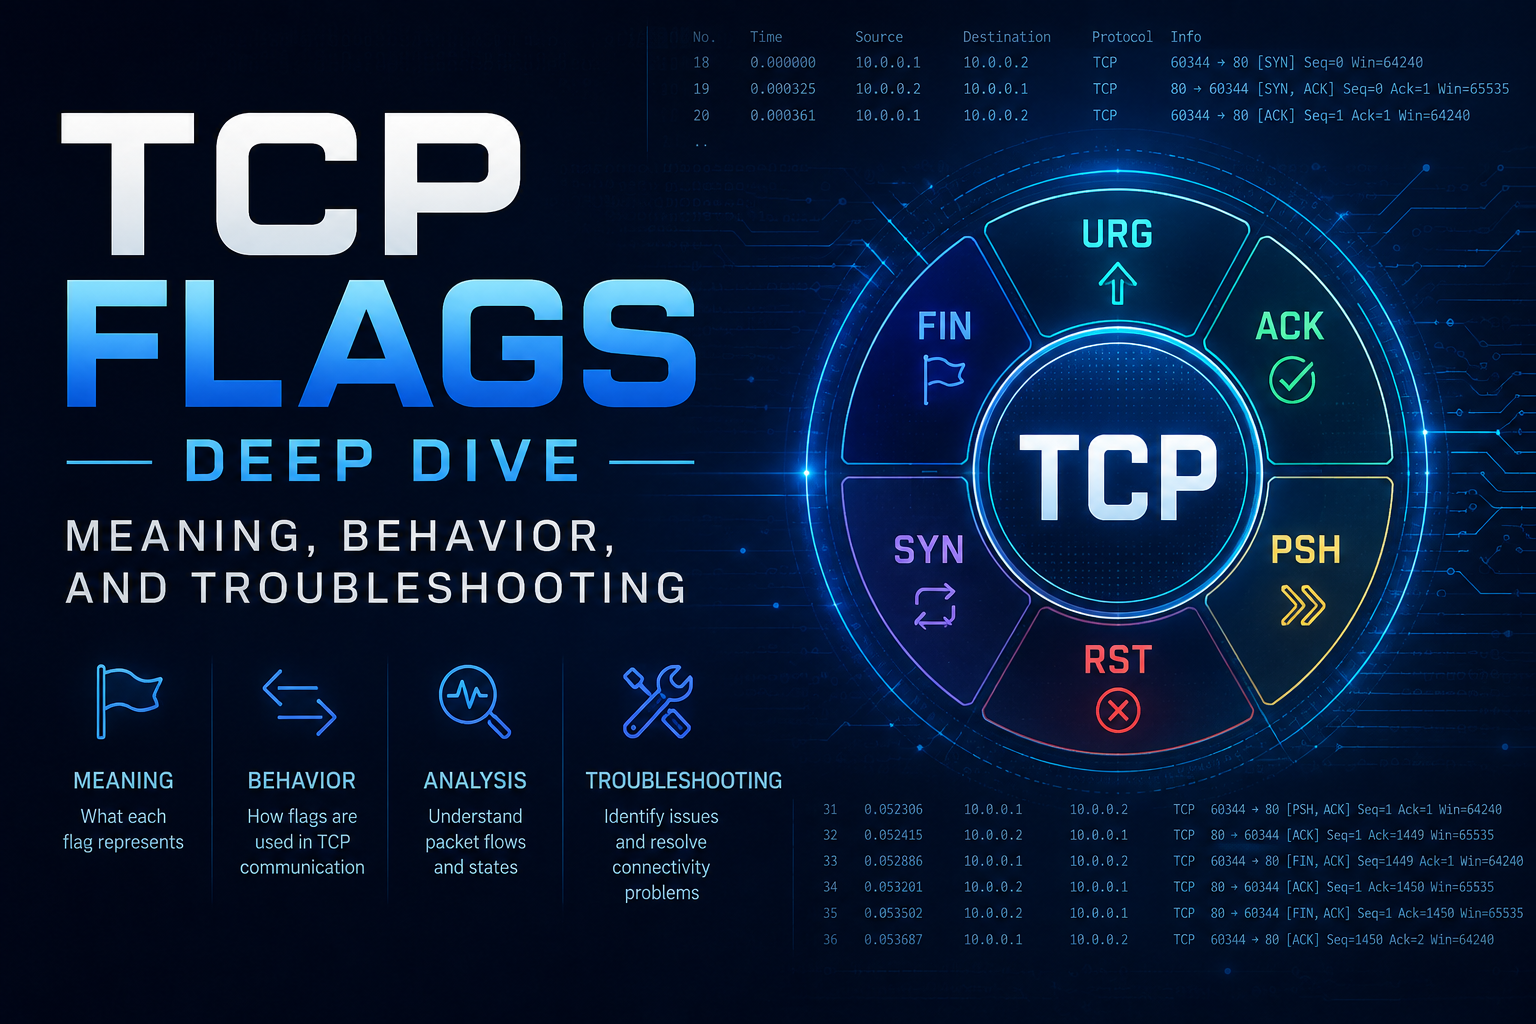
TCP Flags Deep Dive: Meaning, Behavior, and Troubleshooting
Objective: This guide breaks down all nine TCP control bits, traces exactly how they combine across a connection’s lifecycle from handshake to teardown, and shows how to read them in a live packet capture to diagnose real network and firewall problems. By the end, you will be able to look at a raw flags byte and know immediately what stage of the TCP state machine you are looking at, and why a connection reset, dropped, or stalled.
Target Audience: Network engineers, security engineers, SOC and NOC analysts, and anyone who needs to read a packet capture to resolve a connectivity or application issue.
Prerequisites & Architecture
Assumed Knowledge:
- TCP/IP fundamentals and the OSI Layer 4 transport model
- Basic packet capture experience with tcpdump or Wireshark
- Comfort at a Linux command line
- Basic FortiGate CLI familiarity for the FortiGate-specific sections (Phase 7)
Environment/Lab Requirements:
- 1x FortiGate running FortiOS 7.4 or later, acting as the gateway between the client and the internet-facing server
- 1x Linux client (Ubuntu 22.04 or later) with
tcpdump,iproute2, andhping3installed - 1x Linux server (Ubuntu 22.04 or later) running a TCP listener on port 443, with
tcpdumpinstalled - Wireshark or
tsharkon an analyst workstation for offline.pcapreview - Optional: tc netem on the client or server to simulate packet loss for the retransmission scenario in Troubleshooting
Component Table:
| Component | Role | Example Address |
|---|---|---|
| client-01 | Linux client initiating TCP sessions | 10.0.10.5 |
| fgt-lan | FortiGate internal interface, client default gateway | 10.0.10.1 |
| fgt-wan | FortiGate external interface | 198.18.10.2 |
| server-01 | Linux server, TCP listener on :443 | 198.18.20.10 |
| analyst-ws | Workstation running Wireshark for offline analysis | 10.0.10.50 |
Step-by-Step Implementation Workflow
Phase 1: Locate the Flags in the TCP Header
The Goal: Know exactly where the control bits live in the header so you can read them from a raw hex dump, not just a decoded summary line.
The Action: The TCP header’s first 12 bytes carry the source port, destination port, sequence number, and acknowledgment number. Byte 12 holds the 4 bit data offset, a 3 bit reserved field, and the NS bit. Byte 13 holds the eight flags most people mean when they say “TCP flags,” in this bit order from most significant to least significant: CWR, ECE, URG, ACK, PSH, RST, SYN, FIN.
| Flag | Byte 13 Bit | Hex Value |
|---|---|---|
| CWR | 7 | 0x80 |
| ECE | 6 | 0x40 |
| URG | 5 | 0x20 |
| ACK | 4 | 0x10 |
| PSH | 3 | 0x08 |
| RST | 2 | 0x04 |
| SYN | 1 | 0x02 |
| FIN | 0 | 0x01 |
Because every flag maps to a single bit, any combination is just the bits ORed together. A SYN-ACK is 0x02 | 0x10 = 0x12. A FIN-ACK is 0x01 | 0x10 = 0x11. A PSH-ACK is 0x08 | 0x10 = 0x18. Memorizing this small set of hex values is what lets you write precise capture filters later in Phase 6 instead of guessing.
The Code/CLI/Config: Confirm the byte offset yourself on a live SYN packet.
tcpdump -i eth0 -c 1 -xx 'tcp[tcpflags] & tcp-syn != 0 and tcp[tcpflags] & tcp-ack == 0'Look at the fourteenth byte of the TCP segment (offset 13, zero indexed) in the hex dump. On a bare SYN it reads 02.
Phase 2: Learn What Each Flag Actually Signals
The Goal: Move past “SYN starts a connection” and understand what each flag tells the receiving stack to do.
The Action: Study the table below before moving into live captures. It will save you from misreading a packet later.
| Flag | Set By | What It Tells the Receiver |
|---|---|---|
| SYN | Either endpoint, connection start | Synchronize initial sequence numbers, begin a new connection |
| ACK | Either endpoint, on almost every segment after the handshake | The acknowledgment number field is valid and should be processed |
| FIN | Either endpoint | The sender has no more data to send, begin graceful teardown |
| RST | Either endpoint | Abort the connection immediately, do not attempt graceful close |
| PSH | The sender | Deliver buffered data to the receiving application now instead of waiting for more |
| URG | The sender | The urgent pointer field marks priority data, rarely honored by modern stacks or middleboxes |
| ECE | Receiver in data phase, either side in the handshake | Echoes a received congestion mark, or negotiates ECN support in the SYN/SYN-ACK |
| CWR | The data sender | Confirms the sender received an ECE and reduced its congestion window in response |
| NS | The sender | ECN-nonce sum from RFC 3540, experimental and effectively unused in production networks |
Two flags do almost all the work you will care about day to day: SYN and ACK build and confirm the connection, FIN and RST end it two very different ways. PSH affects application-visible timing more than routing or security behavior. URG, ECE, CWR, and NS show up rarely enough that most engineers only need to recognize them, not troubleshoot around them.
GUI Verification: FortiGate’s Forward Traffic log (Log & Report > Forward Traffic) does not show individual flags. It shows the session outcome (Accept, Deny, or Close), which is the aggregate result of the flag sequence you are about to trace at the packet level.
Phase 3: Capture and Read the Three-Way Handshake
The Goal: Watch a connection open and confirm the sequence and acknowledgment number math lines up with what the flags claim is happening.
The Action: Start a capture on both the client and the FortiGate WAN interface at the same time, then initiate a connection from client-01 to server-01.
The Code/CLI/Config: On client-01:
tcpdump -i eth0 -nn 'host 198.18.20.10 and port 443' -w handshake.pcap
curl -sk https://198.18.20.10/ -o /dev/null
On the FortiGate CLI:
diagnose sniffer packet fgt-wan 'host 198.18.20.10 and port 443' 4 20 lExpected sequence, using simplified round-number sequence numbers for readability:
client-01 to server-01: Flags [S], seq 1000, ack 0, win 64240server-01 to client-01: Flags [S.], seq 5000, ack 1001, win 65160client-01 to server-01: Flags [.], seq 1001, ack 5001, win 64240
Packet 2 acknowledges packet 1’s sequence number plus one, because a SYN consumes one sequence number even though it carries no data. Packet 3 does the same in reverse. If you see a SYN answered by anything other than SYN-ACK or RST, something between the client and server is not behaving like a normal TCP stack, most often a firewall or load balancer.
GUI Verification: In FortiOS, go to Log & Report > Forward Traffic and filter on the destination IP. A successfully established session appears with Action: Accept and a Duration greater than zero. A session stuck at Duration: 0 with no further packets is a strong sign the SYN-ACK never made it back.
Phase 4: Read Flags During Data Transfer
The Goal: Understand what “normal” looks like once the connection is established, so abnormal patterns stand out later.
The Action: With the same capture running, let the HTTPS request complete and observe the PSH-ACK segments carrying the TLS handshake and application data.
The Code/CLI/Config:
tcpdump -i eth0 -nn 'host 198.18.20.10 and port 443 and (tcp[tcpflags] & tcp-push != 0)'Typical output during data transfer:
Flags [P.], seq 1001:1517, ack 5001, win 64240, length 516
Flags [.], ack 1517, win 65160, length 0
Flags [P.], seq 5001:6821, ack 1517, win 65160, length 1820
PSH-ACK segments carry data and ask the receiving application to consume it immediately. Bare ACK segments with length 0 are pure acknowledgments, common when a stack is acknowledging received data before it has anything of its own ready to send back. Neither pattern is a problem by itself. What you are training your eye for here is the baseline, so that a stream of retransmitted PSH-ACKs with no corresponding growth in the acknowledgment number, covered in Troubleshooting item 3, jumps out immediately.
Phase 5: Read the Two Teardown Paths, FIN and RST
The Goal: Distinguish a graceful close from an abrupt one, because they mean very different things when you are troubleshooting.
The Action: Close the connection normally first, then force a reset against a closed port, and compare the capture.
The Code/CLI/Config: Graceful close, initiated by the client after curl finishes:
Flags [F.], seq 1517, ack 6821
Flags [.], ack 1518
Flags [F.], seq 6821, ack 1518
Flags [.], ack 6822
This is the full four-packet close. Packets two and three often collapse into a single FIN-ACK when the server has no more data queued at the moment it acknowledges the client’s FIN, producing a three-packet variant instead. Either way, both sides explicitly agree the conversation is over, and the client-side socket enters TIME_WAIT for a period (2MSL, commonly 60 to 240 seconds depending on OS defaults) to catch any stray retransmissions.
Abrupt reset, connecting to a port with nothing listening:
hping3 -S -p 8443 -c 1 198.18.20.10Flags [S], seq 0, win 512
Flags [R.], seq 0, ack 1A single SYN met with an immediate RST-ACK means the destination host is reachable and its TCP stack is running, but nothing is listening on that port. Compare that against a SYN that is retransmitted several times with no response at all, which points to a firewall silently dropping the packet rather than a closed port, since a truly closed port on a reachable host always answers with RST.
GUI Verification: On the FortiGate, a policy configured with a Deny action and Log Violation Traffic enabled logs the dropped SYN under Log & Report > Forward Traffic with Action: Deny. If that log entry is absent for a connection you know left the client, the drop is happening upstream of the FortiGate, not on it.
Phase 6: Build Flag-Based Capture Filters
The Goal: Stop scrolling through full captures by eye and start filtering directly on the flag combination you are hunting for.
The Action: Use tcpdump’s named flag macros for readability, or the raw bitmask when you need to match an exact combination and nothing else.
The Code/CLI/Config: Isolate new connection attempts only (SYN set, ACK not set):
tcpdump -i eth0 'tcp[tcpflags] & (tcp-syn|tcp-ack) == tcp-syn'Isolate resets:
tcpdump -i eth0 'tcp[tcpflags] & tcp-rst != 0'Match an exact flags byte, such as a bare FIN with no ACK, which is unusual outside of some port-scanning tools:
tcpdump -i eth0 'tcp[13] == 0x01'Equivalent Wireshark display filters:
tcp.flags.syn == 1 and tcp.flags.ack == 0
tcp.flags.reset == 1
tcp.flags.fin == 1 and tcp.flags.ack == 0
The same syntax works on the FortiGate, since diagnose sniffer packet accepts standard BPF filter expressions:
diagnose sniffer packet fgt-wan 'tcp[tcpflags] & tcp-rst != 0' 4 0 lPhase 7: Correlate Wire Behavior with FortiGate Session State
The Goal: Connect what you saw on the wire in Phases 3 through 6 with what the FortiGate itself is tracking internally for that session.
The Action: While a connection from client-01 to server-01 is active, pull its session table entry and compare the reported state against the flags you captured.
The Code/CLI/Config:
diagnose sys session filter clear
diagnose sys session filter src 10.0.10.5
diagnose sys session filter dst 198.18.20.10
diagnose sys session list
The output includes proto=6 for TCP and a proto_state value that advances through FortiOS’s internal representation of the TCP state machine as the handshake progresses, alongside expire and timeout counters. A session sitting at an early proto_state with expire counting down fast and no further packets arriving is the session-table signature of a handshake that never completed, the same symptom you would see as repeated unanswered SYNs in a packet capture.
Two settings control how strictly the FortiGate enforces TCP sequence numbers against that state, and both are common sources of the mid-session RST behavior covered in Troubleshooting item 2:
config system global
    set anti-replay strict
endconfig system settings
set asymroute disable
endanti-replay is a global setting that governs how tightly the FortiGate validates sequence and acknowledgment numbers against the session’s expected window. asymroute is a per-VDOM setting that, when enabled, allows return traffic to take a different physical path than the FortiGate expects, at the cost of disabling most stateful inspection for that traffic. Leave both at their secure defaults unless you have a specific, understood routing reason to change them.
GUI Verification: Session-level detail like this is not exposed in the FortiGate GUI. The closest GUI view is the Session table under Monitor, which lists active sessions by source, destination, and port but does not surface proto_state or the anti-replay verdict.
Verification & Validation
Confirm the following before considering the lab, or a production capture, clean:
1. Handshake integrity: Capture a full connection open and confirm exactly three packets (SYN, SYN-ACK, ACK) with no retransmitted SYNs. Success looks like the sequence and acknowledgment numbers in Phase 3 matching exactly, with the SYN-ACK arriving in single-digit milliseconds on a LAN or within one round-trip time across the WAN.
2. Teardown integrity: Capture a full connection close and confirm the FIN from each side is answered by an ACK, with no RST appearing where a FIN was expected. On the client, ss -tan should show the socket transition to TIME-WAIT and disappear after the OS’s 2MSL timer expires, rather than vanishing abruptly or lingering in FIN-WAIT-1.
3. Session-table agreement: While the connection is active, diagnose sys session list on the FortiGate should show an expire value that resets close to the configured session TTL every time new data crosses the session, not a value that is perpetually near zero. A session whose expire never refreshes despite visible traffic in the packet capture indicates the FortiGate and the endpoints disagree about the state of the connection, which is the condition that precedes the mid-session resets covered next.
Troubleshooting & Gotchas
1. SYN goes unanswered versus SYN is immediately reset
These look similar from the client’s perspective (the connection fails) but point to opposite causes. No response at all, with the client’s OS retransmitting the SYN two or three times before giving up, means something is silently dropping the packet, most often a firewall policy with no explicit deny logged, or a routing black hole. An immediate RST-ACK in response to the SYN means the packet reached a live host whose TCP stack is running but has no listener on that port, which is an application or service problem, not a network path problem.
Diagnostic commands:
tcpdump -i eth0 -nn 'host 198.18.20.10 and tcp[tcpflags] & (tcp-syn|tcp-rst) != 0'diagnose sniffer packet fgt-wan 'host 198.18.20.10 and port 443' 4 20 lRun the capture simultaneously on the client and on both FortiGate interfaces (LAN and WAN). If the SYN appears on the LAN sniffer but never reaches the WAN sniffer, the FortiGate itself is the drop point, most likely a policy without an explicit allow for that destination or service. Check Log & Report > Forward Traffic for a Deny entry with the matching source, destination, and port.
2. Connection resets mid-session with no obvious client or server action
This is almost always either asymmetric routing tripping the FortiGate’s own sequence validation, or a security profile configured to actively reset rather than silently drop. Return traffic that takes a different physical path than the FortiGate expects arrives with sequence numbers the session table does not recognize as valid, and a strict anti-replay posture responds by resetting the session rather than passing the traffic.
Diagnostic commands:
diagnose sys session list filter dst 198.18.20.10
diagnose debug flow filter daddr 198.18.20.10
diagnose debug flow trace start 20
diagnose debug enable
The flow trace output shows exactly which check dropped or reset the packet, commonly reported as a sequence or state mismatch when the cause is asymmetric routing. Resolution is almost always a routing fix, ensuring both legs of the conversation transit the same FortiGate interface, rather than loosening anti-replay or enabling asymroute, both of which trade security for convenience and should be treated as a last resort with a documented business justification.
3. Retransmitted PSH-ACK segments with no progress, commonly a PMTUD black hole
When a capture shows the same PSH-ACK segment retransmitted several times with an unchanging acknowledgment number on the receiving side, and the segment size is close to a round number like 1460 or 1500 bytes, suspect a Path MTU Discovery failure rather than simple congestion. A device somewhere on the path is fragmenting or dropping oversized packets and, critically, not sending back the ICMP Fragmentation Needed message the sending stack relies on to shrink its packets, so the sender keeps retransmitting at a size that never gets through.
Diagnostic commands:
tcpdump -i eth0 -nn 'host 198.18.20.10 and tcp[tcpflags] & tcp-push != 0' -v
ping -M do -s 1472 198.18.20.10
Send an oversized, non-fragmentable ping and compare it against a normal-sized one. If small pings succeed but the large one simply times out with no response of any kind, something on the path is dropping oversized packets and swallowing the ICMP Fragmentation Needed message that should have told the sender to shrink its packets. The FortiGate-side fix is to lower the interface MTU so FortiOS derives a smaller MSS for sessions traversing it, avoiding dependence on a Fragmentation Needed message that may never survive the round trip:
config system interface
    edit "fgt-wan"
        set mtu-override enable
        set mtu 1400
    next
end
Recent posts
-

-

DNS is one of those technologies that quietly underpins... Full Story
-

BGP issues on FortiGate firewalls usually trace back to... Full Story
-

Every time your laptop talks to your router, a... Full Story
-

If you've spent any time configuring NAT on a... Full Story
-

If you have spent any time configuring firewall policies... Full Story
-

High availability on FortiGate is one of those features... Full Story
-

If you've configured SD-WAN on a FortiGate, you've almost... Full Story
-

FortiLink is the management protocol that turns a FortiSwitch... Full Story
-

FortiSwitches are pretty rock solid from Mean Time Between... Full Story
-

This is a quicky tip. Have you ever gone... Full Story
-

DNS is one of those quiet pieces of internet... Full Story
-

This article is an updated version of the previous... Full Story
-

You will add ns2 as a secondary (slave) BIND9... Full Story
-

In the process of deploying my lab, I needed... Full Story
-

RFC 8805, used to be known as Self-Correcting IP... Full Story
-

Years back, I wrote an article about certificate pinning. ... Full Story
-

FortiGates have the ability to send alerts to Microsoft... Full Story
-

In this post, I am going to walk through... Full Story
-

Troubleshooting VoIP on a FortiGate can feel like trying... Full Story
-

Prior to FortiOS 7.0, there were three commands to... Full Story
-

In this post, I am going to go over... Full Story
-

What we are going to do: We are going... Full Story
-

Choosing between FGCP (FortiGate Clustering Protocol) and FGSP (FortiGate... Full Story
-

Creating a VLAN on macOS (The "Pro" Move) A... Full Story
-

This blog post explores the logic behind how macOS... Full Story
-

Pretty Fly for a Wi-Fi Tell My Wi-Fi Love... Full Story
-

Part of my daily gig is creating BoMs (Bill-of-Materials)... Full Story
-

ICMP introduces several security risks, but careful filtering, rate... Full Story
-

The command diag debug application dhcps -1 enables full... Full Story
-

In the world of FortiOS, execute tac report is... Full Story
-

LLDP; What is it The Link Layer Discovery Protocol... Full Story
-

What it actually does When you run diagnose fdsm... Full Story
-

Monkey Bites are bite-sized, high-impact security insights designed for... Full Story
-

I have run macOS in macOS with Parallels but... Full Story
-

Don't be confused with my other FortiNAC posts where... Full Story
-

This is the third session in a multi-part article... Full Story
-

Today I was configuring key-based authentication on a FortiGate... Full Story
-

Netcat, often called the "Swiss Army knife" of networking,... Full Story
-

At its core, IEEE 802.1X is a network layer... Full Story
-

In case you did not see the previous FortiNAC... Full Story
-

This is our 5th session where we are going... Full Story
-

Now that we have Wireshark installed and somewhat configured,... Full Story
-

The Philosophy of Packet Analysis Troubleshooting isn't about looking... Full Story
-

InfoSecMonkey Threat Response October 24, 2026 | No fluff.... Full Story
-

InfoSecMonkey Threat Response October 24, 2026 | No fluff.... Full Story
-

Plus what you actually get with FortiCare Essential, Premium... Full Story