If you've spent any time configuring user authentication on... Full Story
By Manny Fernandez
April 23, 2020

Troubleshooting FortClient VPN Connectivity Issues with FortiGate
As more and more users are using remote access VPNs and probably using FortiClient, I wanted to share the errors you are encountering based on the percentage when it fails and some troubleshooting steps around Remote Access VPNs.
Percentage and Possible Issue
- 10% – Local Network/PC issue
- 40% – Application or the Fortigate causing the error, occasionally caused by the local machines/network setup
- 45% – MultiFactor Authentication
- 80% – Username/Password issue
- 98% – corruption of services/often resolved by reinstalling the client on the laptop.
Here are some troubleshooting commands for the SSL VPNs on the FortiGate. You can run them from the GUI Console screen or by using your favorite terminal application (e.g. SecureCRT, PuTTY, ZOC, etc.)
![]()
di deb reset
di deb app sslvpn -1
di deb en
Set the terminal to capture the output to a file. This will be useful to provide to TAC if needed.
diag deb reset
diag deb console time en
diag deb app fnbamd -1
diag deb en
The commands above will troubleshoot authentication on the FortiGate
Gathering FortiClient Logs
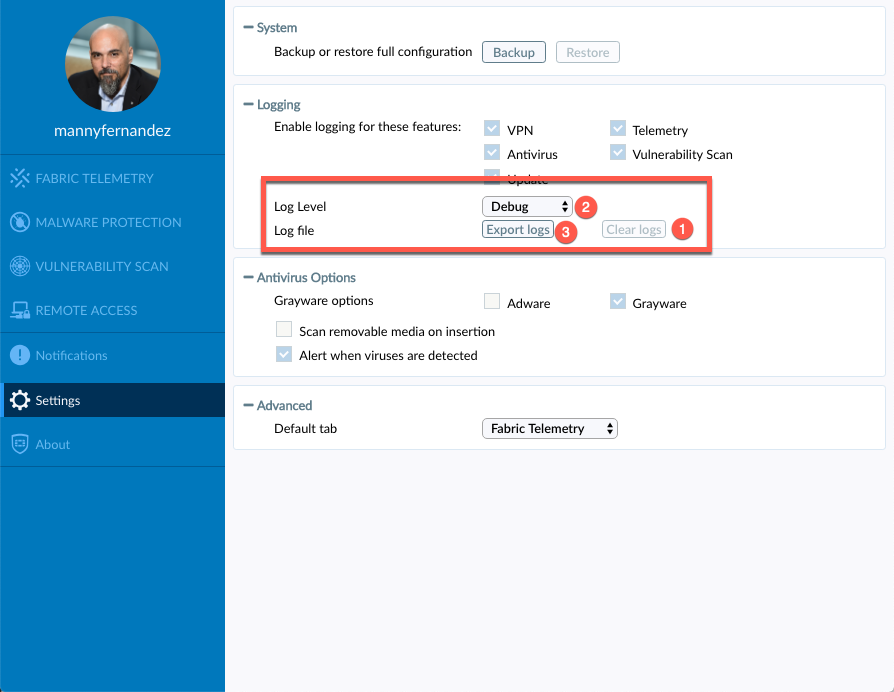
You will want to:
- Clear the logs if you have any there.
- Set the
Log LeveltoDebugto ensure the highest verbosity. (Make sure to disabled after troubleshooting) - Run the attempt, and then
Export logs
These can be uploaded to TAC.
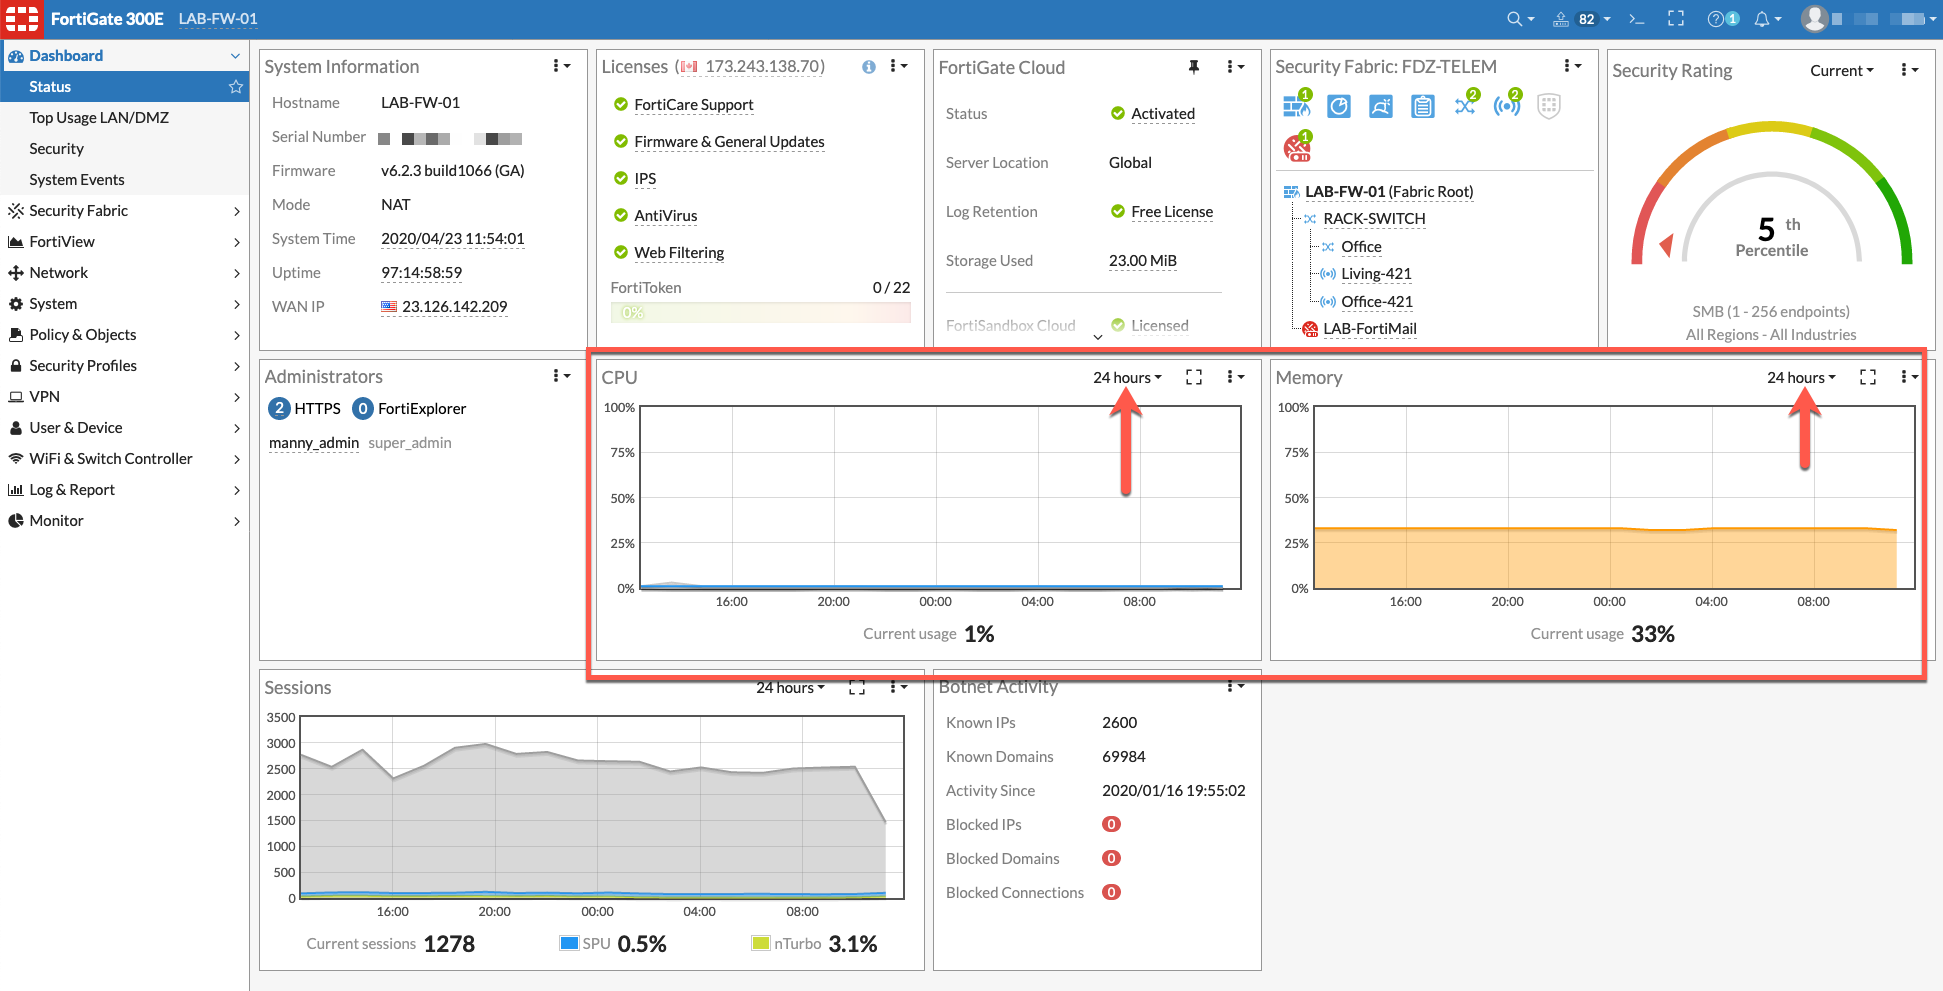
Viewing Performance Settings on FortiGate GUI
You can log into the FortiGate and under the Dashboard, set the time rage filter to 24 Hours for Memory, CPU and even Sessions
On the command line, you can use the following methods and commands
Viewing Performance Settings on FortiGate CLI
diagnose sys top
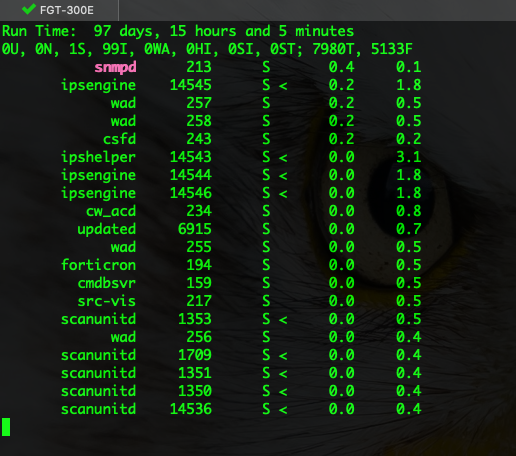
Once the TOP screen is displayed, you can use the letters below to filter the output differently.
U is % of user space applications using CPU. In the example, 0U means 0% of the user space applications are using CPU.
S is % of system processes (or kernel processes) using CPU. In the example, 0S means 0% of the system processes are using the CPU.
I is % of idle CPU. In the example, 98I means the CPU is 98% idle.
T is the total FortiOS system memory in Mb. In the example, 123T means there are 123 Mb of system memory.
F is free memory in Mb. In the example, 25F means there is 25 Mb of free memory.
KF is the total shared memory pages used. In the example, 32KF means the system is using 32 shared memory pages.
Finally, you may need to trace connections and/or do some packet captures here are two examples of that.
Pinging and Source Pinging
Sometimes you want to perform a straight ping to test connectivity from the firewall to a remote access VPN device. You can do that with the standard exec ping %host% however sometimes, you may want to source the ping from the inside interface or dmz interface. Below are the commands.
execute ping-options ?
execute ping-options source <ip-address-of-the-interface>
execute ping <hostname|ip>
Flow Trace
Now I will show a flow trace from my computer to 4.2.2.2
diagnose debug reset
diagnose debug flow filter saddr 10.22.22.122
diagnose debug flow filter daddr 10.100.1.1
diagnose debug flow show function-name enable
diagnose debug enable
diagnose debug flow trace start 100  #display the next 100 packets, after that, disable the flow:

When complete, you can disable manually with

diagnose debug disable
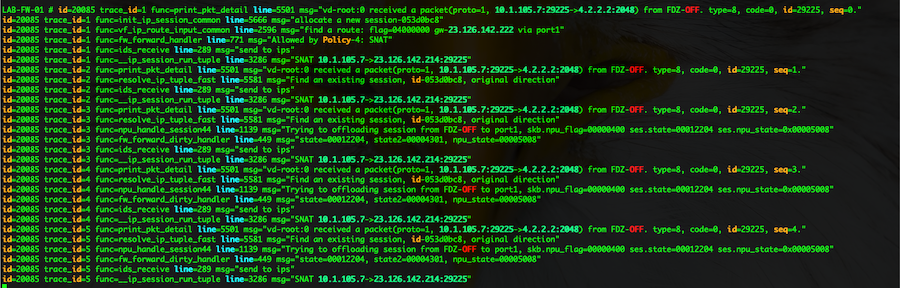
In the output, it will show you what interface the connection came in on, because of the function-name enable you will see NAT, Routing, etc, IPS, offloading to NPU and SPUs, etc.
Sessions
You can also see the sessions using the following commands
diagnose sys session filter clear
diagnose sys session filter dst 4.2.2.2
diagnose sys session filter dport 53
diagnose sys session list           #show the session table with the filter just set
Use the filter that work for you from a source or destination as well as ports
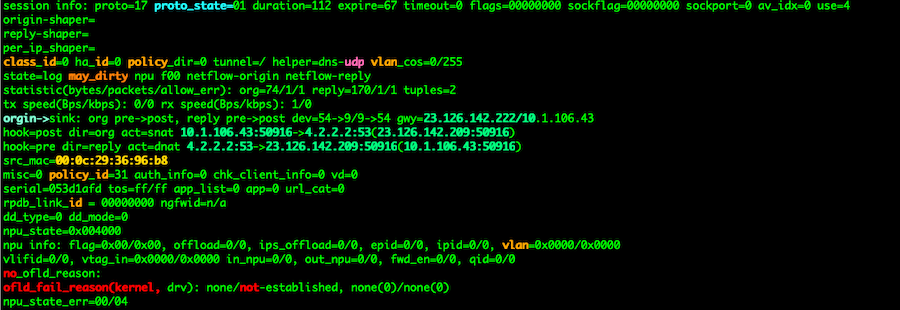
With this filter, you can clear the sessions based on the filter you created by issuing the diagnose sys session clear NOTE: Without the filter in place, you will clear ALL sessions on the FortiGate. It is always a good habit to run diag sys session filter ? to list the filter you have configured.
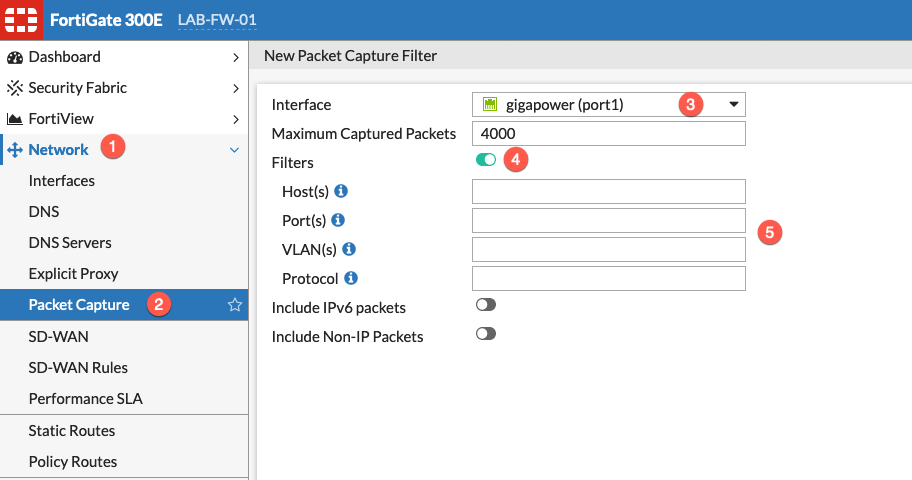
Packet Capture
You can either use the GUI or the CLI to run packet captures.
diagnose sniffer packet any 'host 8.8.8.8' 4 4 l
diagnose sniffer packet any 'host 8.8.8.8 and dst port 53' 4 10 a
diagnose sniffer packet wan1 'dst port (80 or 443)' 2 50 l
The verbosity is controlled by the following:
verbose:
1: print header of packets
2: print header and data from ip of packets
3: print header and data from ethernet of packets (if available)
4: print header of packets with interface name
5: print header and data from ip of packets with interface name
6: print header and data from ethernet of packets (if available) with intf name
count: number of packets
time-format:
a: UTC time
l: local time
You can use the GUI by going to Network then Packet Capture then Create . You will then be able to choose the interface you want to capture on and optionally you can enable the filters, and choose as needed. This will give you the opportunity to download the PCAP file and launch it with Wireshark, which you SHOULD have on your computer
Hope this helps
Recent posts
-

-

DNS is one of those technologies that quietly underpins... Full Story
-

BGP issues on FortiGate firewalls usually trace back to... Full Story
-

Every time your laptop talks to your router, a... Full Story
-

If you've spent any time configuring NAT on a... Full Story
-

If you have spent any time configuring firewall policies... Full Story
-

High availability on FortiGate is one of those features... Full Story
-

If you've configured SD-WAN on a FortiGate, you've almost... Full Story
-

FortiLink is the management protocol that turns a FortiSwitch... Full Story
-

FortiSwitches are pretty rock solid from Mean Time Between... Full Story
-

This is a quicky tip. Have you ever gone... Full Story
-

DNS is one of those quiet pieces of internet... Full Story
-

This article is an updated version of the previous... Full Story
-

You will add ns2 as a secondary (slave) BIND9... Full Story
-

In the process of deploying my lab, I needed... Full Story
-

RFC 8805, used to be known as Self-Correcting IP... Full Story
-

Years back, I wrote an article about certificate pinning. ... Full Story
-

FortiGates have the ability to send alerts to Microsoft... Full Story
-

In this post, I am going to walk through... Full Story
-

Troubleshooting VoIP on a FortiGate can feel like trying... Full Story
-

Prior to FortiOS 7.0, there were three commands to... Full Story
-

In this post, I am going to go over... Full Story
-

What we are going to do: We are going... Full Story
-

Choosing between FGCP (FortiGate Clustering Protocol) and FGSP (FortiGate... Full Story
-

Creating a VLAN on macOS (The "Pro" Move) A... Full Story
-

This blog post explores the logic behind how macOS... Full Story
-

Pretty Fly for a Wi-Fi Tell My Wi-Fi Love... Full Story
-

Part of my daily gig is creating BoMs (Bill-of-Materials)... Full Story
-

ICMP introduces several security risks, but careful filtering, rate... Full Story
-

The command diag debug application dhcps -1 enables full... Full Story
-

In the world of FortiOS, execute tac report is... Full Story
-

LLDP; What is it The Link Layer Discovery Protocol... Full Story
-

What it actually does When you run diagnose fdsm... Full Story
-

Monkey Bites are bite-sized, high-impact security insights designed for... Full Story
-

I have run macOS in macOS with Parallels but... Full Story
-

Don't be confused with my other FortiNAC posts where... Full Story
-

This is the third session in a multi-part article... Full Story
-

Today I was configuring key-based authentication on a FortiGate... Full Story
-

Netcat, often called the "Swiss Army knife" of networking,... Full Story
-

At its core, IEEE 802.1X is a network layer... Full Story
-

In case you did not see the previous FortiNAC... Full Story
-

This is our 5th session where we are going... Full Story
-

Now that we have Wireshark installed and somewhat configured,... Full Story
-

The Philosophy of Packet Analysis Troubleshooting isn't about looking... Full Story
-

1. Executive Summary Objective: This guide turns a FortiAuthenticator... Full Story
-

DISCLAIMER: Please see link above for the official Fortinet... Full Story
-

The underlying assumption that Let’s Encrypt requires you to... Full Story