If you've spent any time configuring user authentication on... Full Story
By Manny Fernandez
April 1, 2020
Deploying Grafana and Monitoring your AWS environment
Today I deployed Grafana in my lab environment. I am hoping to to get this pulling from FortiAnalyzer in the future or “directly” to the Fortigate using SNMP. There is a way of doing it in an article I read using Prometheus but I do not want to install another solution. More to follow. Lets get started.
“Grafana is open source visualization and analytics software. It allows you to query, visualize, alert on, and explore your metrics no matter where they are stored.
In plain English, it provides you with tools to turn your time-series database (TSDB) data into beautiful graphs and visualizations.” ~ Grafana Website
After deploying a standard Ubuntu Server (I will not cover the install here), I installed Grafana. Here is the step-by-step.
Once the Ubuntu server is deployed and you have assigned an IP address (I have an article on changing from DHCP to Static) you can get started on installing Grafana.
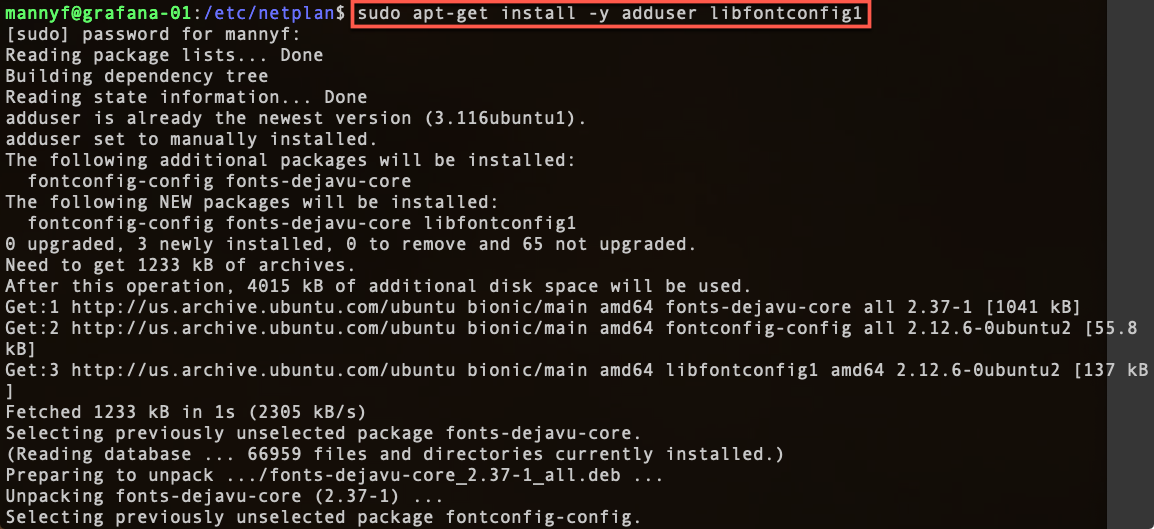
Run the following commands:
sudo apt-get install -y adduser libfontconfig1
You will need to check the Grafana website to see what the lates version is. You will need it for the next section. You will need to cd to a directory / folder where you will download the file. I used ~ which is …
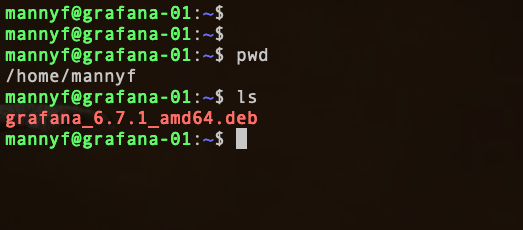
wget https://dl.grafana.com/oss/release/grafana_6.7.1_amd64.deb
Once you have the file downloaded with wget you need to install the package
sudo dpkg -i grafana_6.7.1_amd64.deb
Next we want to start the services
sudo systemctl daemon-reload
sudo systemctl start grafana-server
sudo systemctl status grafana-server
Next we want to make sure the Grafana service starts at boot up.
sudo service grafana-server start
sudo service grafana-server status
Now you are ready to connect to the Grafana GUI

You can connect to the GUI by browsing to http://X.X.X.X:30000 (where X.X.X.X is the IP address you assigned to the Grafana Ubuntu server)
The initial login is admin password is admin
You will be forced to change the password

Create your new password and hit save
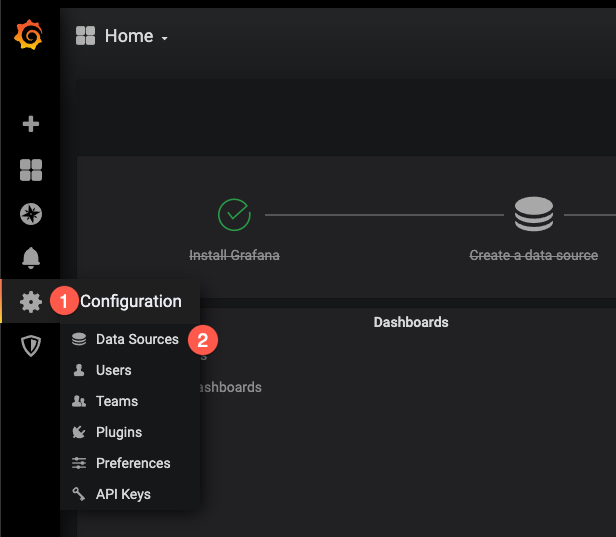
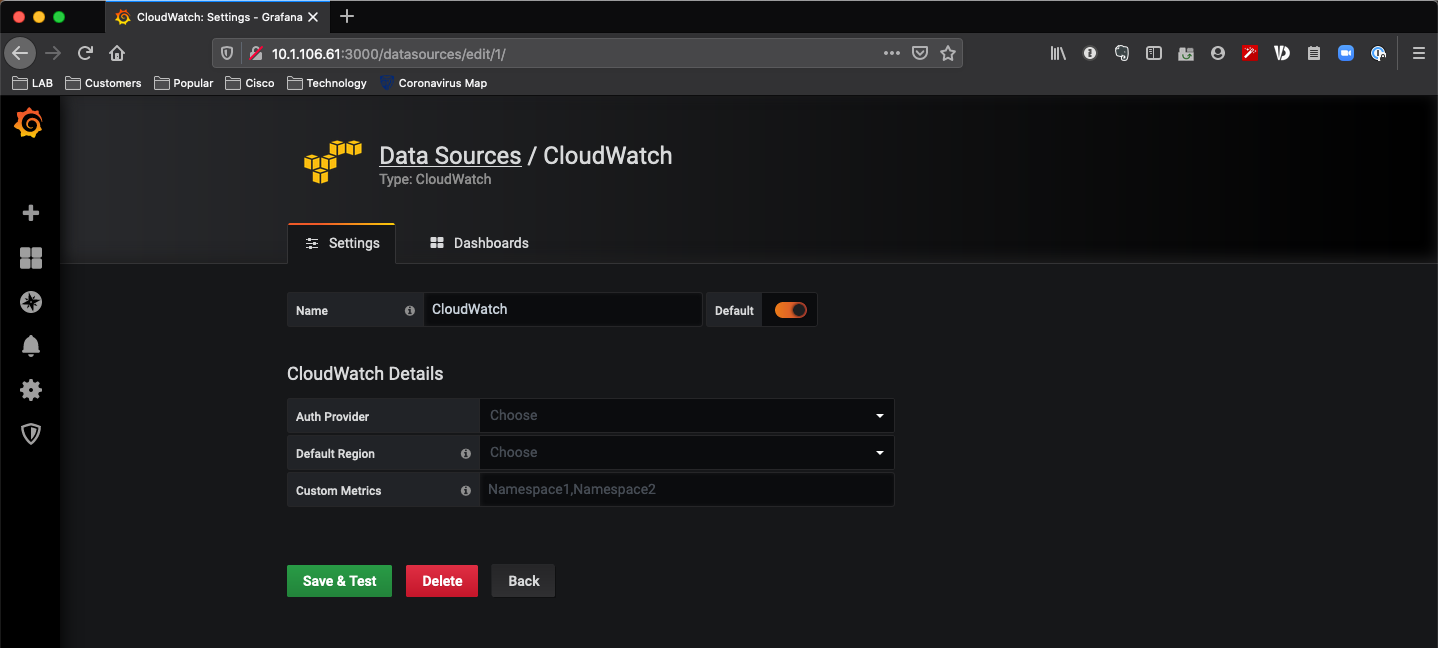
Choose the cog icon and choose Data Sources
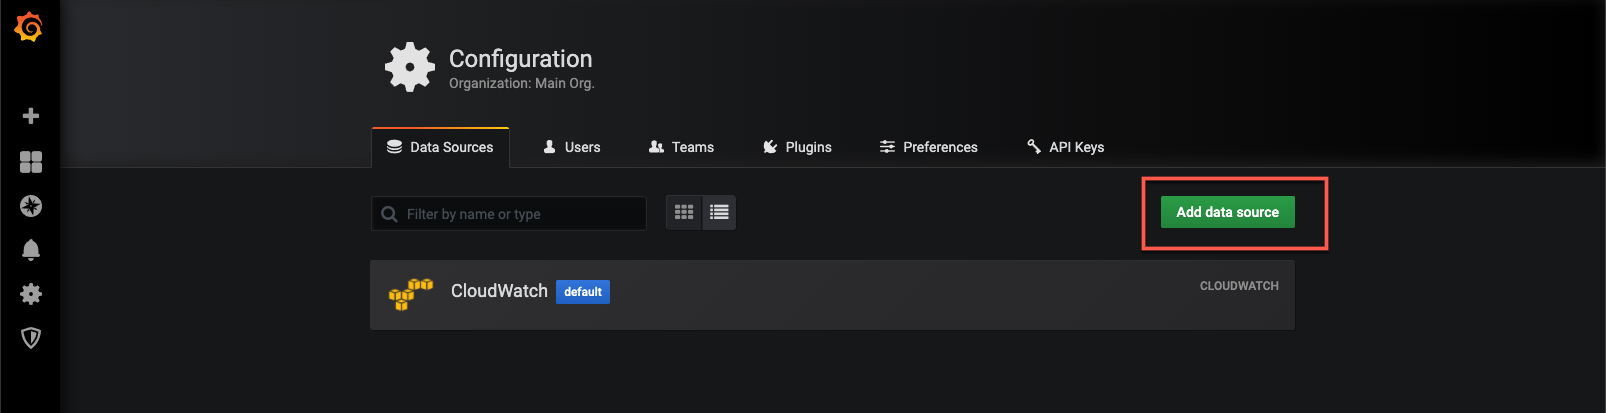
You can now Add Data Source . I have already added my cloud watch in this screenshot, but yours will be blank.
You should have the credentials to your AWS environment. In my case, I am using IAM and it will provide an access key and secret access key
Here is the JSON for the IAM Policy.
{
  "Version": "2012-10-17",
  "Statement": [
    {
      "Sid": "AllowReadingMetricsFromCloudWatch",
      "Effect": "Allow",
      "Action": [
        "cloudwatch:DescribeAlarmsForMetric",
        "cloudwatch:ListMetrics",
        "cloudwatch:GetMetricStatistics",
        "cloudwatch:GetMetricData"
      ],
      "Resource": "*"
    },
    {
      "Sid": "AllowReadingTagsInstancesRegionsFromEC2",
      "Effect": "Allow",
      "Action": ["ec2:DescribeTags", "ec2:DescribeInstances", "ec2:DescribeRegions"],
      "Resource": "*"
    },
    {
      "Sid": "AllowReadingResourcesForTags",
      "Effect": "Allow",
      "Action": "tag:GetResources",
      "Resource": "*"
    }
  ]
}
Hope this helps someone
Recent posts
-

-

DNS is one of those technologies that quietly underpins... Full Story
-

BGP issues on FortiGate firewalls usually trace back to... Full Story
-

Every time your laptop talks to your router, a... Full Story
-

If you've spent any time configuring NAT on a... Full Story
-

If you have spent any time configuring firewall policies... Full Story
-

High availability on FortiGate is one of those features... Full Story
-

If you've configured SD-WAN on a FortiGate, you've almost... Full Story
-

FortiLink is the management protocol that turns a FortiSwitch... Full Story
-

FortiSwitches are pretty rock solid from Mean Time Between... Full Story
-

This is a quicky tip. Have you ever gone... Full Story
-

DNS is one of those quiet pieces of internet... Full Story
-

This article is an updated version of the previous... Full Story
-

You will add ns2 as a secondary (slave) BIND9... Full Story
-

In the process of deploying my lab, I needed... Full Story
-

RFC 8805, used to be known as Self-Correcting IP... Full Story
-

Years back, I wrote an article about certificate pinning. ... Full Story
-

FortiGates have the ability to send alerts to Microsoft... Full Story
-

In this post, I am going to walk through... Full Story
-

Troubleshooting VoIP on a FortiGate can feel like trying... Full Story
-

Prior to FortiOS 7.0, there were three commands to... Full Story
-

In this post, I am going to go over... Full Story
-

What we are going to do: We are going... Full Story
-

Choosing between FGCP (FortiGate Clustering Protocol) and FGSP (FortiGate... Full Story
-

Creating a VLAN on macOS (The "Pro" Move) A... Full Story
-

This blog post explores the logic behind how macOS... Full Story
-

Pretty Fly for a Wi-Fi Tell My Wi-Fi Love... Full Story
-

Part of my daily gig is creating BoMs (Bill-of-Materials)... Full Story
-

ICMP introduces several security risks, but careful filtering, rate... Full Story
-

The command diag debug application dhcps -1 enables full... Full Story
-

In the world of FortiOS, execute tac report is... Full Story
-

LLDP; What is it The Link Layer Discovery Protocol... Full Story
-

What it actually does When you run diagnose fdsm... Full Story
-

Monkey Bites are bite-sized, high-impact security insights designed for... Full Story
-

I have run macOS in macOS with Parallels but... Full Story
-

Don't be confused with my other FortiNAC posts where... Full Story
-

This is the third session in a multi-part article... Full Story
-

Today I was configuring key-based authentication on a FortiGate... Full Story
-

Netcat, often called the "Swiss Army knife" of networking,... Full Story
-

At its core, IEEE 802.1X is a network layer... Full Story
-

In case you did not see the previous FortiNAC... Full Story
-

This is our 5th session where we are going... Full Story
-

Now that we have Wireshark installed and somewhat configured,... Full Story
-

The Philosophy of Packet Analysis Troubleshooting isn't about looking... Full Story
-

You have twenty years of muscle memory. You type... Full Story
-

Have you ever wanted to do some testing on... Full Story
-

Ask ten engineers to define "a network" and you... Full Story