If you've spent any time configuring user authentication on... Full Story
By Manny Fernandez
January 5, 2020
FortiAnalyzer Primer
Wanted to write an article about the FortiAnalyzer also known as FAZ . FAZ is a great solution that is “CFO Friendly” in the sense that it is very affordable. From a feature to price point, the benefits are astronomical. FAZ comes in a few “flavors”. The most popular is the VM version. With this version, you can grow into your deployment. The base product is $1,800.00 list price (Not including support) and includes 1GB of log ingestion per day. You can then increase 1GB, 5GB, 25GB, 100GB, 2TB. Support starts at $720 list price up to 16K list. The other option is Hardware Appliance. With this option, it is a pre-defined number of logs per day depending on the appliance and the support is also maxed at whatever the appliance can handle. The last option is SaaS which at the time of this article does not have feature parity but it is well on its way.
Lets get started because we have a lot to cover
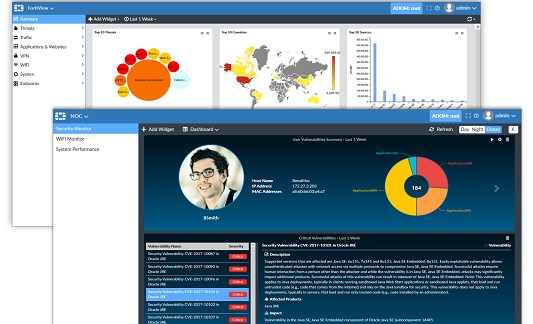
Main Screen
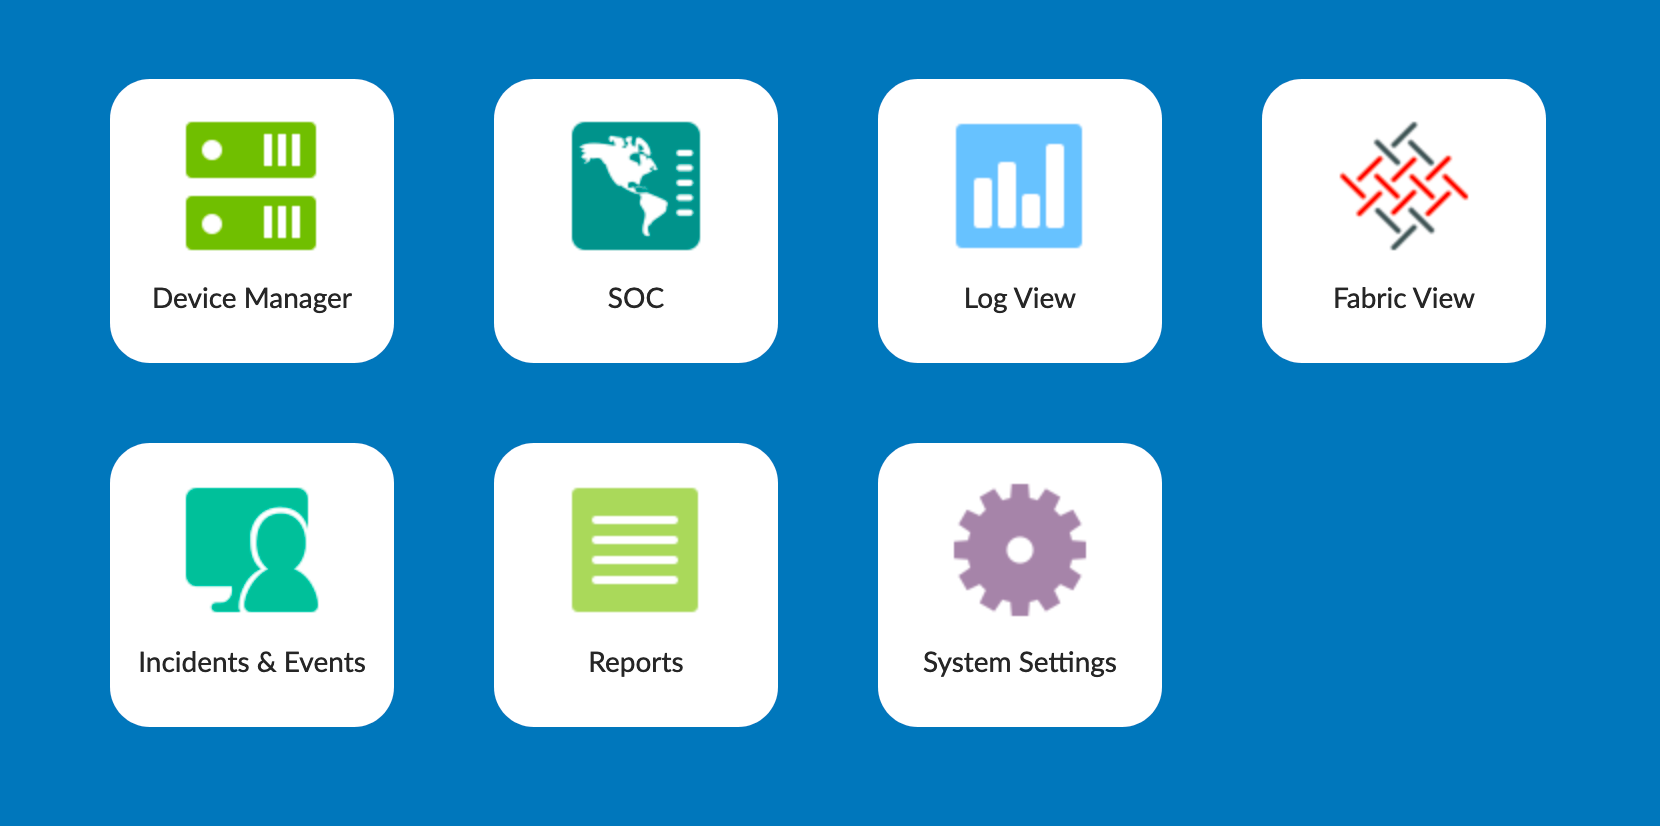
When you log into the FAZ, you will have the different sections as seen above.
There is an ADOM feature that allows you to create virtual FAZ’s if you will which can be used or thought of as multi-tenant. A use-case for this would be a “City of” that might have City Hall, parks, water treatment, etc firewalls that is handled by the City IT team. However the Police Department (PD) usually has their own IT staff because of the segmentation that is required. With ADOMs you can have Fortinet devices reporting to an ADOM and only authorized people would be able to see those devices without seeing others in different ADOMs

You can choose the ADOM by clicking the top right button next to the name.
Device Manager

By selecting the Device Manager you are presented the device configuration page
- Shows you how many devices you have assigned to this
ADOM. - These are the devices that have not yet been authorized. You will need to authorize it before it can start forwarding logs.
- This section shows you devices that are disconnected. This is obviously not something you want to see above zero unless it is under maintenance.
- Shows you the amount of storage available for this
ADOM - Shows that status for this particular device. The lock shows that the logs are encrypted (See below).
- This number is the amount of logs per second. This is good for capacity planning.

The above graphic is from the Fortigate under Log & Report then Log Settings
SOC
FortiView
Under the SOC section of the main screen, there are many options.
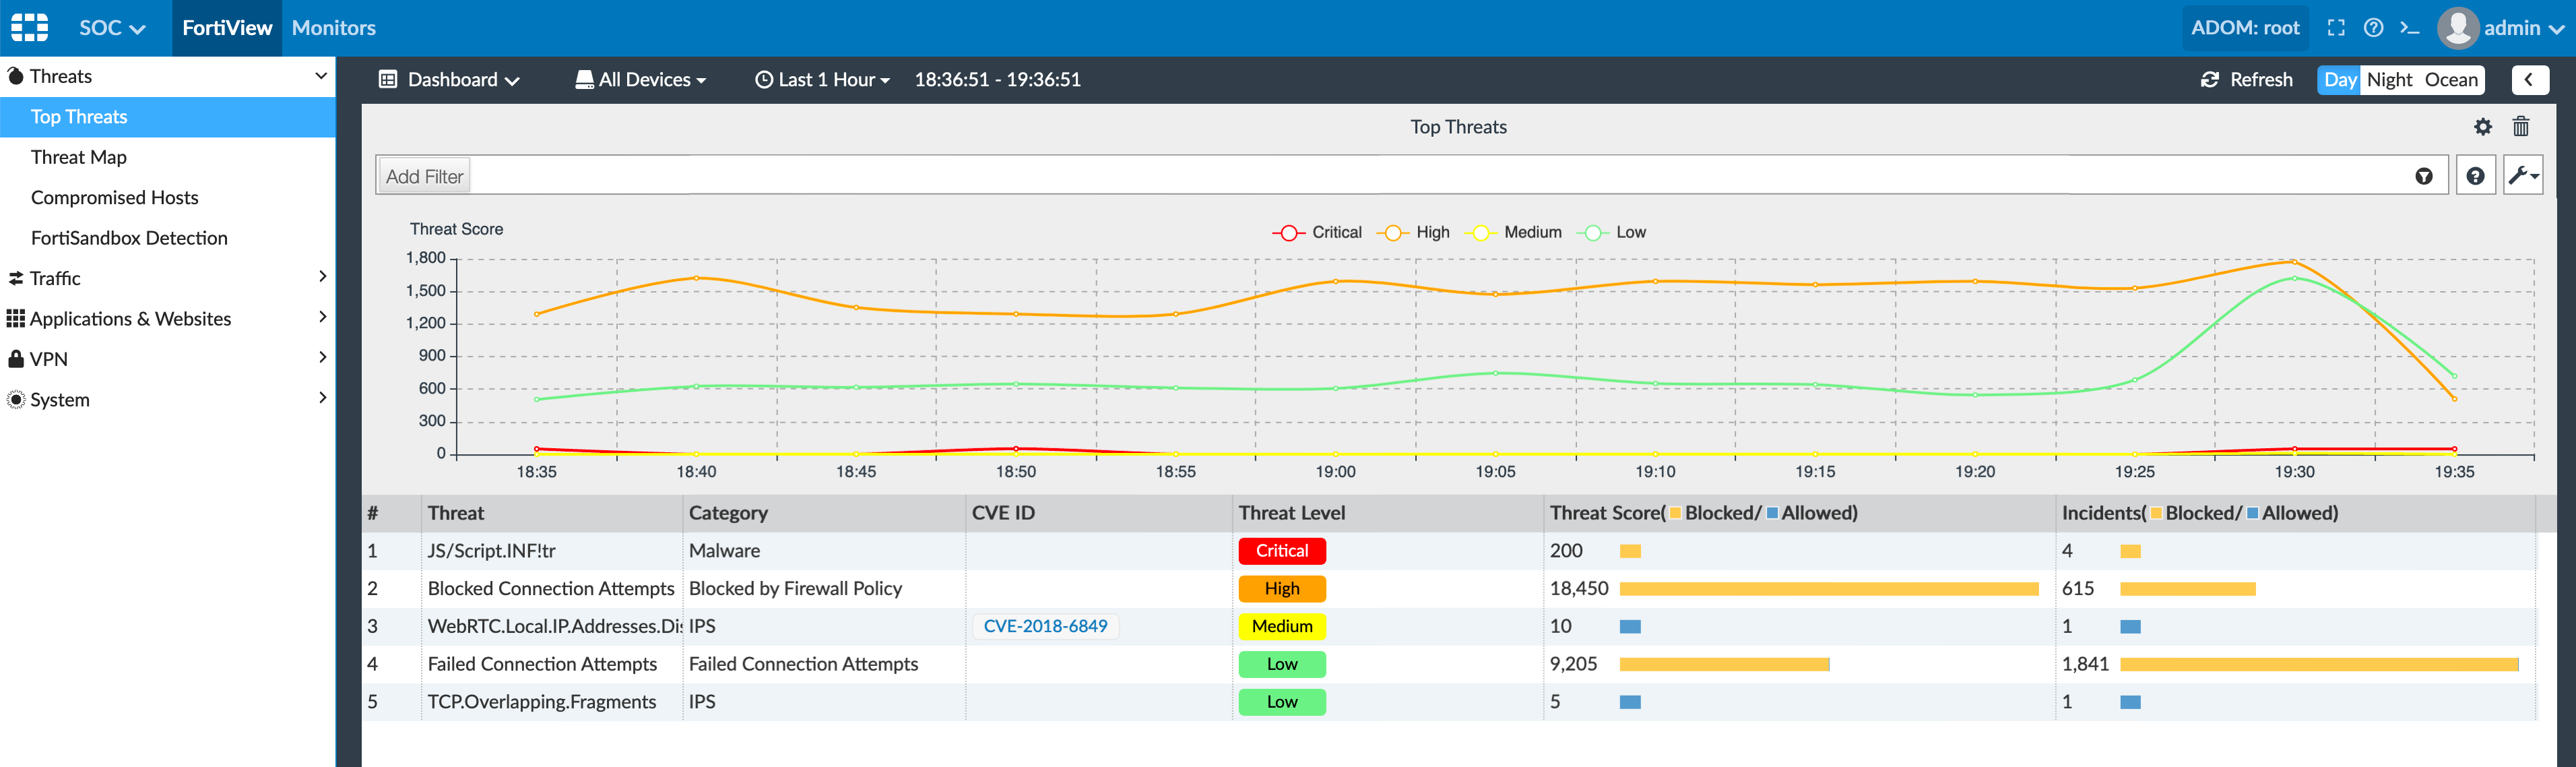
Under the Top Threats section on the left, you will see the top threats. The yellow bar shows threats that were allows while the blue represents traffic it has passed. By double clicking any of the threats, it will drill down and you can see the specific sessions with the corresponding source and destination.
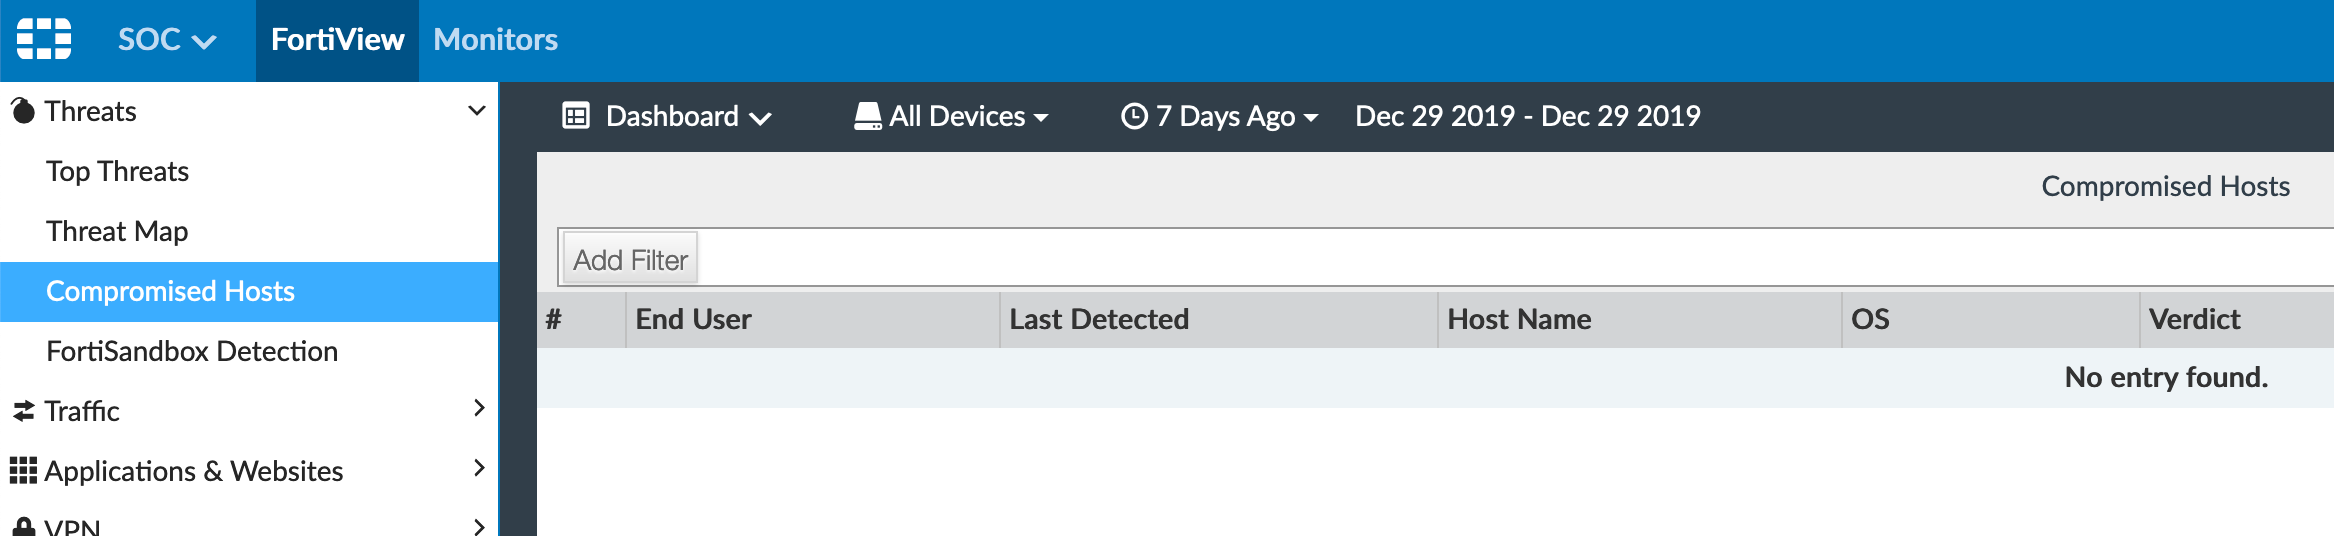
Under Compromised Hosts you can use the optional IOC license available through your Fortinet partner. This is a subscription. This gives you the ability to use Automation on FortiOS 6x. Where you can block and/or alert on devices that have been identified as Compromised
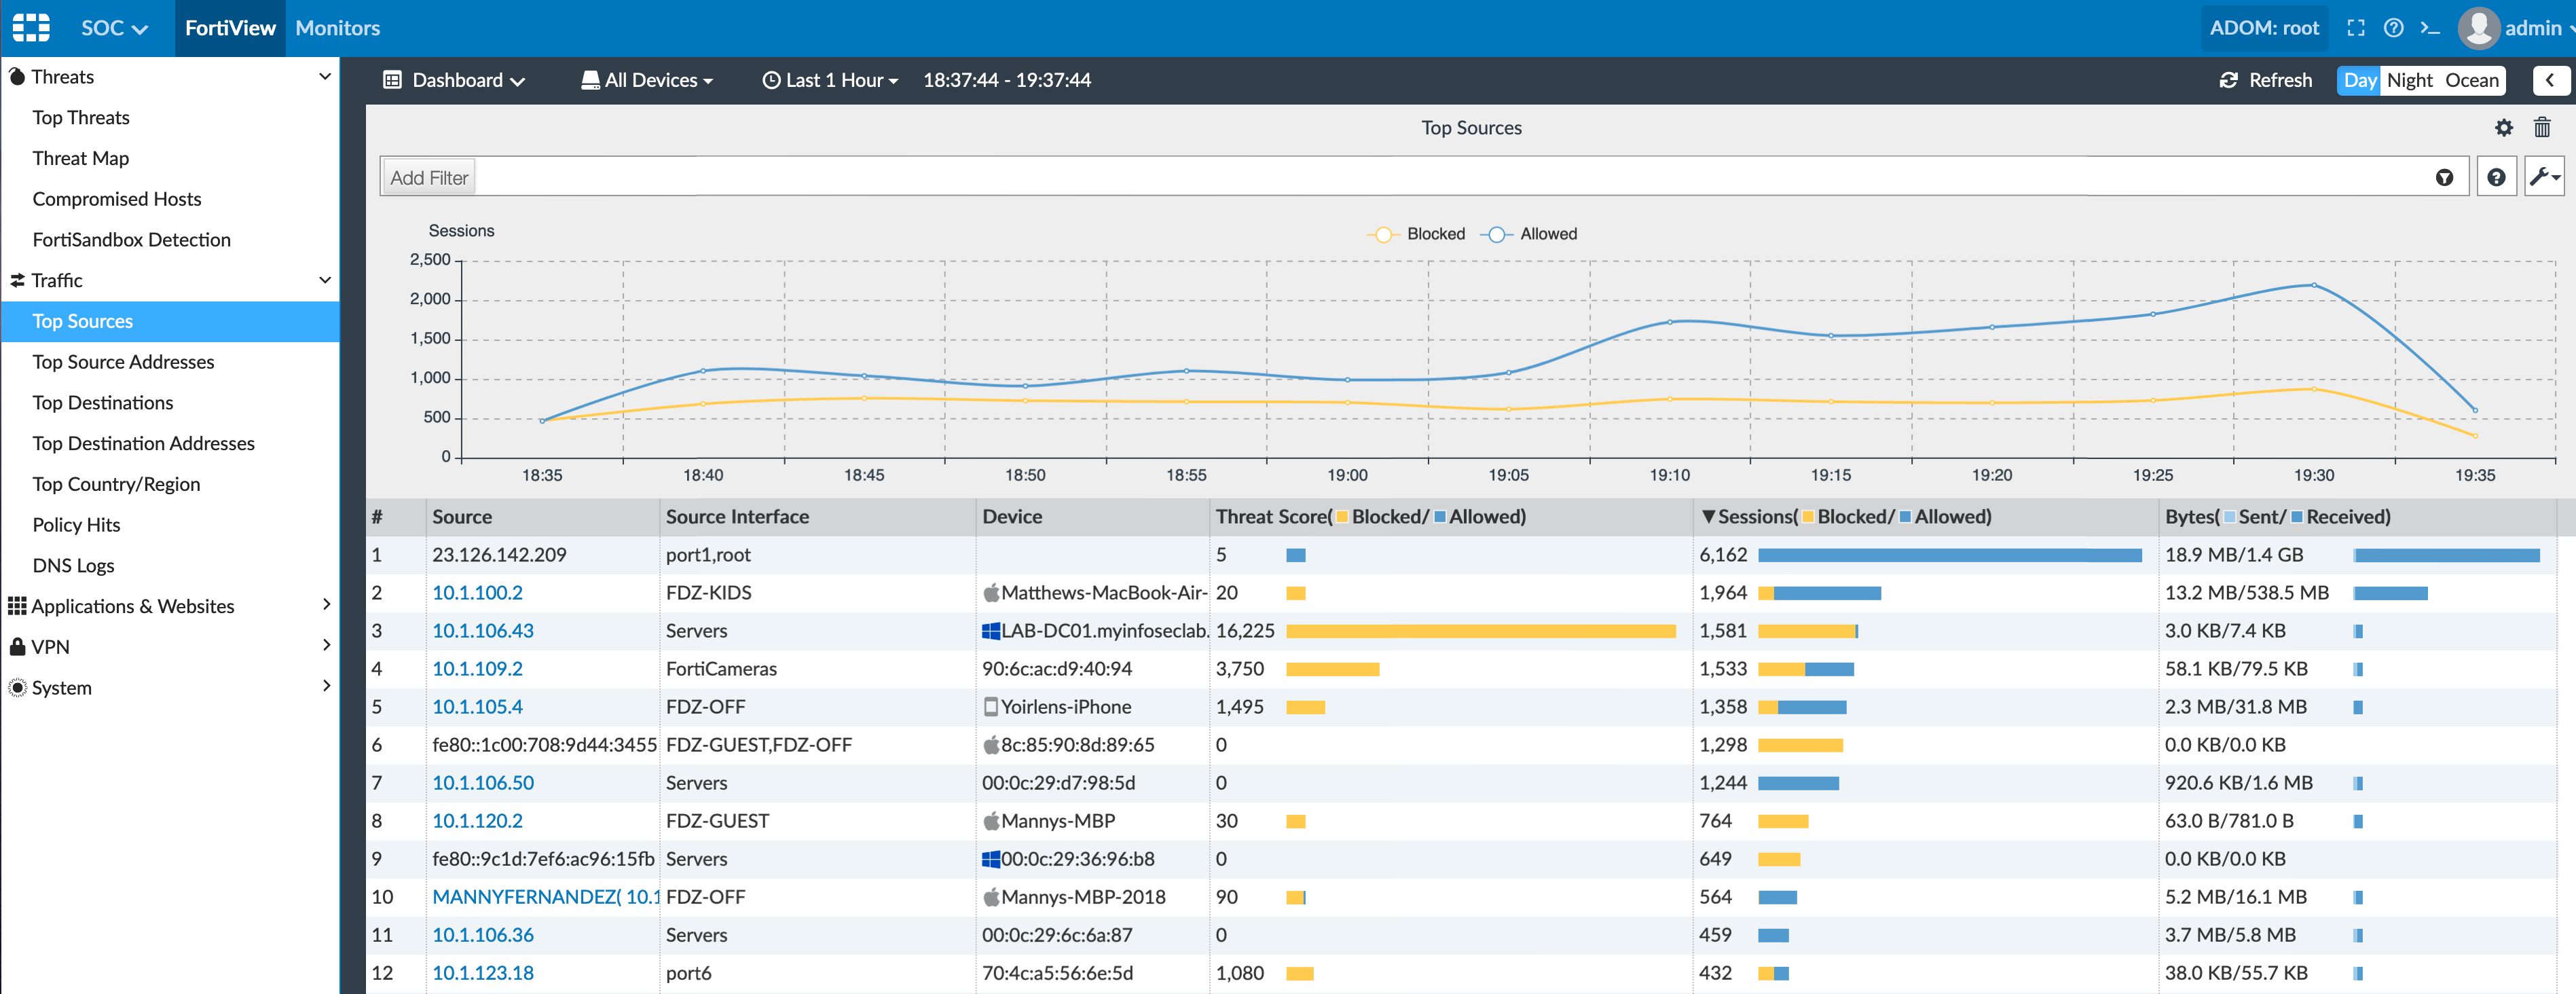
Under Traffic you can also see the traffic break-down. Additional columns can be displayed and you can double click to drill into each of the sessions.
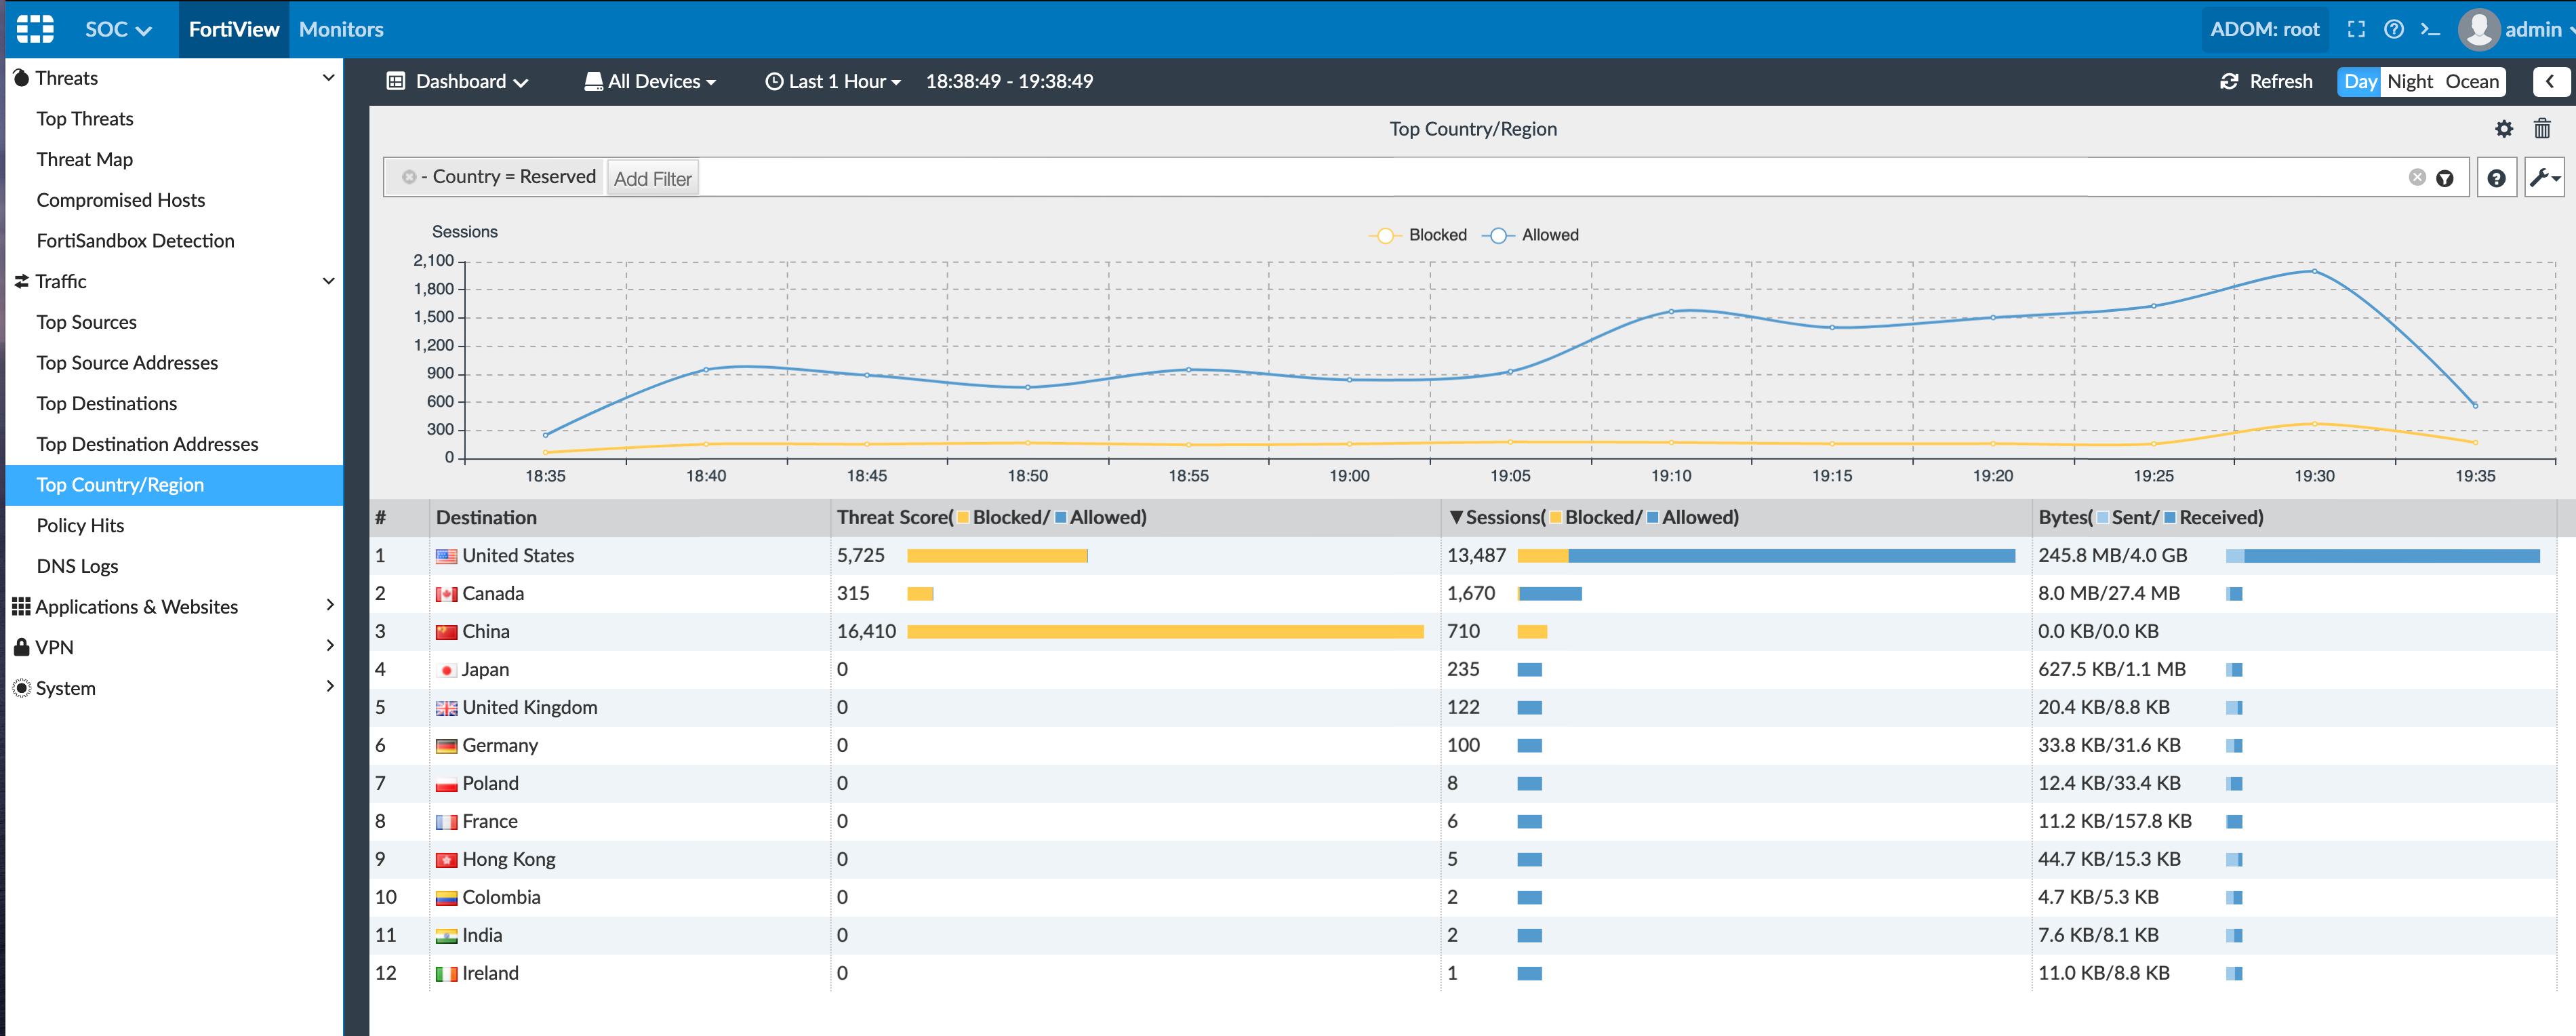
From the Top Country/Region you can see a list of countries and again the color bars follow uniformly with the others where yellow is blocked and blue is passed.
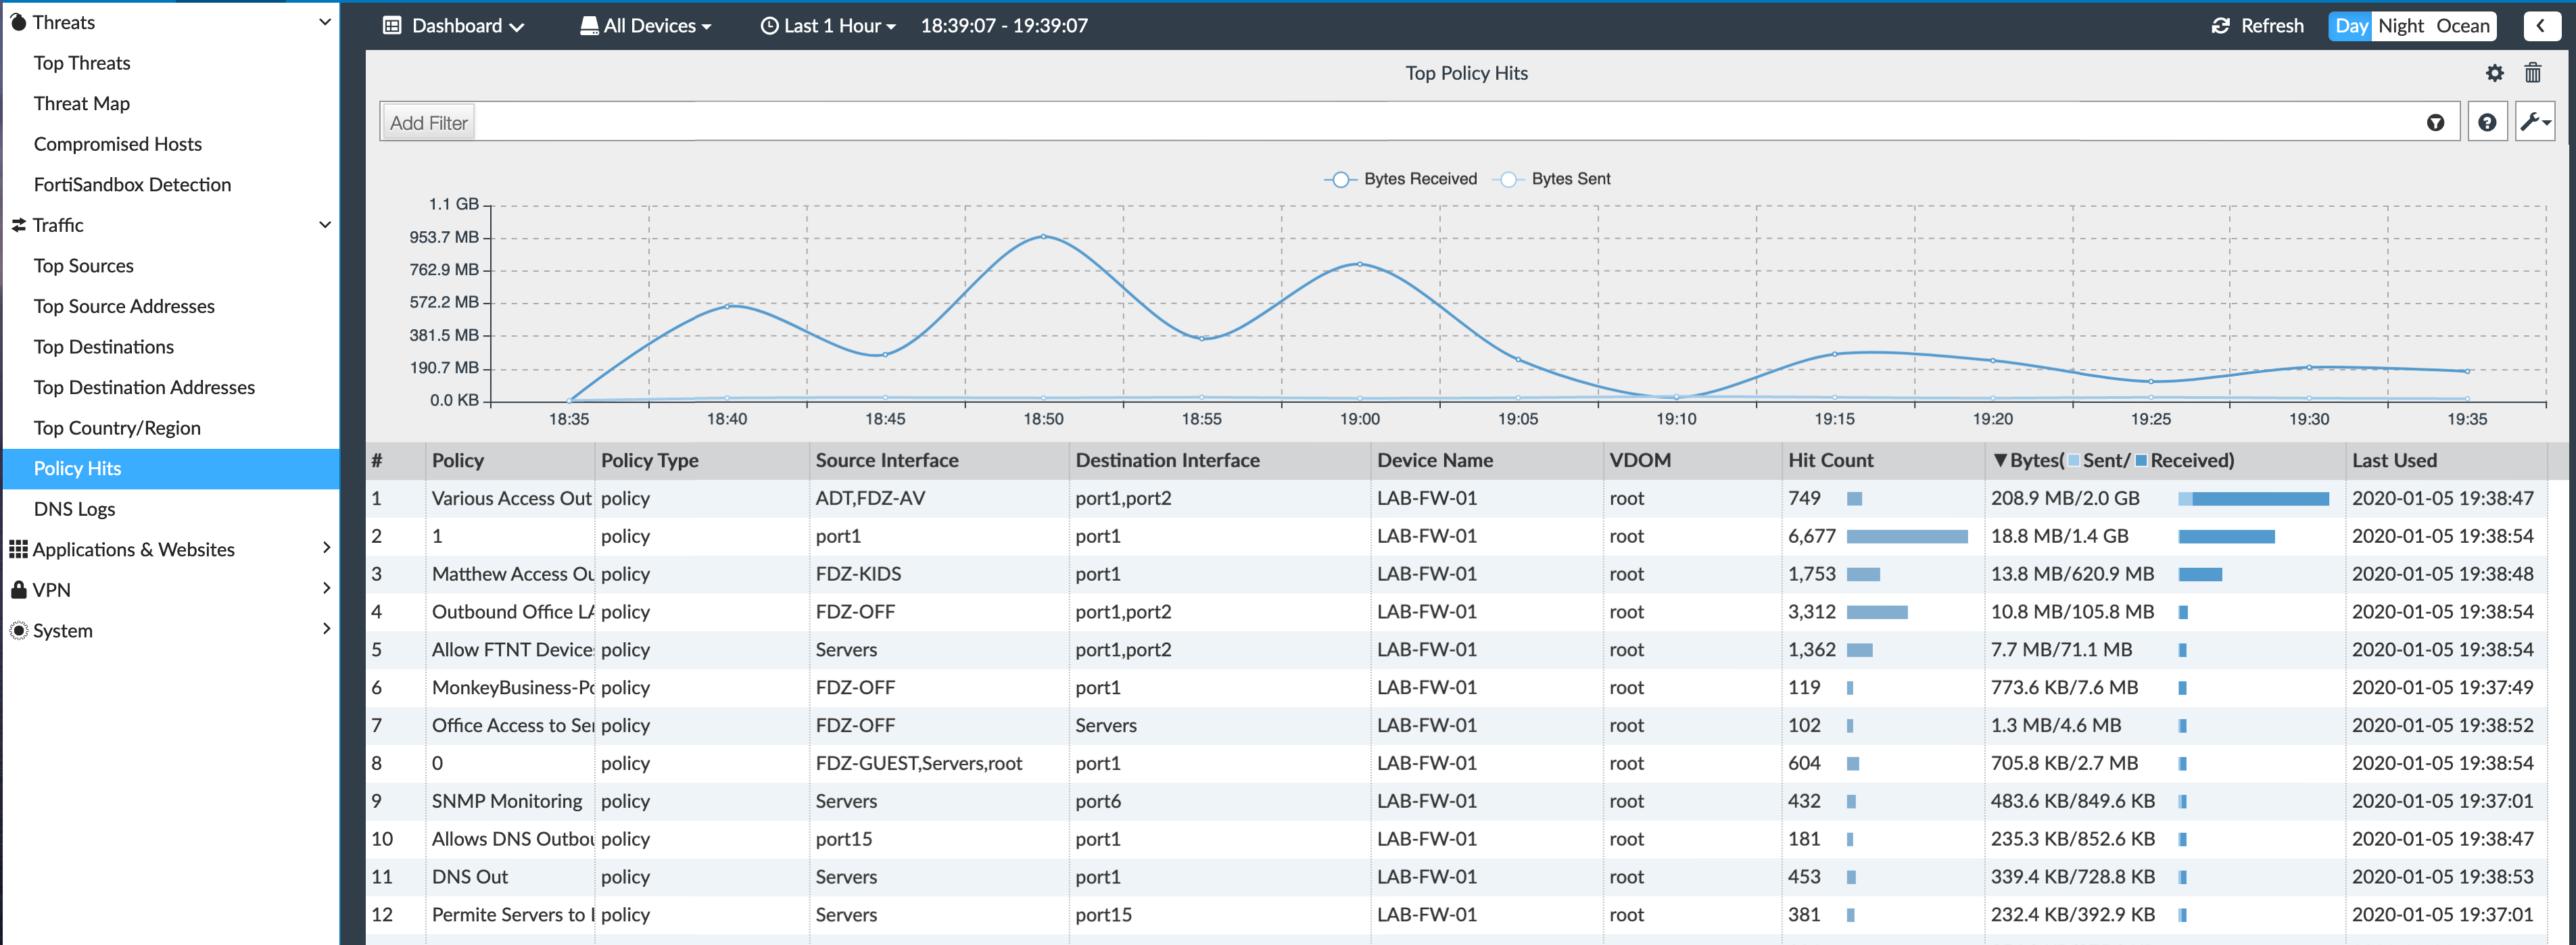
Next we have Policy Hits . Policy Hits give you a good idea of what policies are getting the most traffic. You could then move these policies up or down to affect performance.
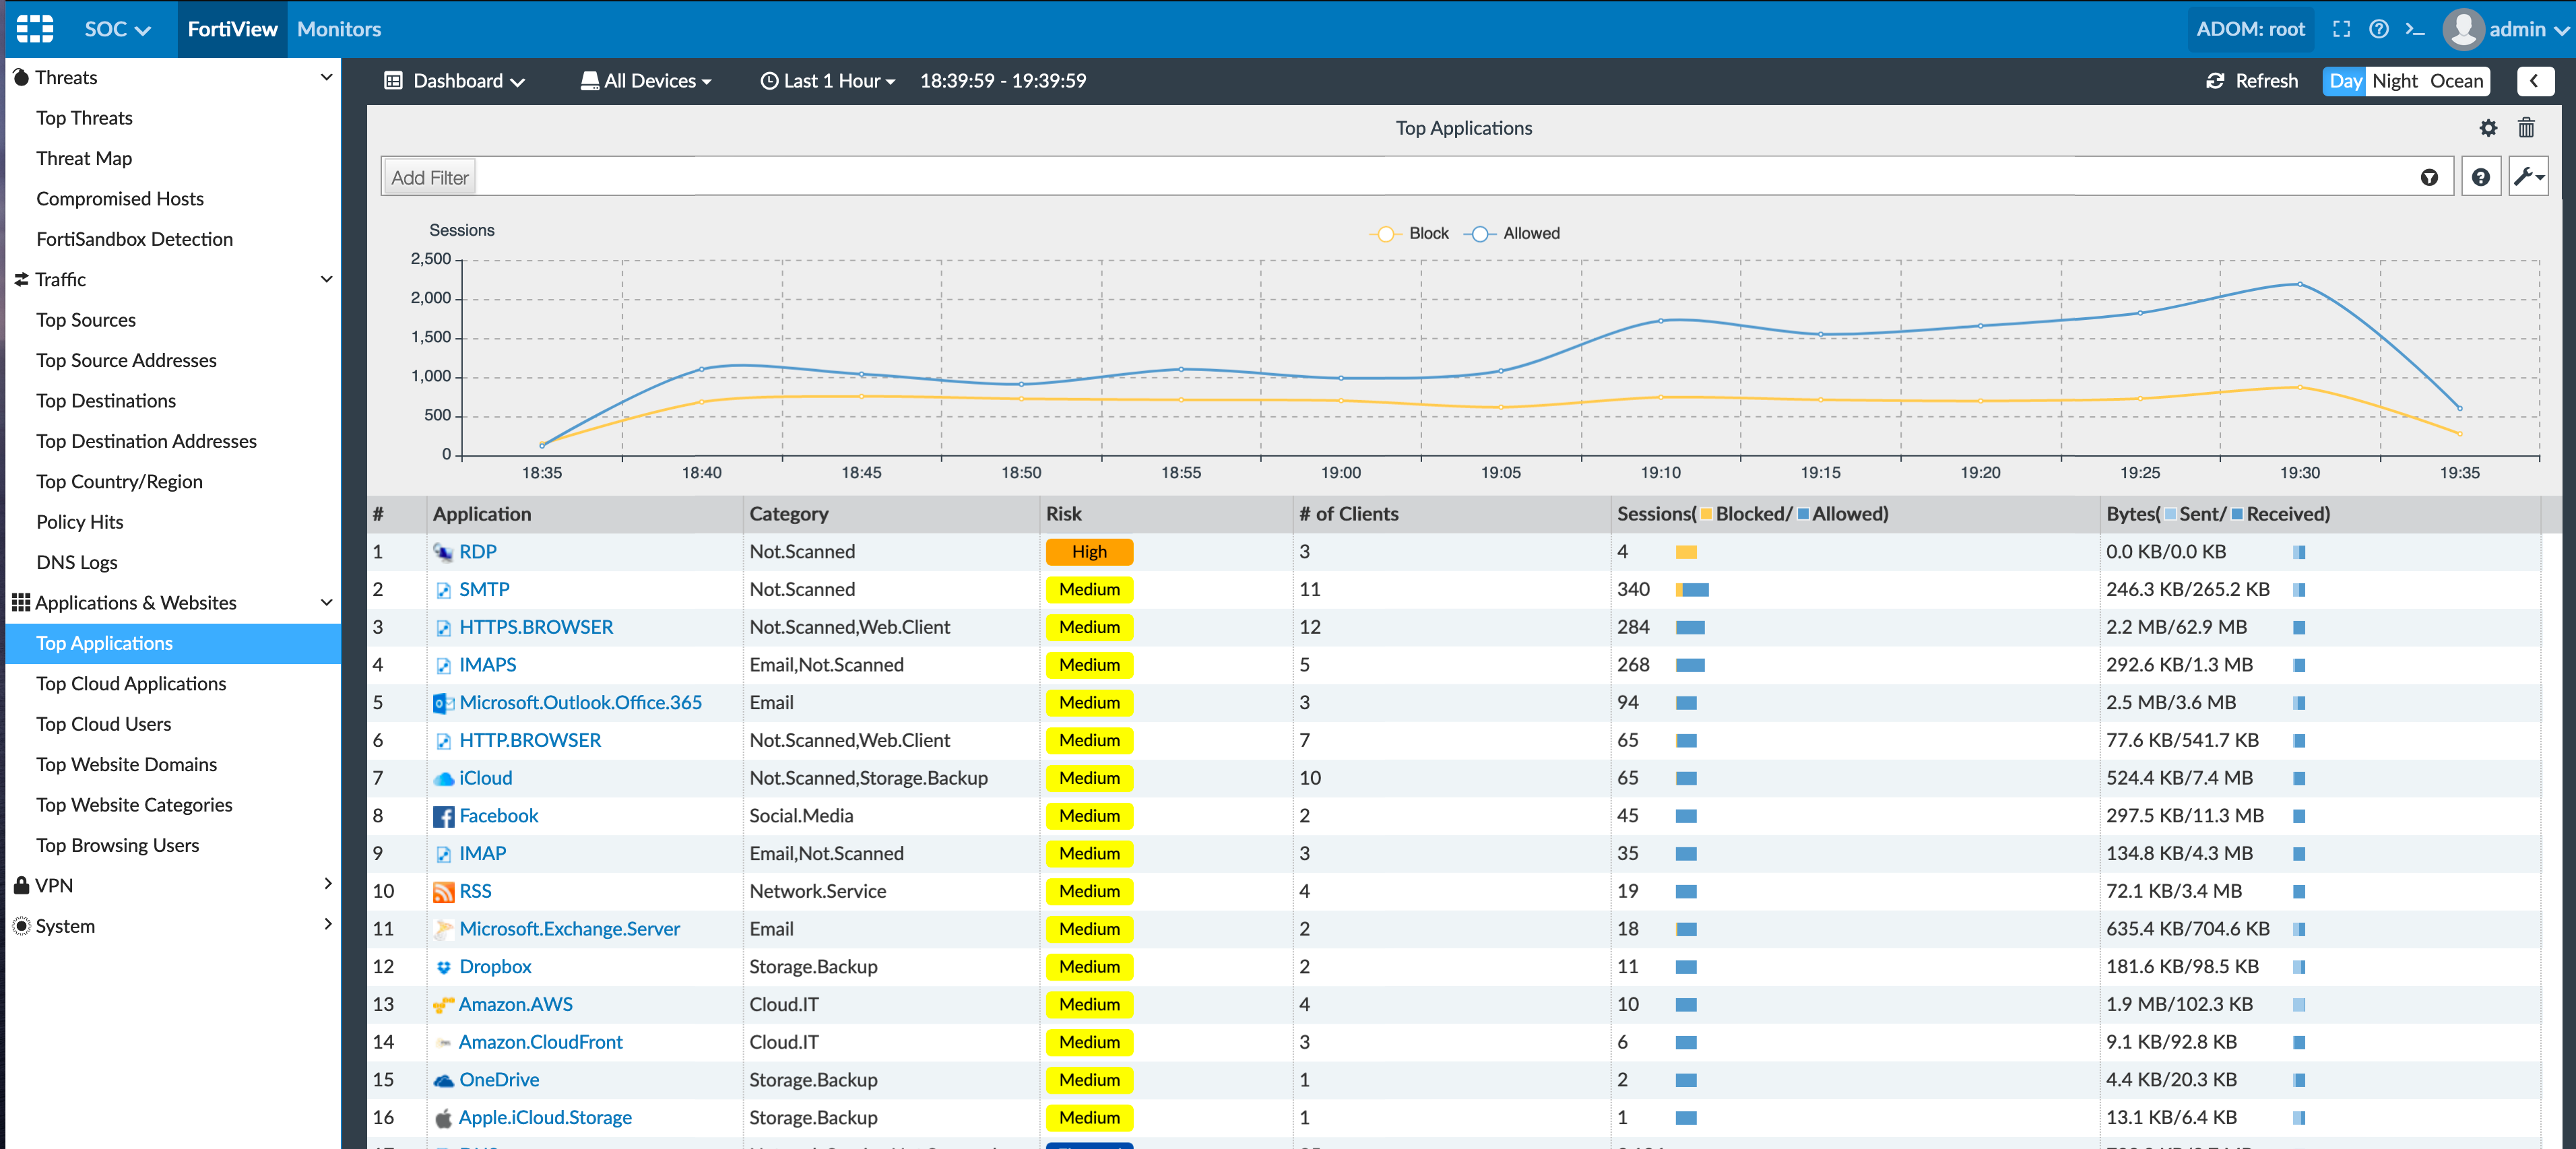
Now we can look at the Applications & Websites which give us the traffic breakdown based on applications. There is also a Risk section that you may want to use when reviewing your environment. Again, by double-clicking the RDP as an example….
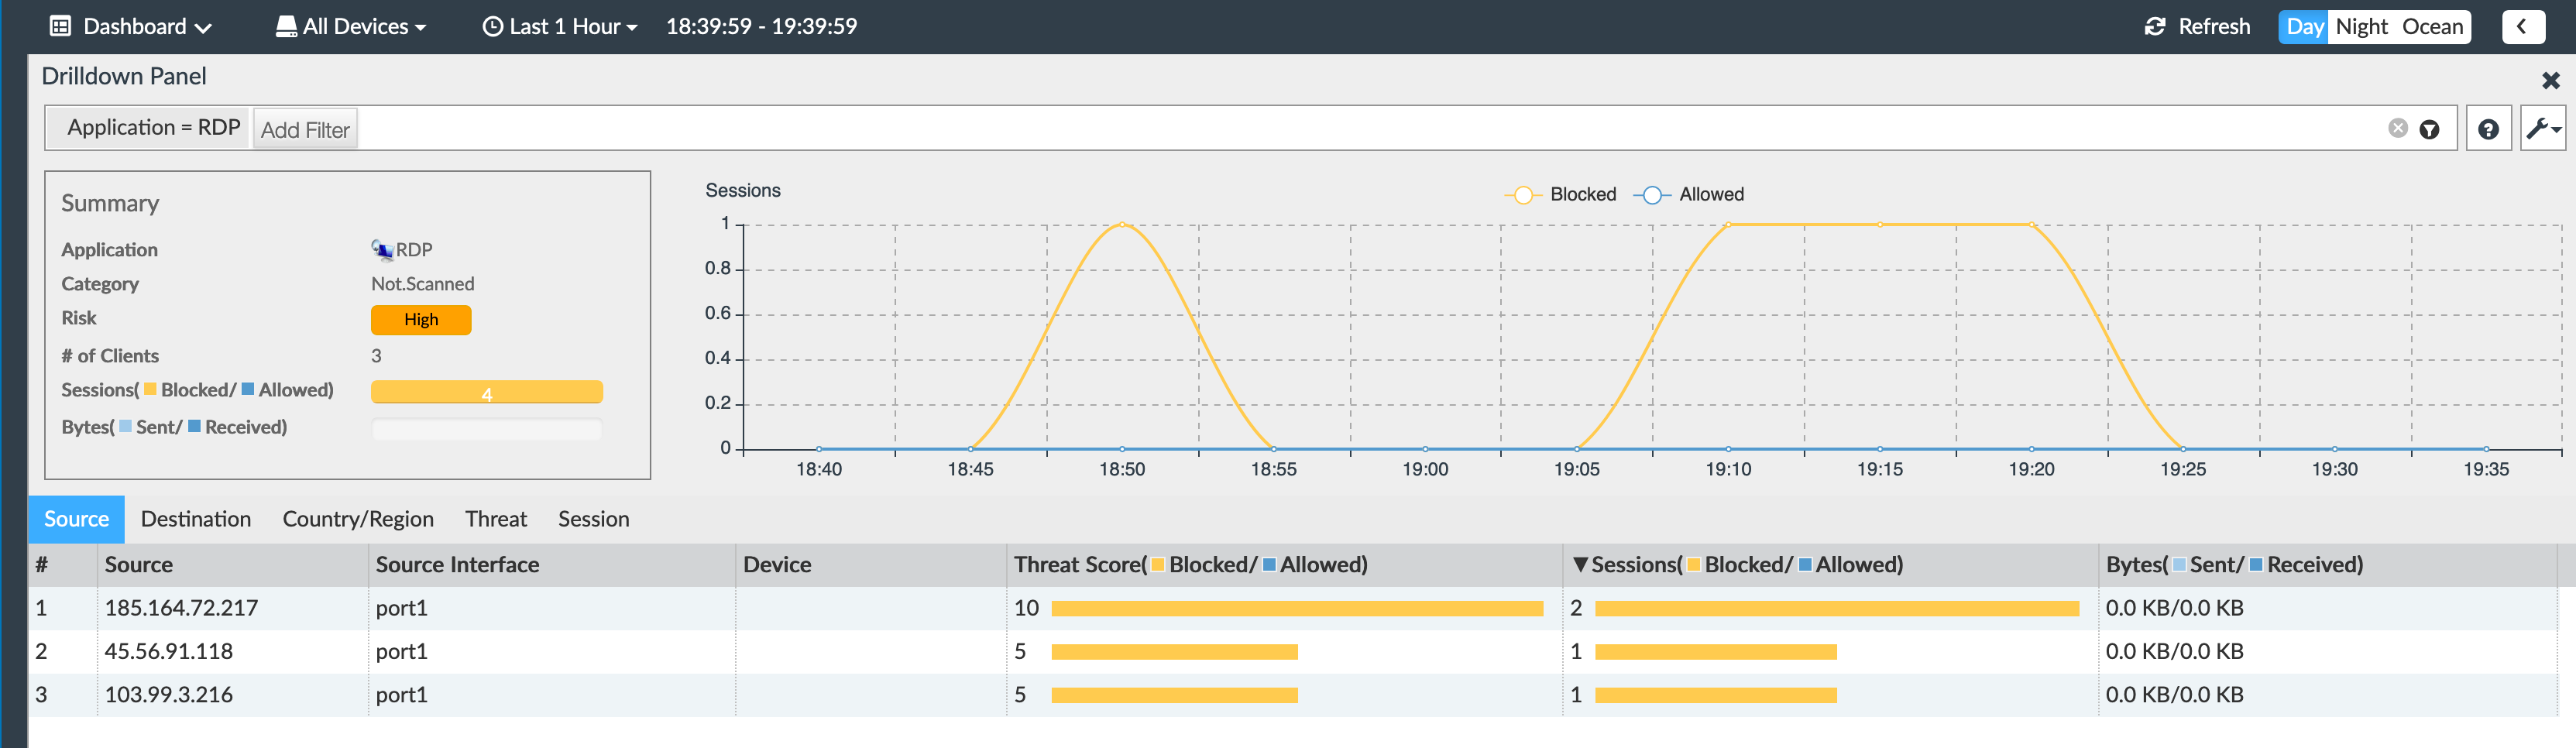
You can now see the 3 sessions. As you can see, all the attempts were blocked.
Monitor
Still under SOC but choosing Monitor on the top left, you get a different view which is good to show on larger displays in a NOC or SOC as an example.
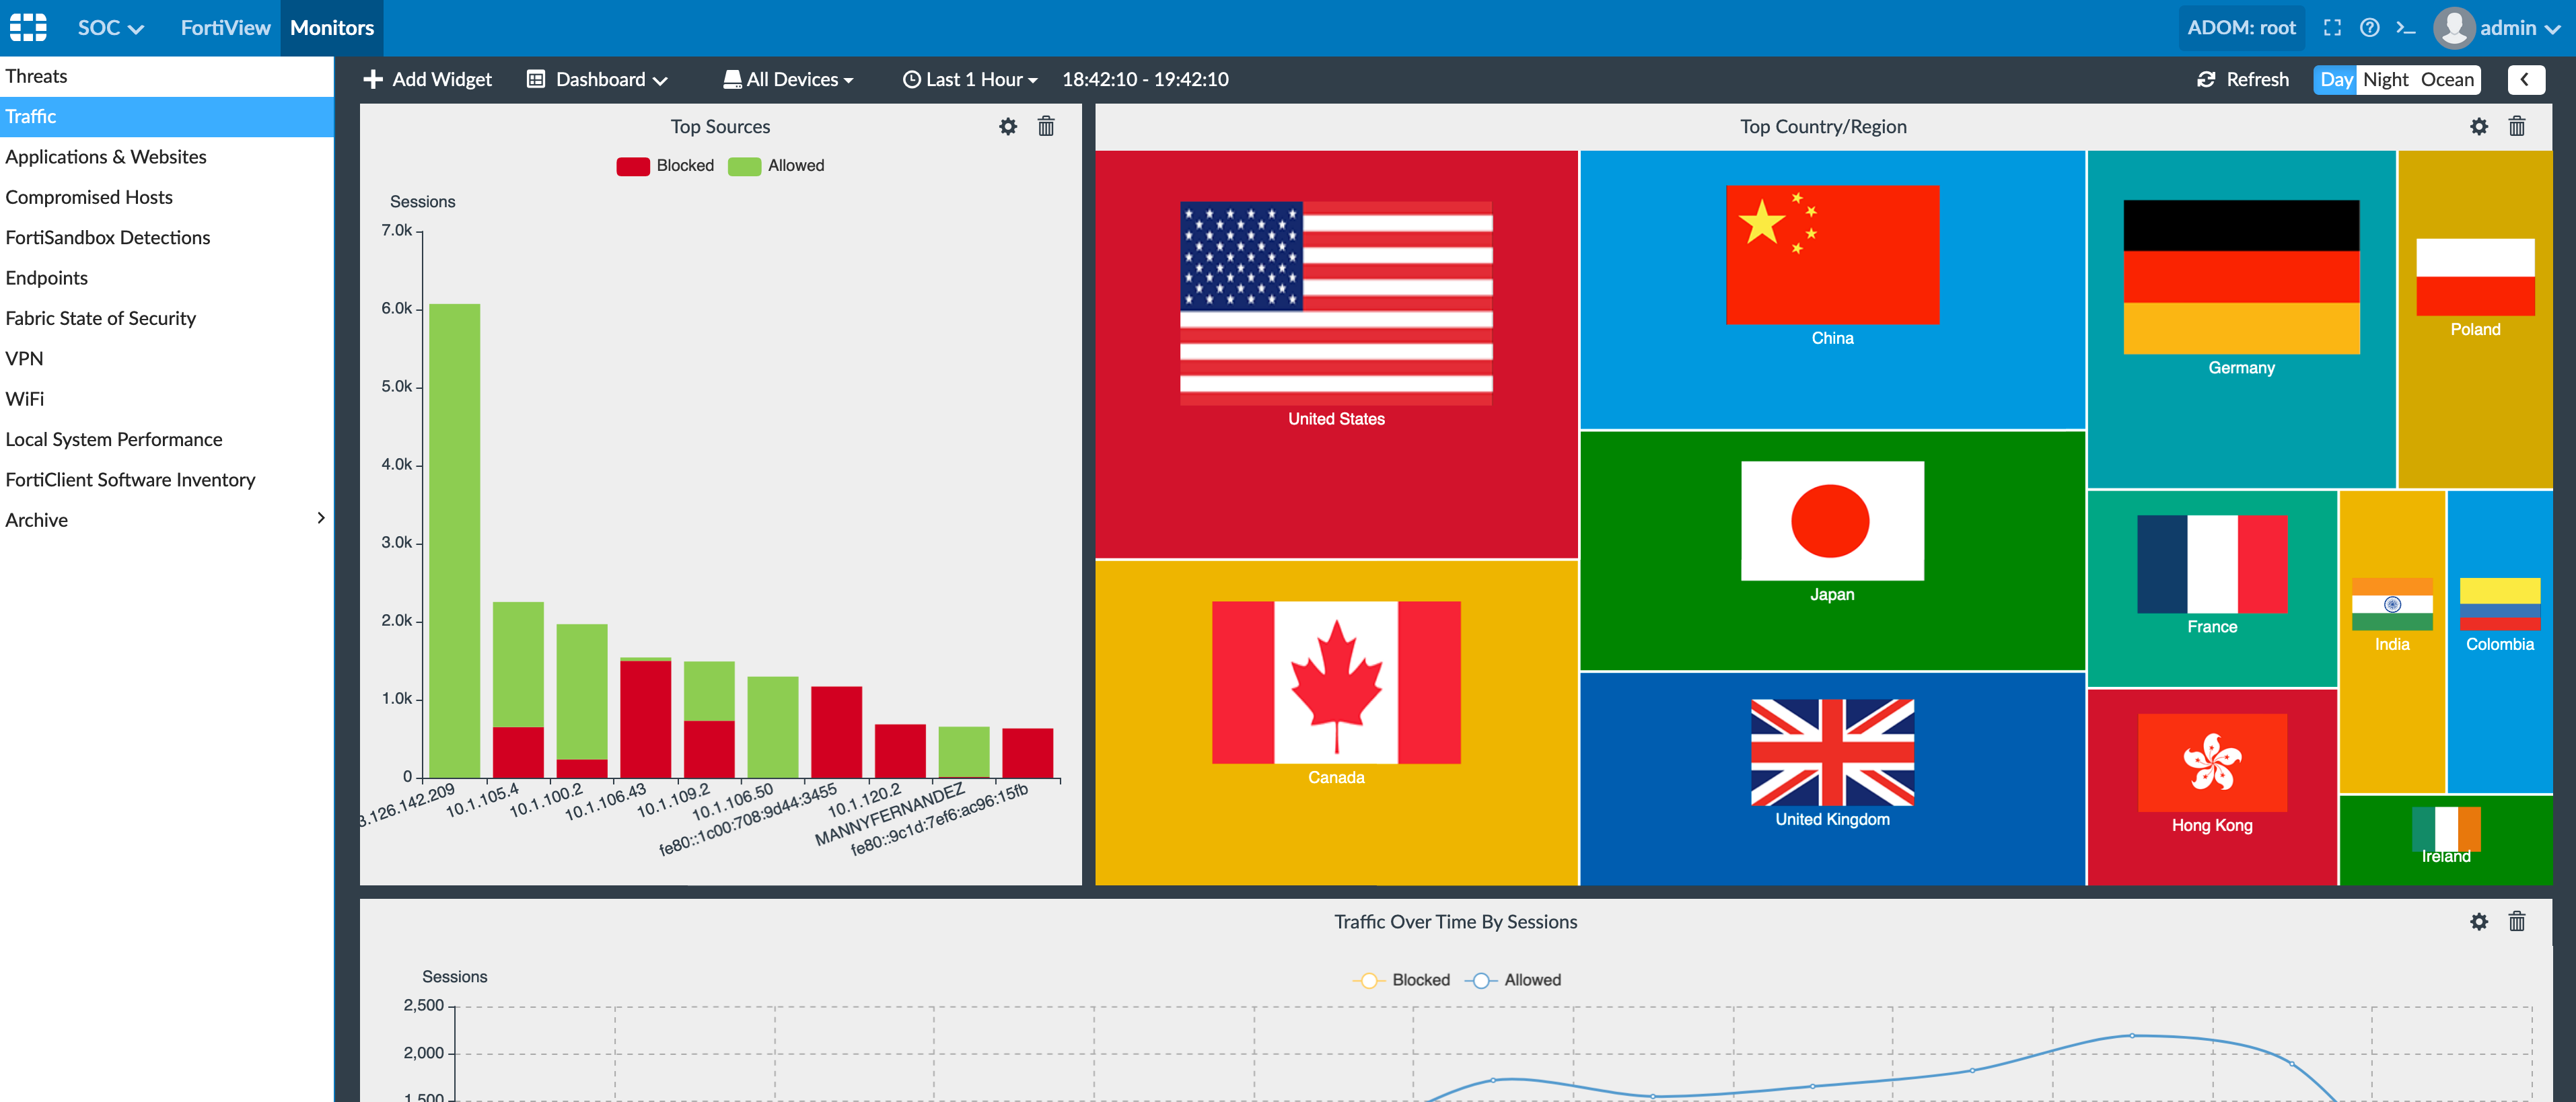
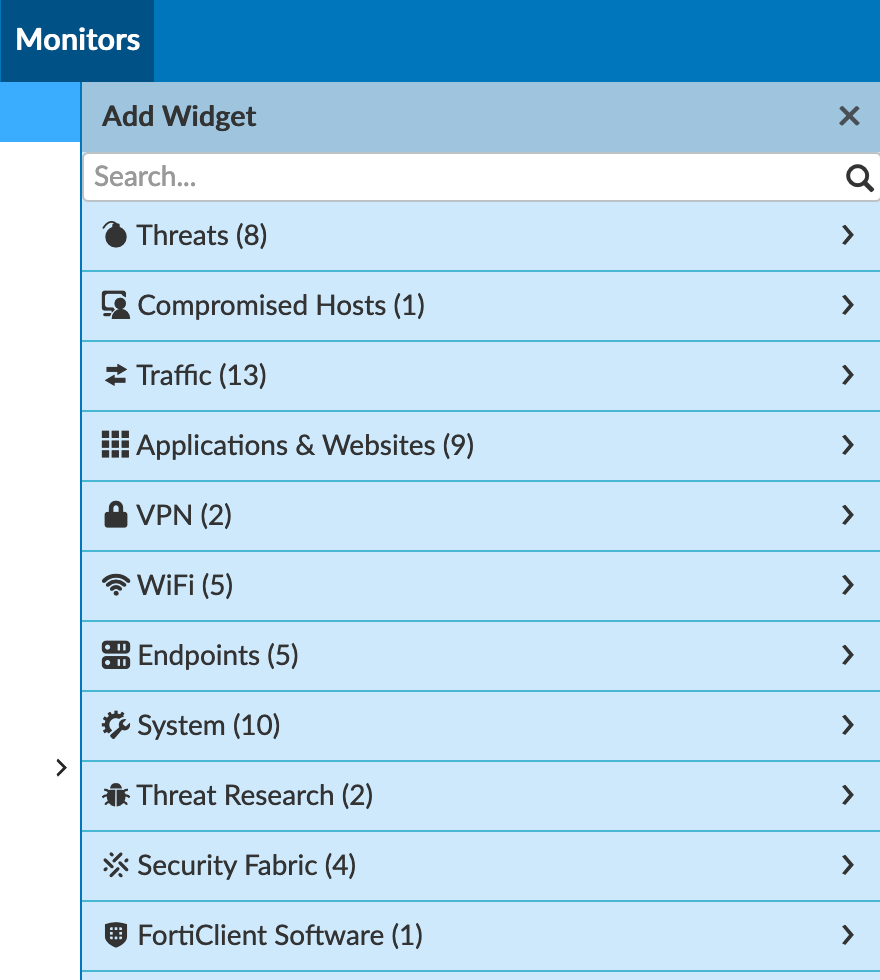
Here you can see the widgets (which can be modified)
You can display much of the same information as before under the FortiView section but in a NOC / SOC friendly view.
Log View
Under the Log View from the main screen, you have many more options
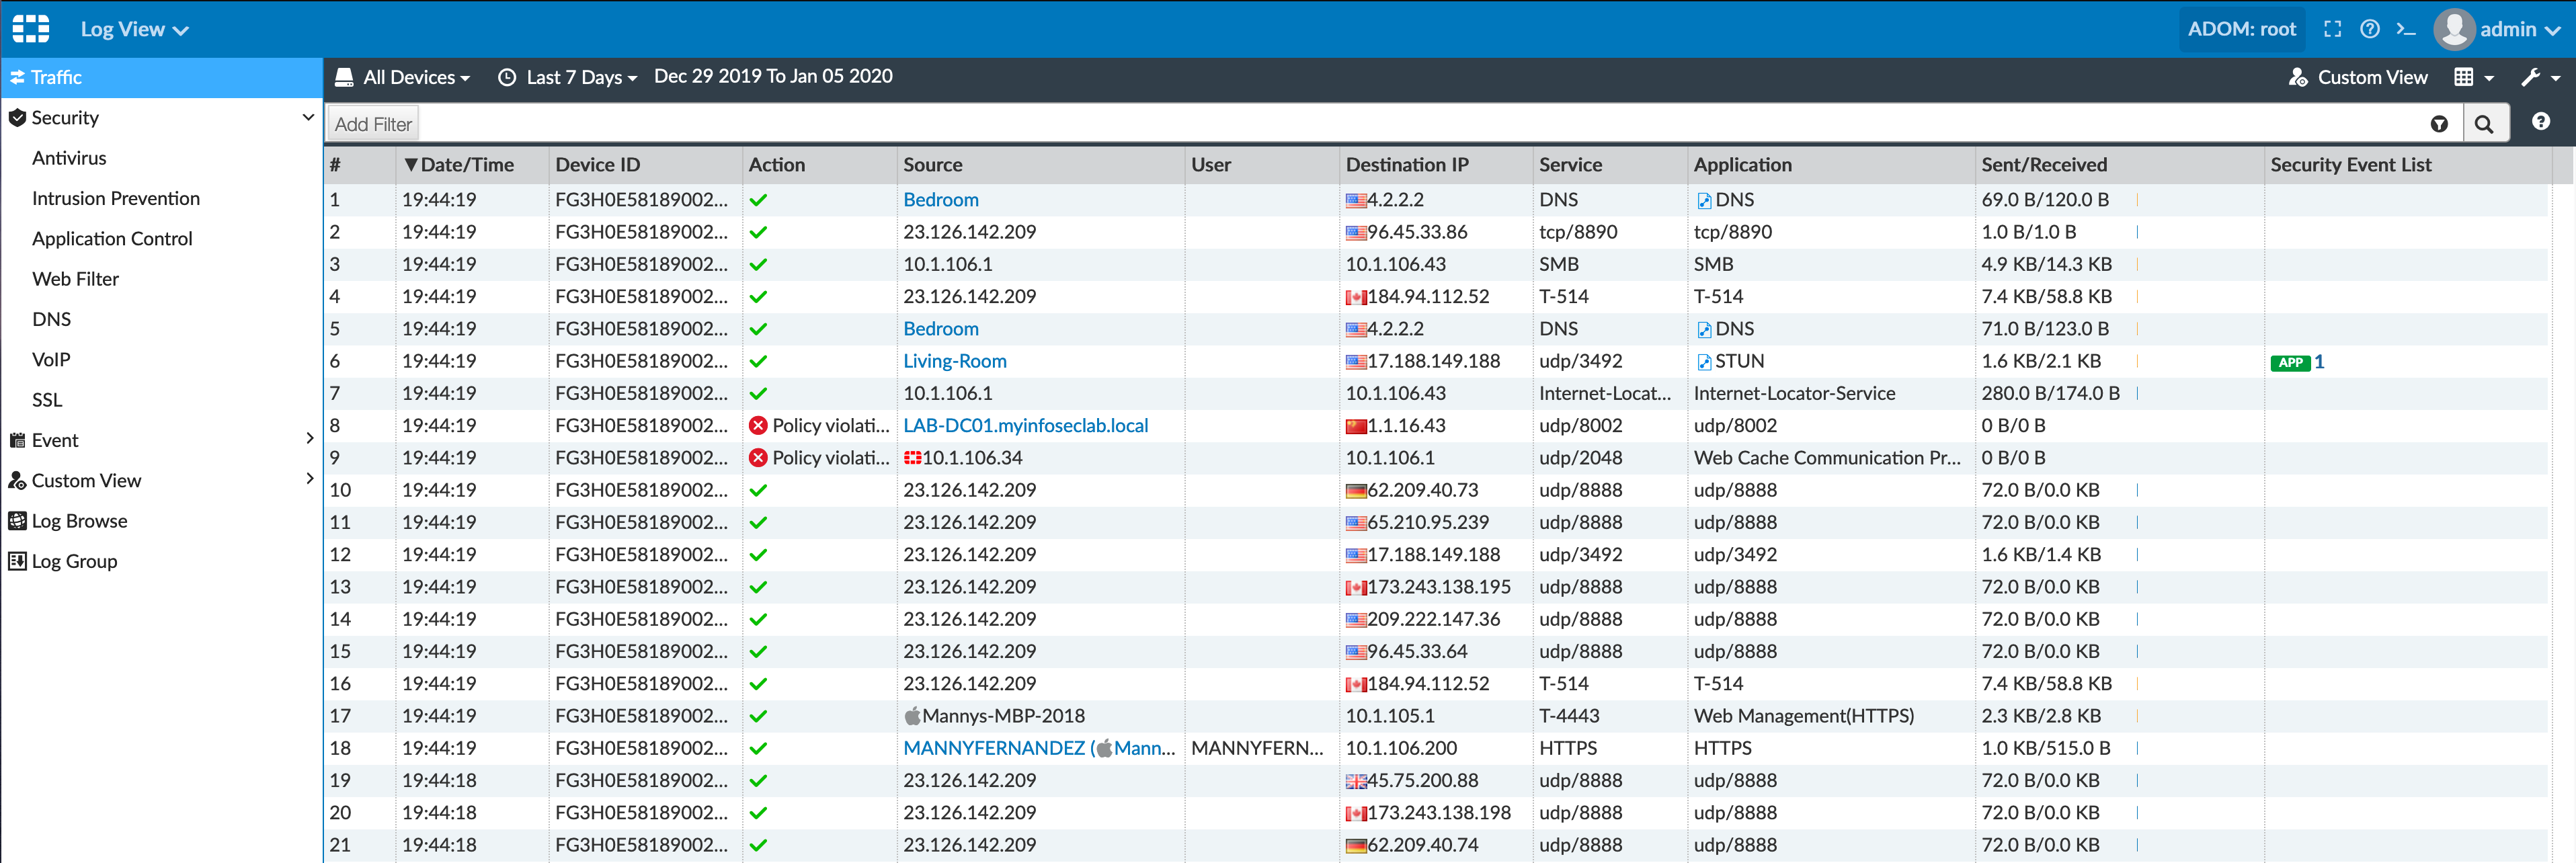
Under Traffic we can see all the traffic being logged by the Fortinet devices.
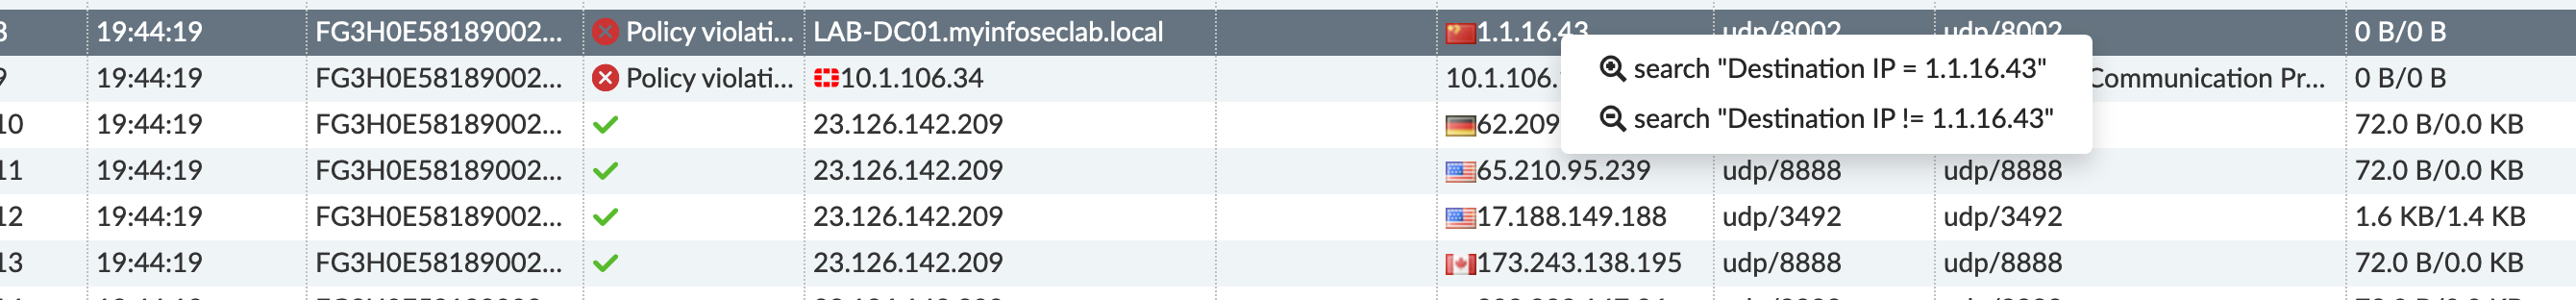
Lets say as an example, you wanted to filter out the logs with a destination of 1.1.16.43 (an old DC I had when I used 1. inside my lab) you can choose the !=1.1.16.43 which basically means “Not Equal to 1.1.16.43”.
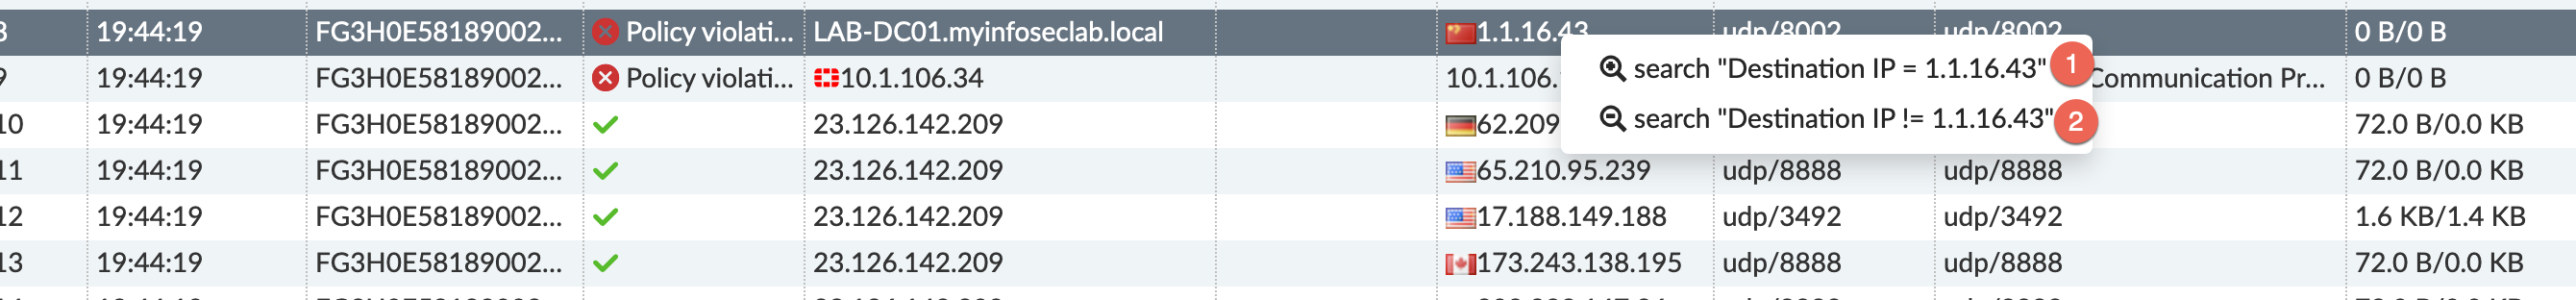
If you wanted to ONLY include destination traffic to 1.1.16.43, you would choose 1 if not, as stated before, you would choose option 2.
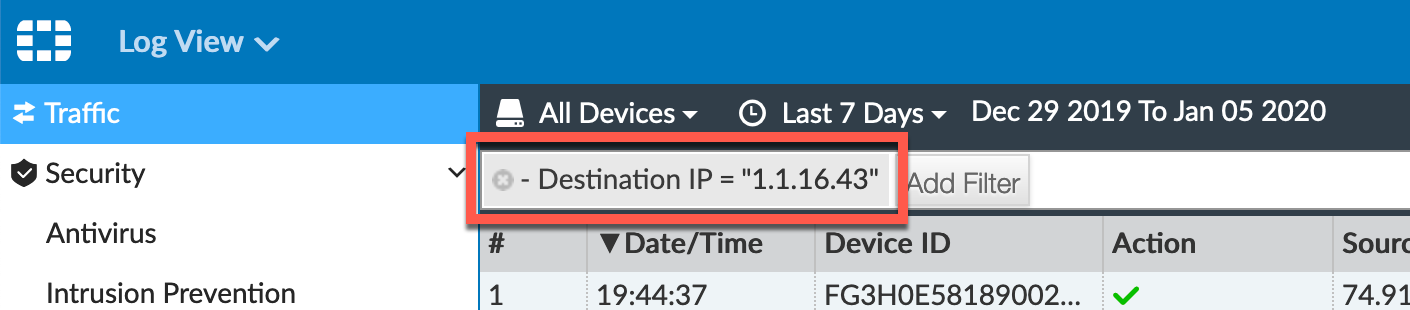
You can start to build complex filters directly from the filter section at the top of the page or by right-clicking on any columned items and choose the include or exclude.
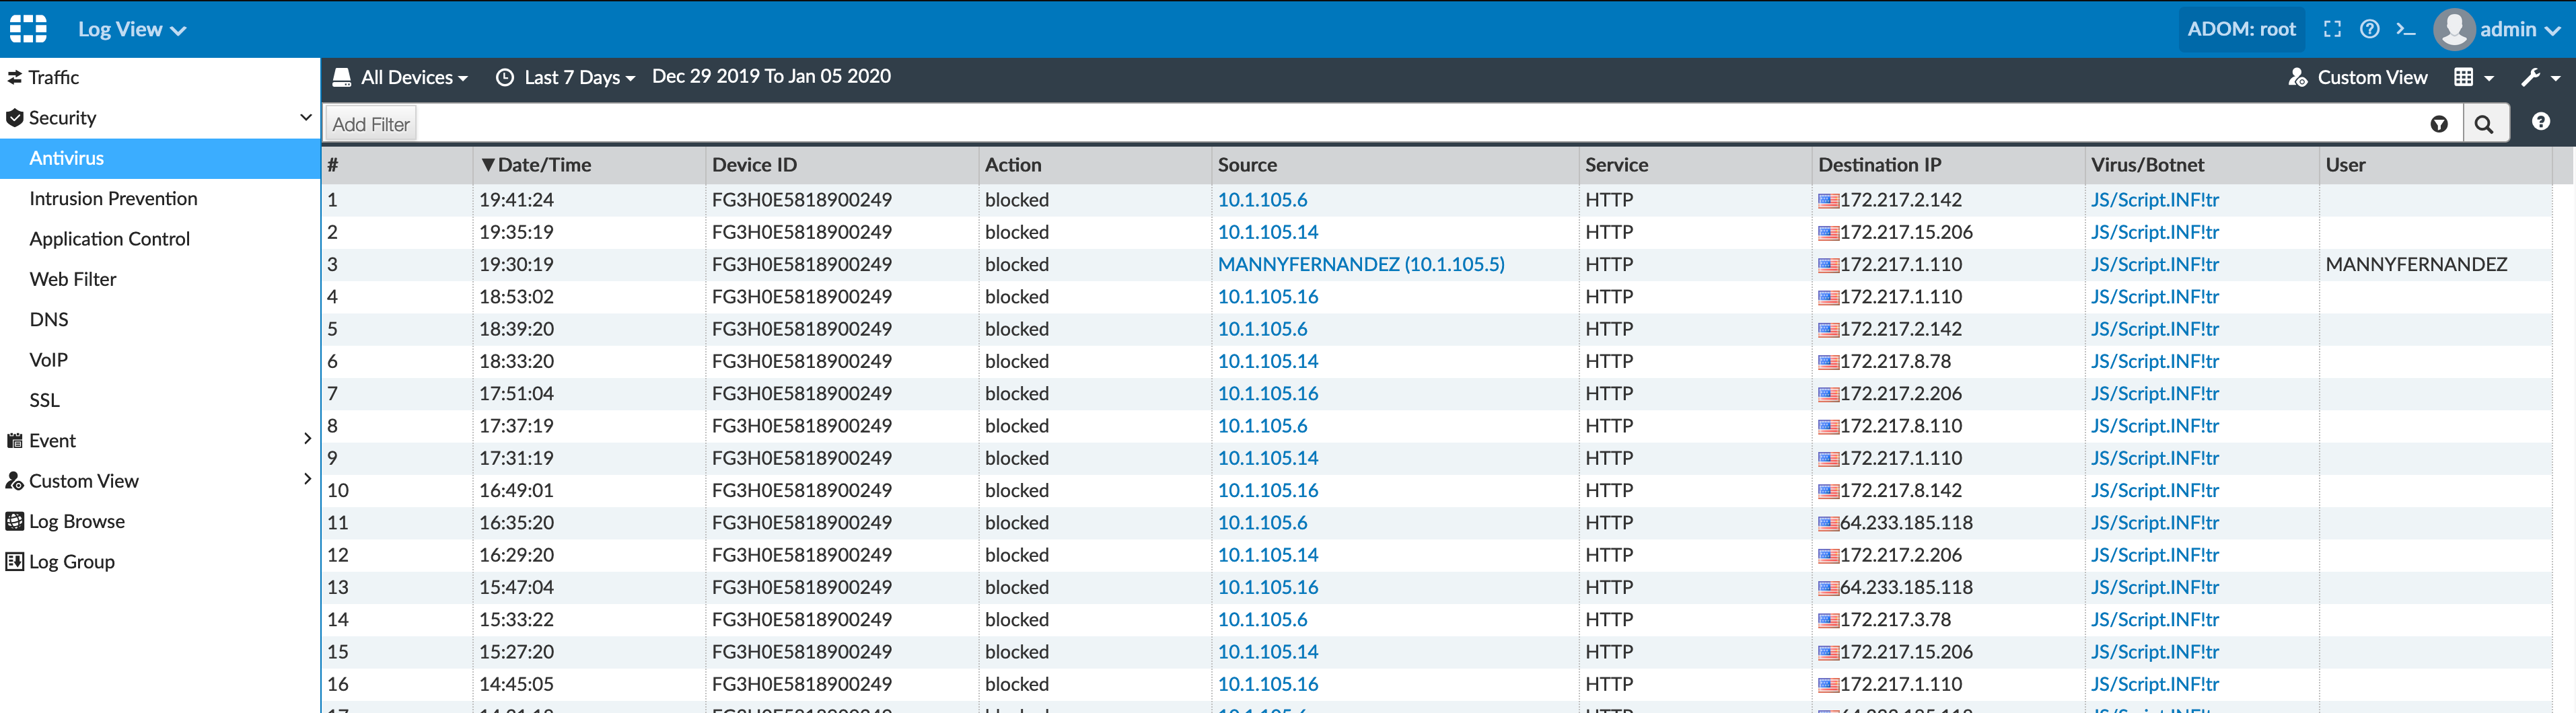
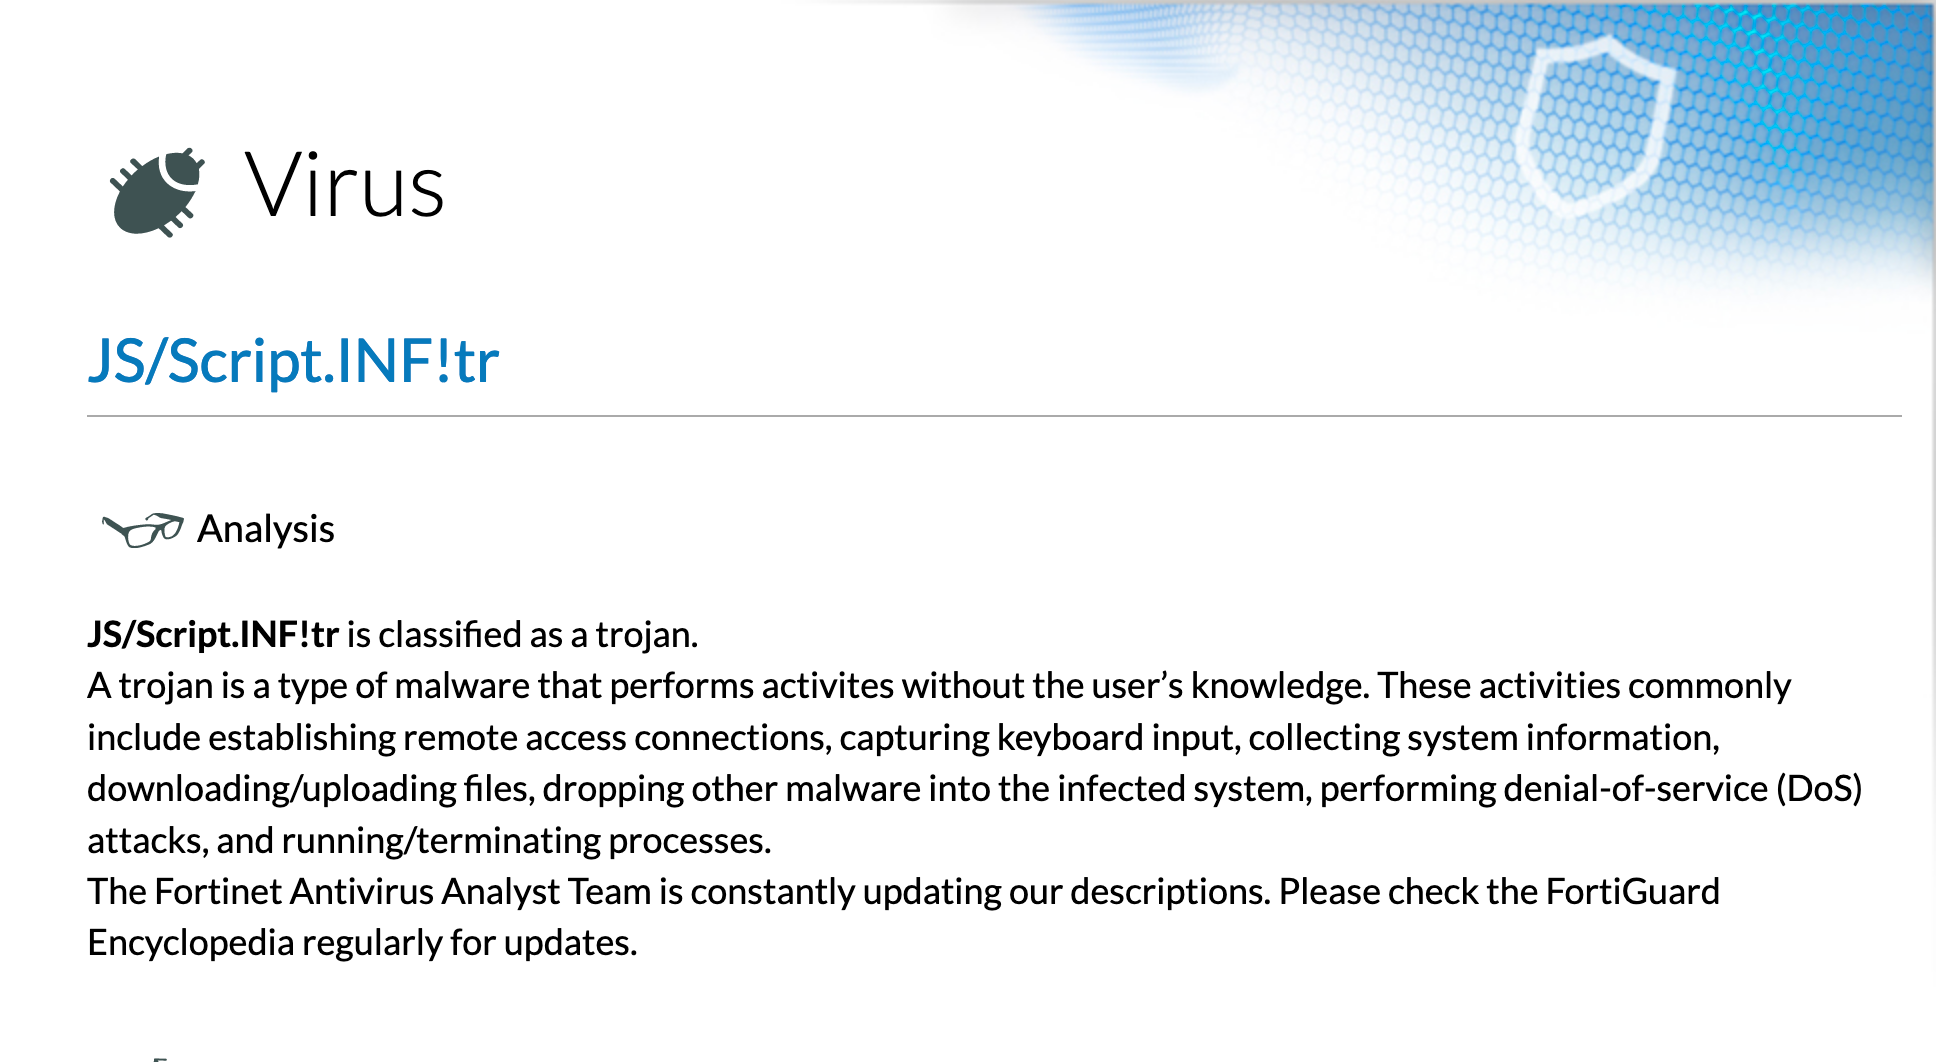
Under the Security sub-section you can see the Antivirus tab. As you can see, my Apple TVs are triggering JS/Script.INF!tr . By double-clicking any of these events, you will have more details of the connection. There is also a link to FortiGuard services that will give you information about the “virus” and usually how to fix it.
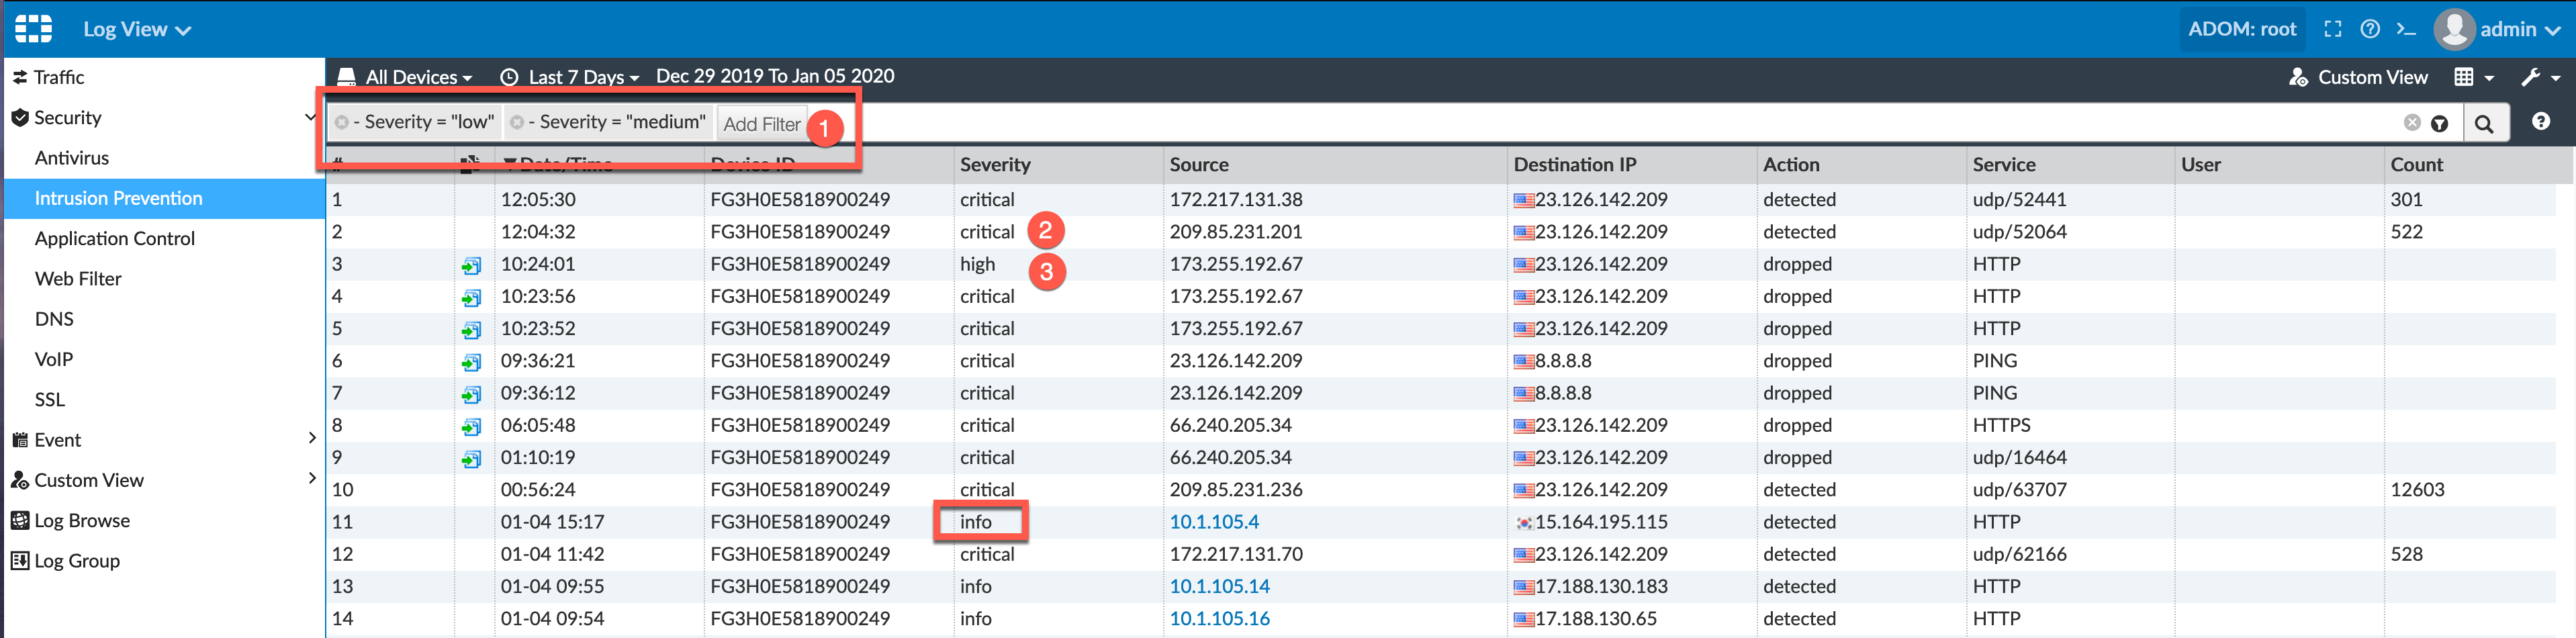
As you can see under Intrusion Prevention you can also filter our low severity entries to focus on High and Critical or anything that makes sense to you. You can filter based on any of the column content.
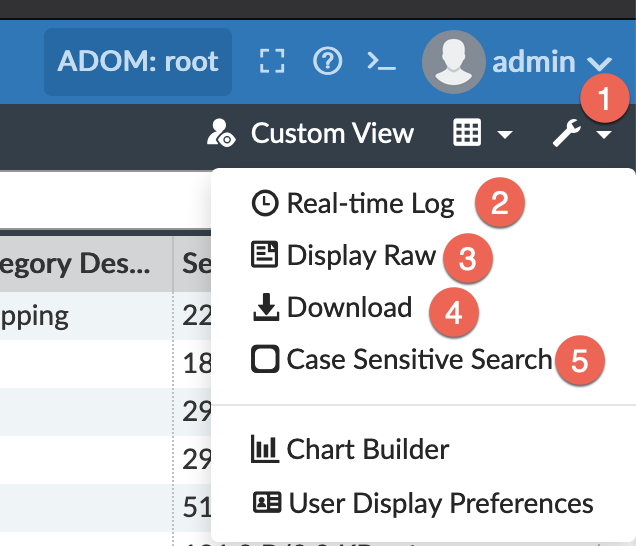
On the top right, you have the little wrench icon. By clicking it, you can:
- Wrench icon
- Show real-time logs as opposed to historical
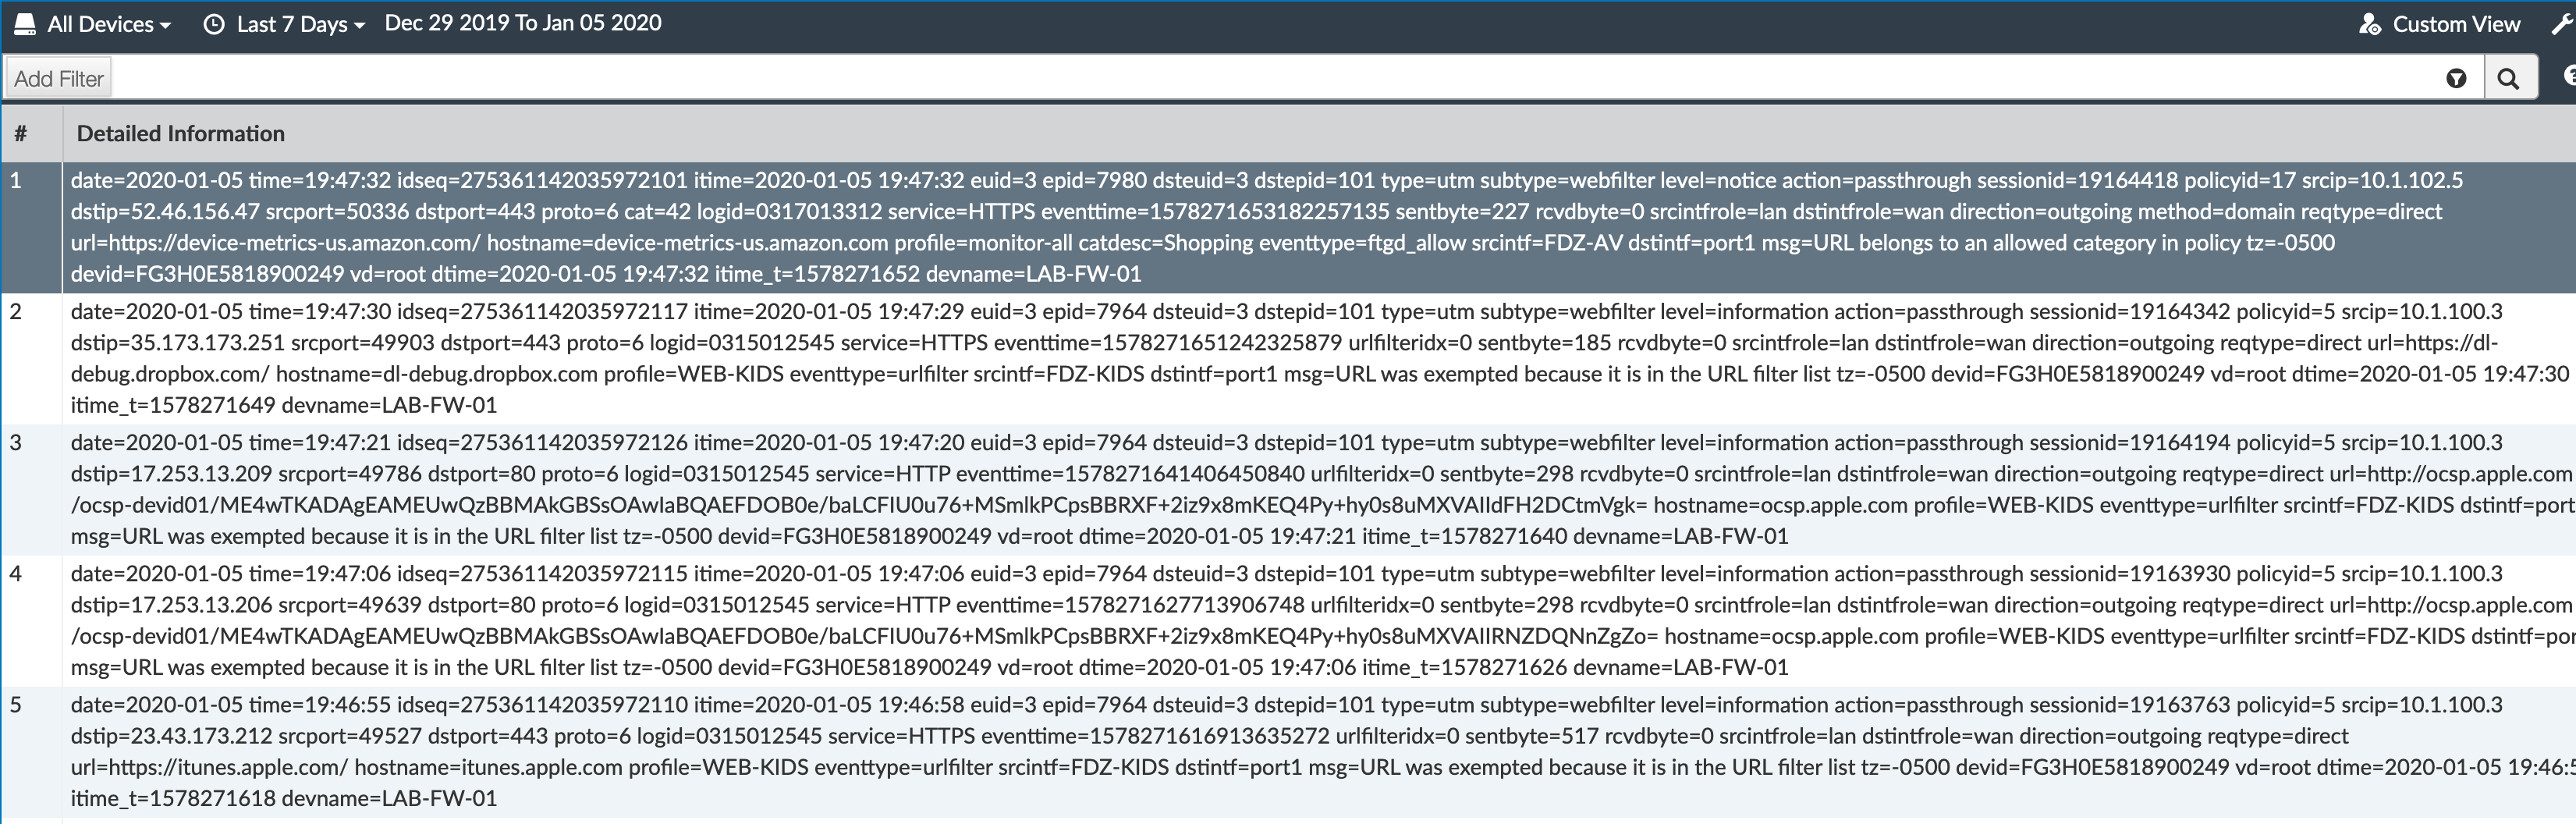
- Display the raw log (Shown below).
- Allows you to download the logs
- Allows you to do more advanced search criteria with case sensitive criteria.
Reporting
FAZ includes canned reports that are very useful but can easily use SQL queries
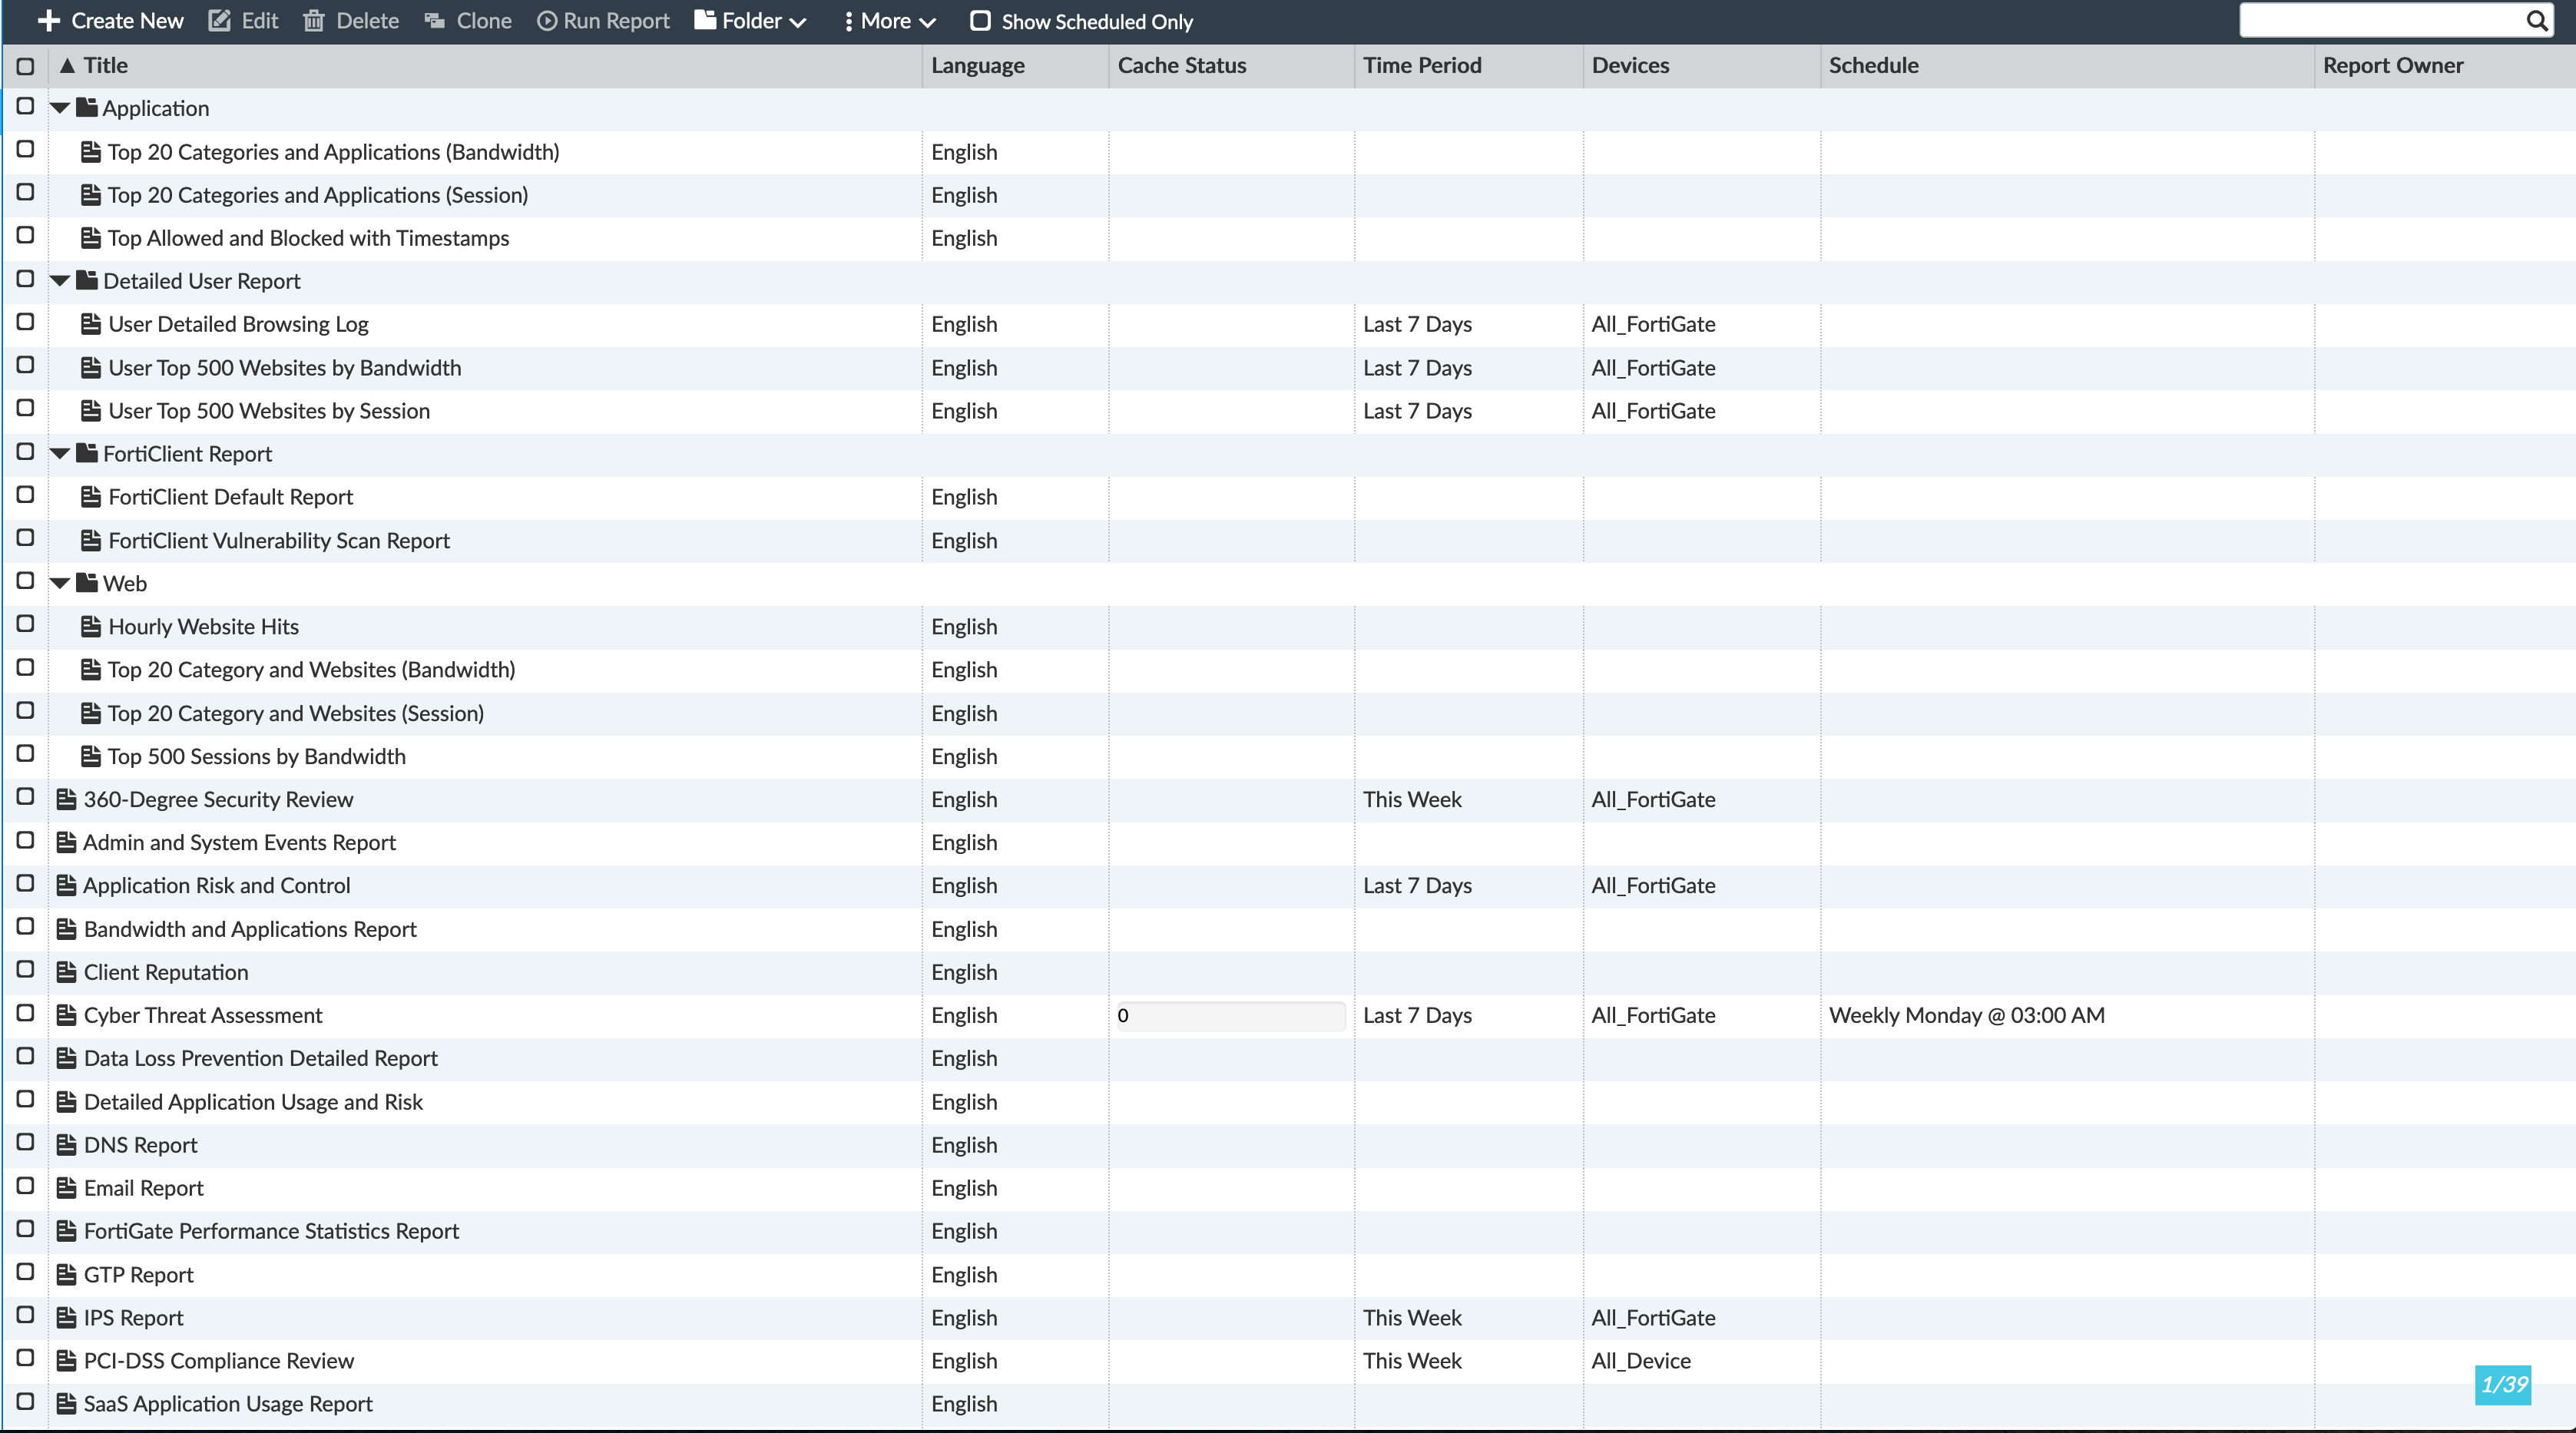
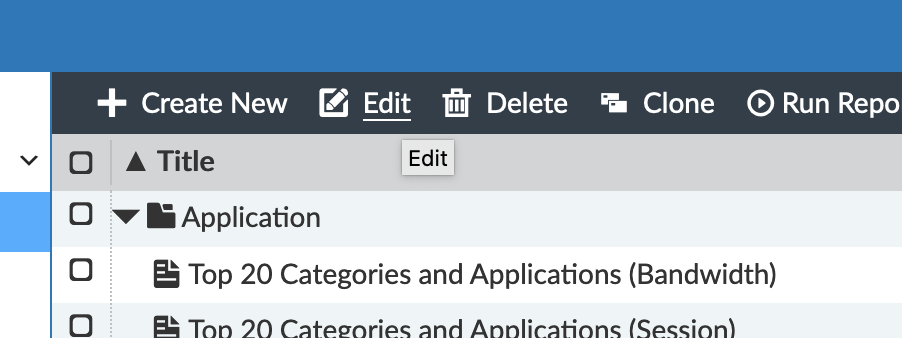
You can choose a report and hit the Edit on the top bar.
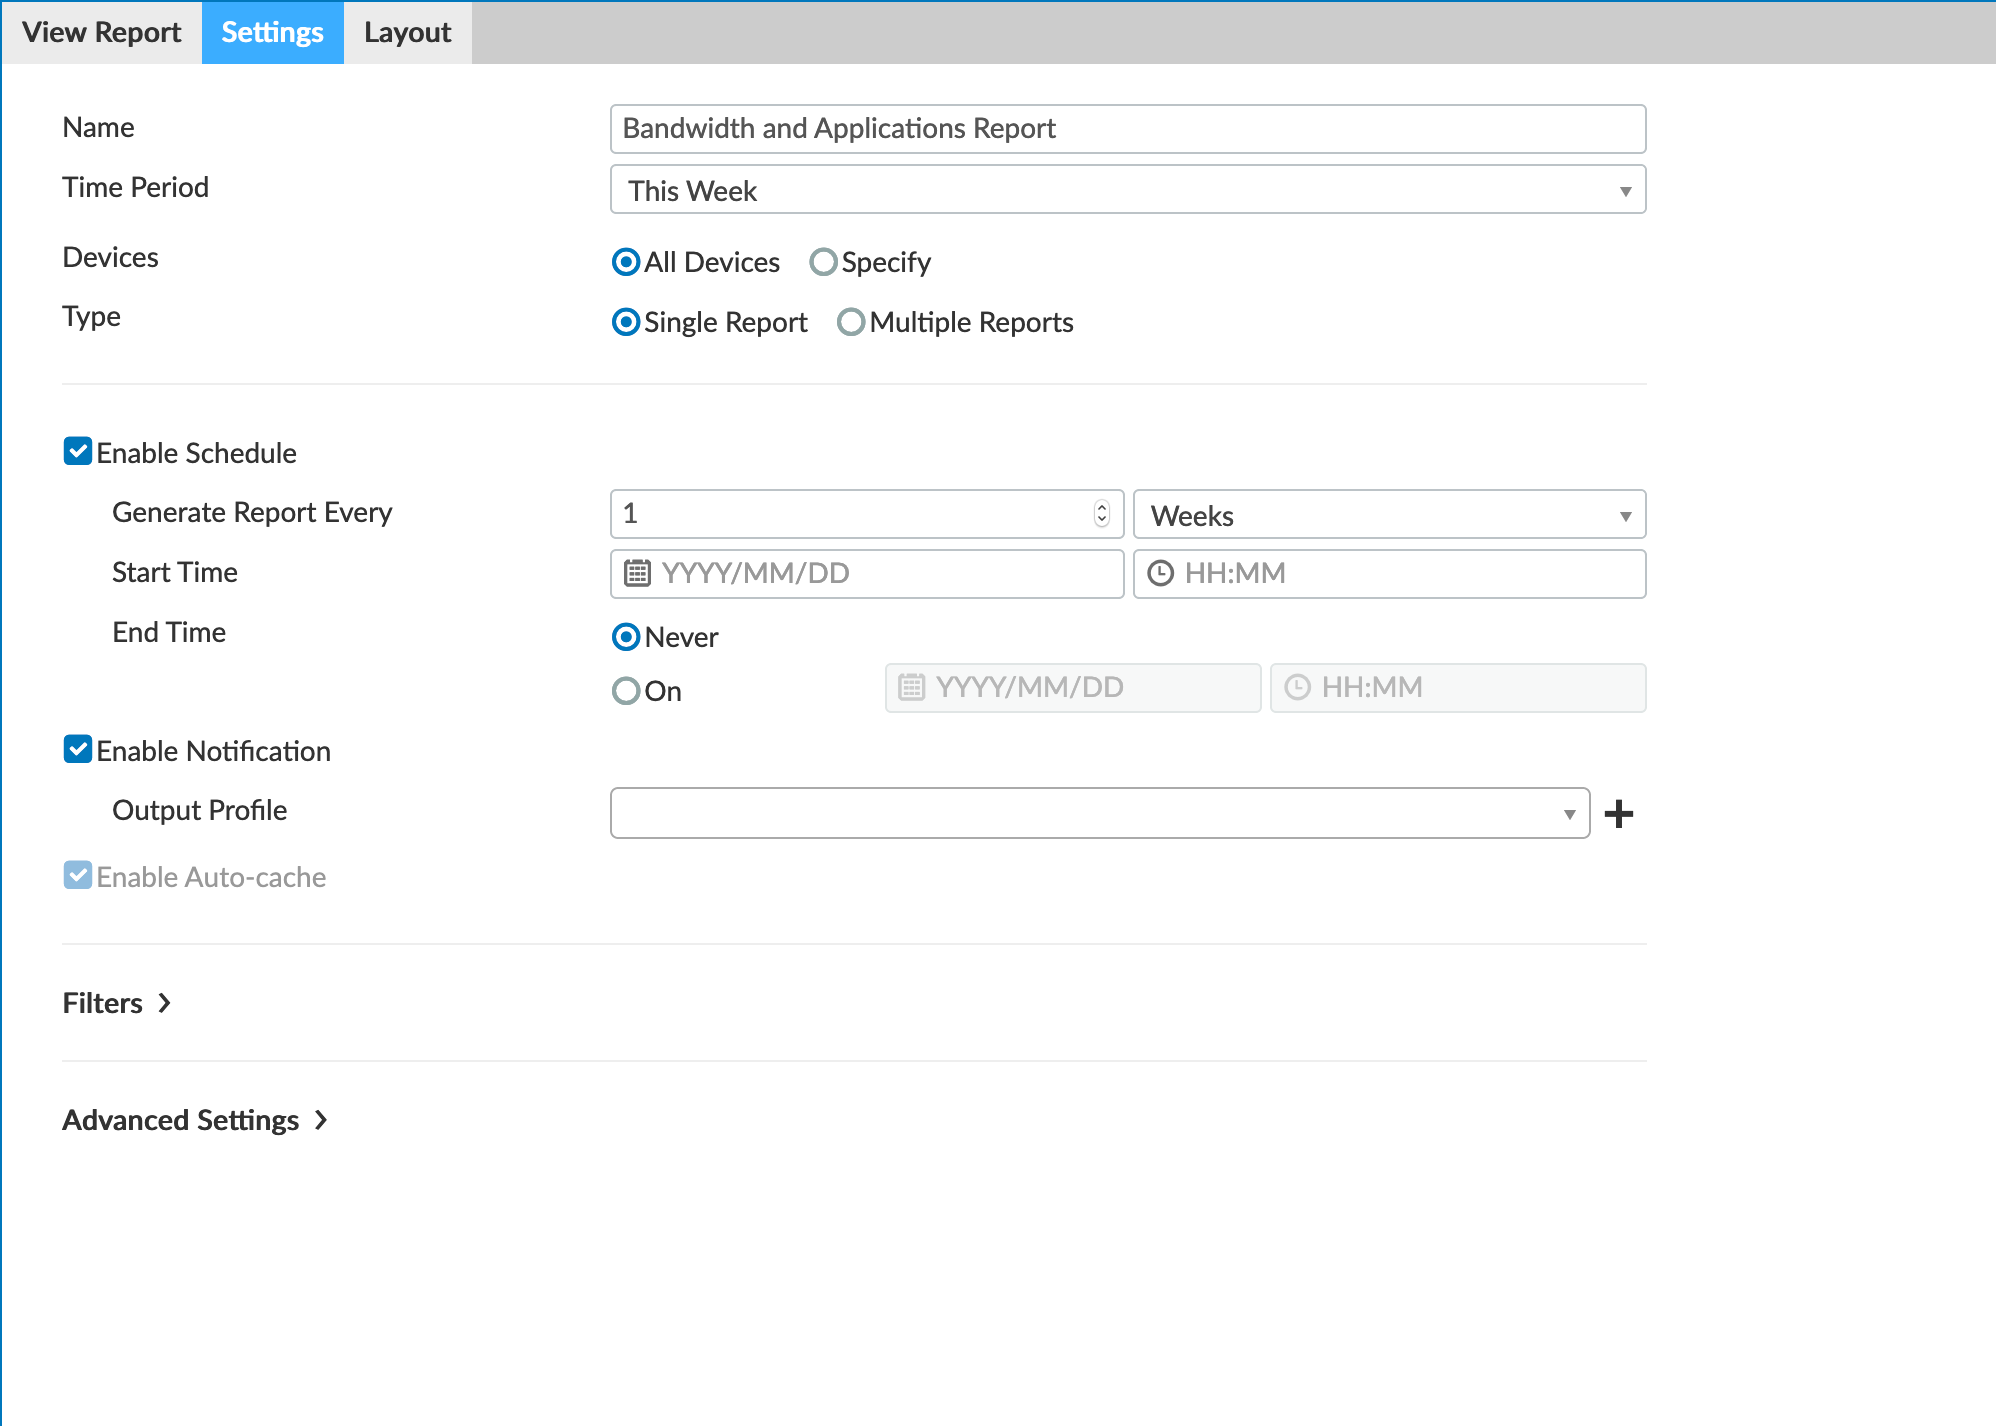
As you can see above, this report can be modified to only cover some or all of your devices, single or multiple reports (one per firewall or 1 report with multiple firewalls), you can schedule, and schedule email.
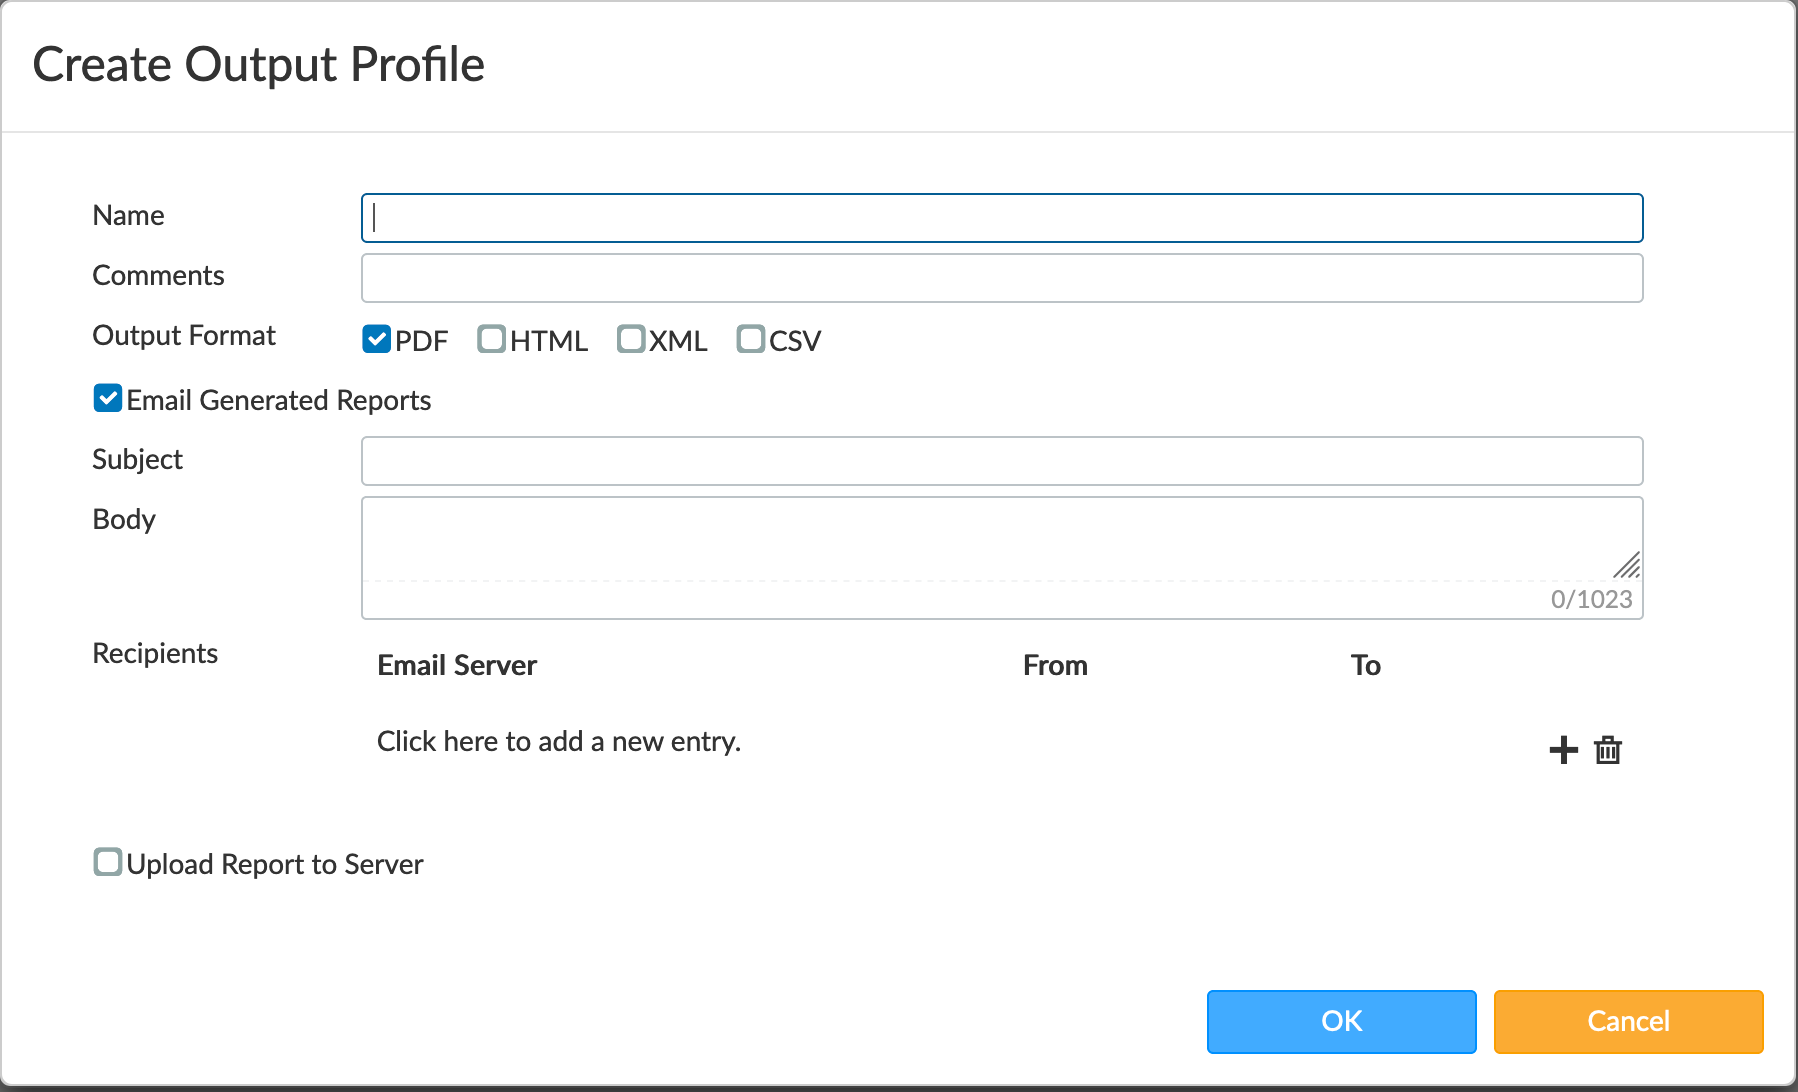
When you email, you can create these profiles that dictate how the report is generated. In the screenshot above, we chose PDF.
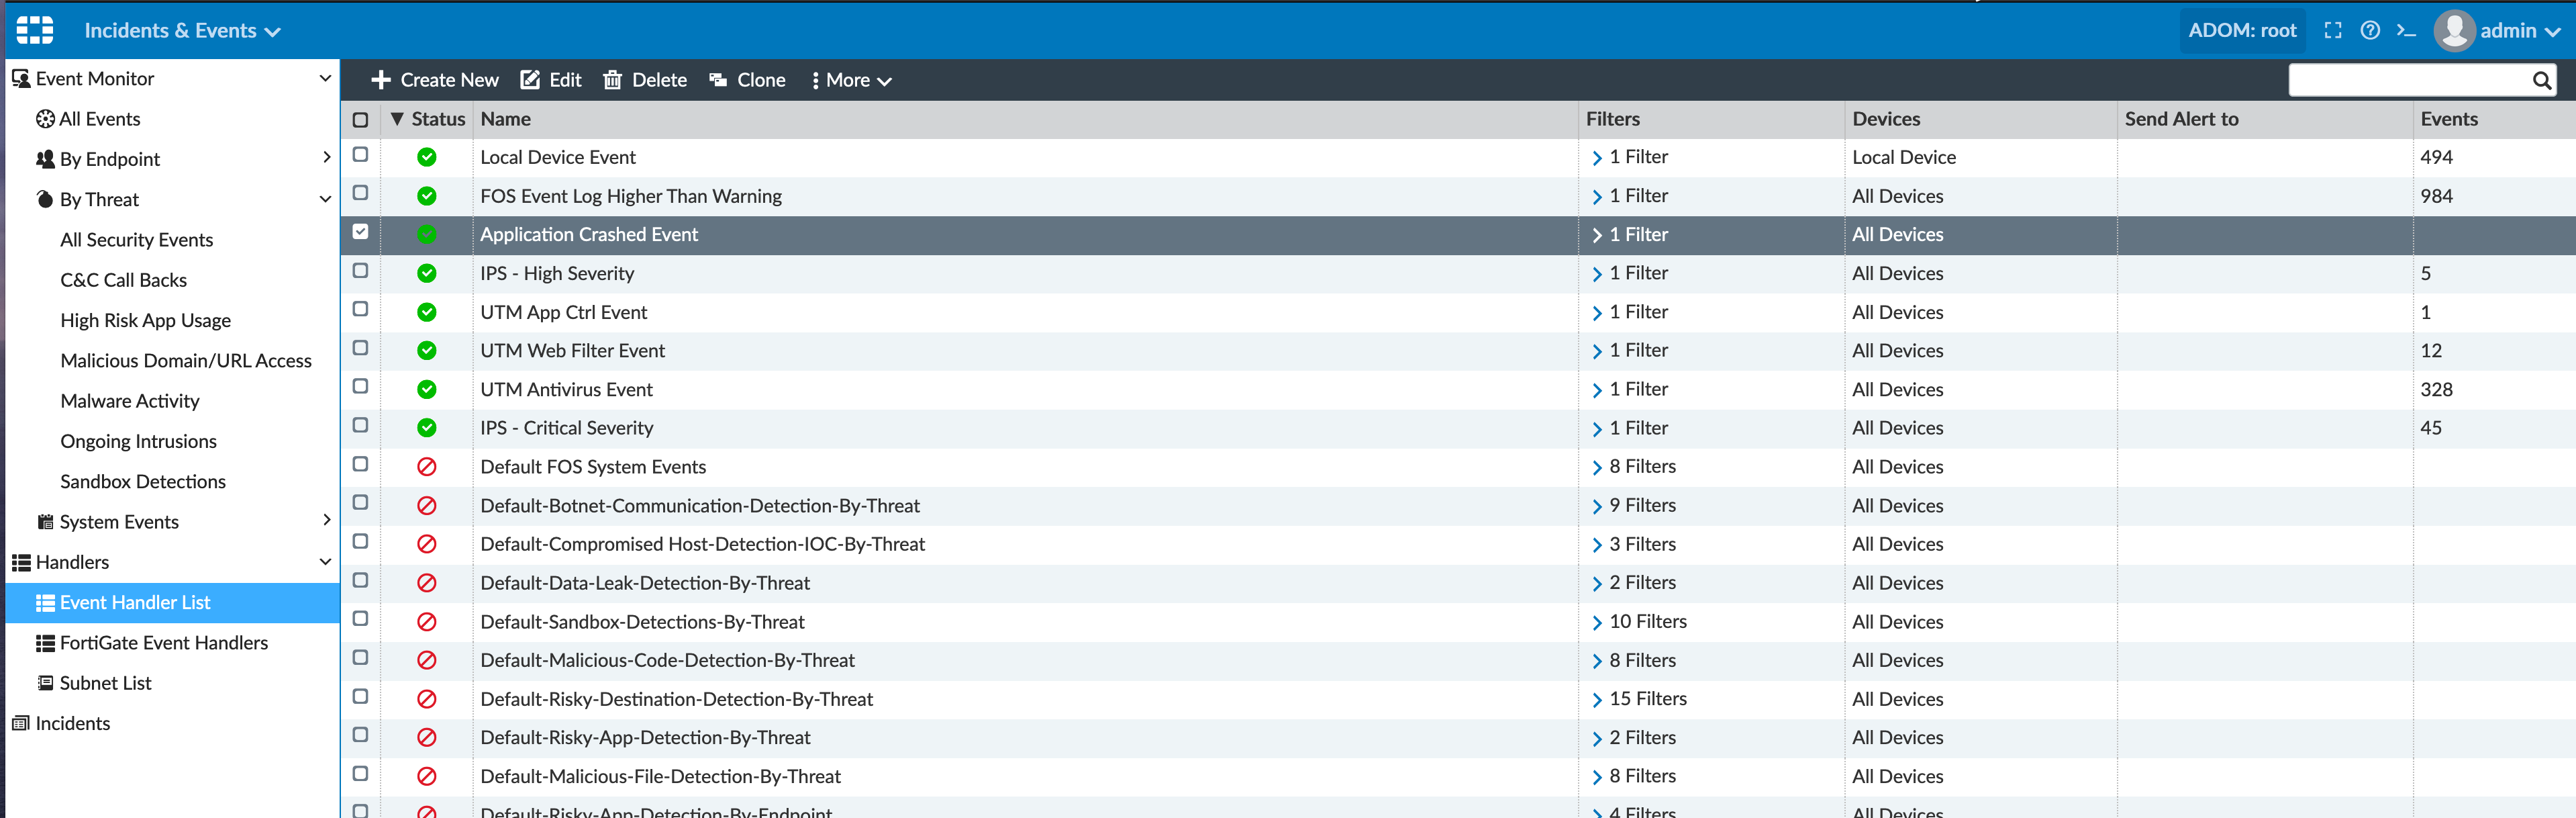
Incident & Events
One of the nice features more so than Fortigates is that you can choose certain types of alerts and have them sent to different emails or SNMP servers. For instance, you could send standard AV alerts to the Help Desk while Critical IPS alerts to your security focussed staff.
I hope this sheds some light on the capability of FortiAnalyzer. If you want to check it out, reach out to your Fortinet sales team or partner to get a trial license.
Hope this helps.
Recent posts
-

-

DNS is one of those technologies that quietly underpins... Full Story
-

BGP issues on FortiGate firewalls usually trace back to... Full Story
-

Every time your laptop talks to your router, a... Full Story
-

If you've spent any time configuring NAT on a... Full Story
-

If you have spent any time configuring firewall policies... Full Story
-

High availability on FortiGate is one of those features... Full Story
-

If you've configured SD-WAN on a FortiGate, you've almost... Full Story
-

FortiLink is the management protocol that turns a FortiSwitch... Full Story
-

FortiSwitches are pretty rock solid from Mean Time Between... Full Story
-

This is a quicky tip. Have you ever gone... Full Story
-

DNS is one of those quiet pieces of internet... Full Story
-

This article is an updated version of the previous... Full Story
-

You will add ns2 as a secondary (slave) BIND9... Full Story
-

In the process of deploying my lab, I needed... Full Story
-

RFC 8805, used to be known as Self-Correcting IP... Full Story
-

Years back, I wrote an article about certificate pinning. ... Full Story
-

FortiGates have the ability to send alerts to Microsoft... Full Story
-

In this post, I am going to walk through... Full Story
-

Troubleshooting VoIP on a FortiGate can feel like trying... Full Story
-

Prior to FortiOS 7.0, there were three commands to... Full Story
-

In this post, I am going to go over... Full Story
-

What we are going to do: We are going... Full Story
-

Choosing between FGCP (FortiGate Clustering Protocol) and FGSP (FortiGate... Full Story
-

Creating a VLAN on macOS (The "Pro" Move) A... Full Story
-

This blog post explores the logic behind how macOS... Full Story
-

Pretty Fly for a Wi-Fi Tell My Wi-Fi Love... Full Story
-

Part of my daily gig is creating BoMs (Bill-of-Materials)... Full Story
-

ICMP introduces several security risks, but careful filtering, rate... Full Story
-

The command diag debug application dhcps -1 enables full... Full Story
-

In the world of FortiOS, execute tac report is... Full Story
-

LLDP; What is it The Link Layer Discovery Protocol... Full Story
-

What it actually does When you run diagnose fdsm... Full Story
-

Monkey Bites are bite-sized, high-impact security insights designed for... Full Story
-

I have run macOS in macOS with Parallels but... Full Story
-

Don't be confused with my other FortiNAC posts where... Full Story
-

This is the third session in a multi-part article... Full Story
-

Today I was configuring key-based authentication on a FortiGate... Full Story
-

Netcat, often called the "Swiss Army knife" of networking,... Full Story
-

At its core, IEEE 802.1X is a network layer... Full Story
-

In case you did not see the previous FortiNAC... Full Story
-

This is our 5th session where we are going... Full Story
-

Now that we have Wireshark installed and somewhat configured,... Full Story
-

The Philosophy of Packet Analysis Troubleshooting isn't about looking... Full Story
-

Have you ever wanted to do some testing on... Full Story
-

Ask ten engineers to define "a network" and you... Full Story
-

1. Executive Summary Objective: This guide turns a FortiAuthenticator... Full Story