At its core, IEEE 802.1X is a network layer... Full Story
By Manny Fernandez
March 21, 2019

Fortigate in One-Arm Sniffer Mode
Not sure if you got the ‘Featured Image’ (One Arm and the nose as the ‘sniffer’) OK. I am done with the jokes for today.
The Fortigate has many ways to deploy and use its interfaces. Some of those are:
- Hardware Switch – Select multiple interfaces that will operate as Layer 2 adjacent. This configuration operates as a standard Ethernet switch.
- Software Switch – Not really recommended due to resource utilization but in some cases it is the only option available. In this option, you can combine multiple interfaces into a single ‘soft switch’. These operate as layer 2 devices even though they are on separate interfaces.
- 803.AD LACP/LAG – Up to 8 interfaces in a bundle that operate as a single logical interface. This is similar to the ‘trunk’ port in the HP world, or ‘ether-channel’ in the Cisco world.
- Loopback – Used for routing and other functions. Interfaces, by default are always up.
- VWire – Essentially a Layer 2 Bridge or ‘bump-in-the-wire’ used when you do not want to make layer 3 IP address changes.
- VLAN – In VLAN mode, the interface will participate as part of an 802.1Q trunk which carries multiple VLANs which are comprised of separate LAN/WAN connections. By default, these VLANs cannot see each other.
- Redundant Interfaces – One interface remains in ‘standby’ mode while the other is in forwarding mode. This is similar to Spanning Tree, where one interface is in blocking while the other is forwarding.
- One-Arm Sniffer – In this mode, you can use a span port on the switch and the Fortigate interface that is in one-arm mode as the destination. I cannot act on behalf because it is in listening only mode. This interface is the subject of this blog post.
I was at a customer that wanted to see the Fortigate in ‘one-arm sniffer‘ mode. His plan was to span the VLAN he had his Cisco ASAs connected to and send it to the Fortigate for reporting.
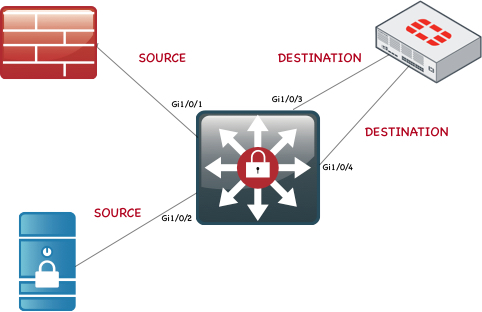
Here is the network diagram of what we are doing. For the customer’s environment, we have two 6500 Series Catalyst switching in the core and two Cisco ASA 5500 Series firewall running legacy ASA code (not FTD). In my example above, we are going to set up two ‘monitor‘ sessions with two ‘destinations‘. These destinations are configured on the Fortigate as ‘one-arm dsniffer‘
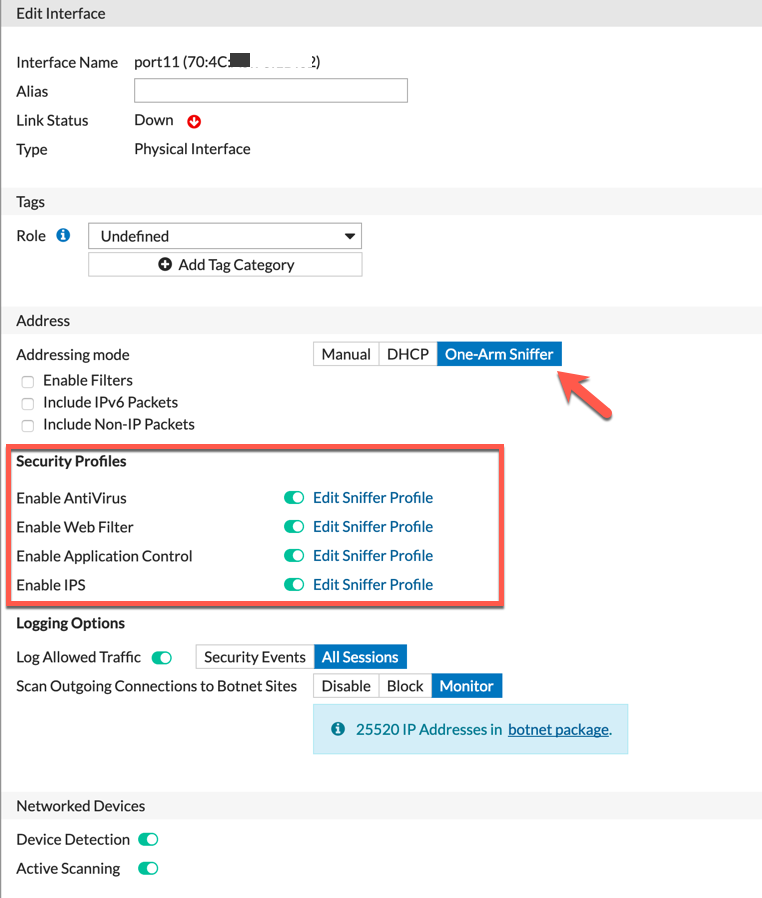
Above, we can see that the ‘addressing mode‘ is set to ‘One-Arm Sniffer‘. We have enabled the ‘security profiles‘ and selected all the available options under that section. We set the ‘Scan Outgoing Connections to Botnet Sites‘ to ‘Monitor‘. In addition to this, I added the ‘Device Detection‘ and ‘Active Scanning‘.

We can see in the figure above that interface 11 is configured in ‘One-Arm Sniffer‘ Although I also configured port12, it was not configured at the time of the screenshot.
Now to configure the profiles that will be used to identify traffic. There are ‘hidden’ profiles (not really hidden, but not visible in the GUI). These profiles are the ones associated with the one-arm sniffer configs.
From the GUI, you will be able to access these profiles but ONLY when you are re-directed from the one-arm sniffer interface page (see Interface Configuration Page above).
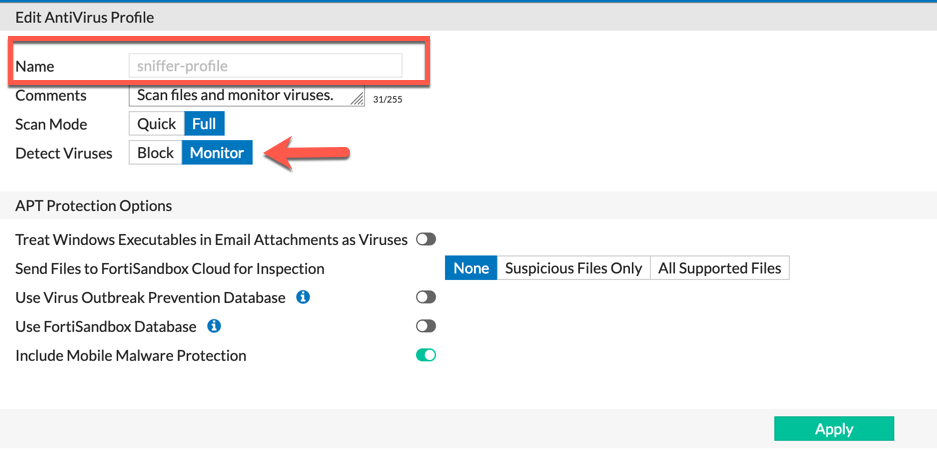
Here we can see the ‘sniffer-profile‘ AV Profile. I got to it by clicking on the hyperlink under the interface configuration page.
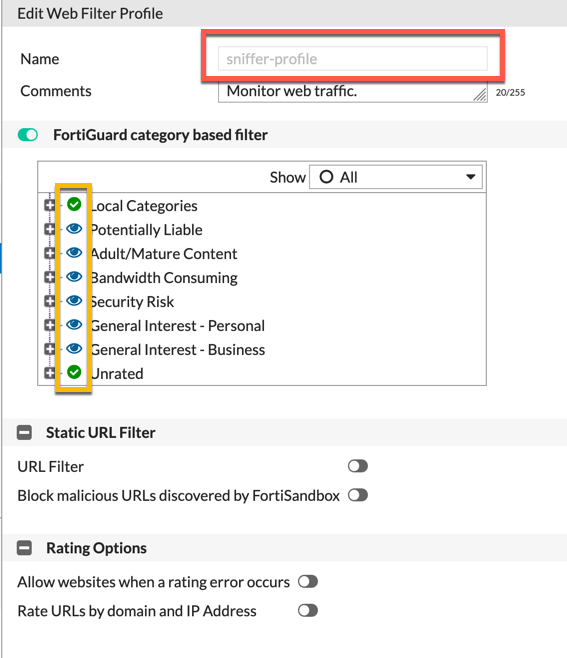
Above you can see the sniffer profile for the Web Content Filtering. This is set to ‘monitor‘ on all the categories. This allows you to log all the traffic based on web categories.

With the IPS, we enable ALL signature and set the default action to ‘Monitor‘. This allows you to see all the signature that would have possibly been blocked by the IPS engine (as long as the signature had the block action associated).
Same with the application sniffer profile.
These profiles can be modified via the CLI as well.
config antivirus profile
config ips sensor
config application list
config webfilter profile
Once you go to these locations, you should find a profile under each named:
“sniffer-profile”
Here is the CLI Version of the screenshots above:
config antivirus profile
edit “sniffer-profile”
set comment “Scan files and monitor viruses.”
config http
set options scan avmonitor
end
config ftp
set options scan avmonitor
end
config imap
set options scan avmonitor
end
config pop3
set options scan avmonitor
end
config smtp
set options scan avmonitor
end
next
I will not go through all of them but you can modify them as needed.
NOTE: Some options are limited based on the platform you are running. If the Fortigate does NOT have a hard drive, you will need to send logs to FortiAnalyzer (you CAN send to other syslog devices but for the best reports, I recommend FAZ).
If you have the hard drive and you want to view the traffic in Fortiview, run the following command on the Fortigate
config report setting
set report-source forward-traffic sniffer-traffic
end
Some other options to consider:
User identification – To view usernames of users traversing the FortiGate, there are a couple of options.
- Poll the AD directly from the Fortigate (Under Fabric Connector)
- Installing FSSO (Fortinet Single Sign On) on a Windows server and point it to your Domain Controllers.
Cisco Switch Configuration
On the Cisco switch, we are going to create to monitor sessions going to two interfaces of the Fortigate configured as ‘one-arm sniffer‘
Session 1 would monitor all traffic that traverses the ‘source’ interface of the ASA firewall.
monitor session 1 source interface Gi1/0/1 both
monitor session 1 destination interface Gi1/0/3
Session 2 would monitor all traffic that traverses the ‘source’ interface of the Server.
monitor session 2 source interface Gi1/0/2 both
monitor session 2 destination interface Gi1/0/4
Recent posts
-

-

In case you did not see the previous FortiNAC... Full Story
-

This is our 5th session where we are going... Full Story
-

Now that we have Wireshark installed and somewhat configured,... Full Story
-

The Philosophy of Packet Analysis Troubleshooting isn't about looking... Full Story
