If you've spent any time configuring user authentication on... Full Story
By Manny Fernandez
March 18, 2019

FortiView Capabilities
A few years ago, I worked for a reseller of networking and security. I created their managed security services practice. While I was there, I was approached by Fortinet in their attempt to have me sell their solution in our SOC. I was apprehensive at first. I had deployed a few Fortigates years ago but I had not done much after that. I explained to Fortinet that I did not have time to test new solutions. I told them I was a Cisco, Palo and Checkpoint guy. They asked me to just check out the product and give them my honest opinion. I explained that I was brutal when it came to that. You can ask anyone at Cisco that dealt with me while at the partner, I was relentless with them.
I used the line from Andrew Kalat (@Lerg) from ‘Defensive Security Podcast’ “Don’t explain the problem as the problem that YOU can fix”. At any rate, I promised to review it and really enjoyed the solution. This was when they first went to 5.4, the product has gotten so much better in the two years I have been working with it. Long story short, I loved it so much, I came to work at Fortinet.
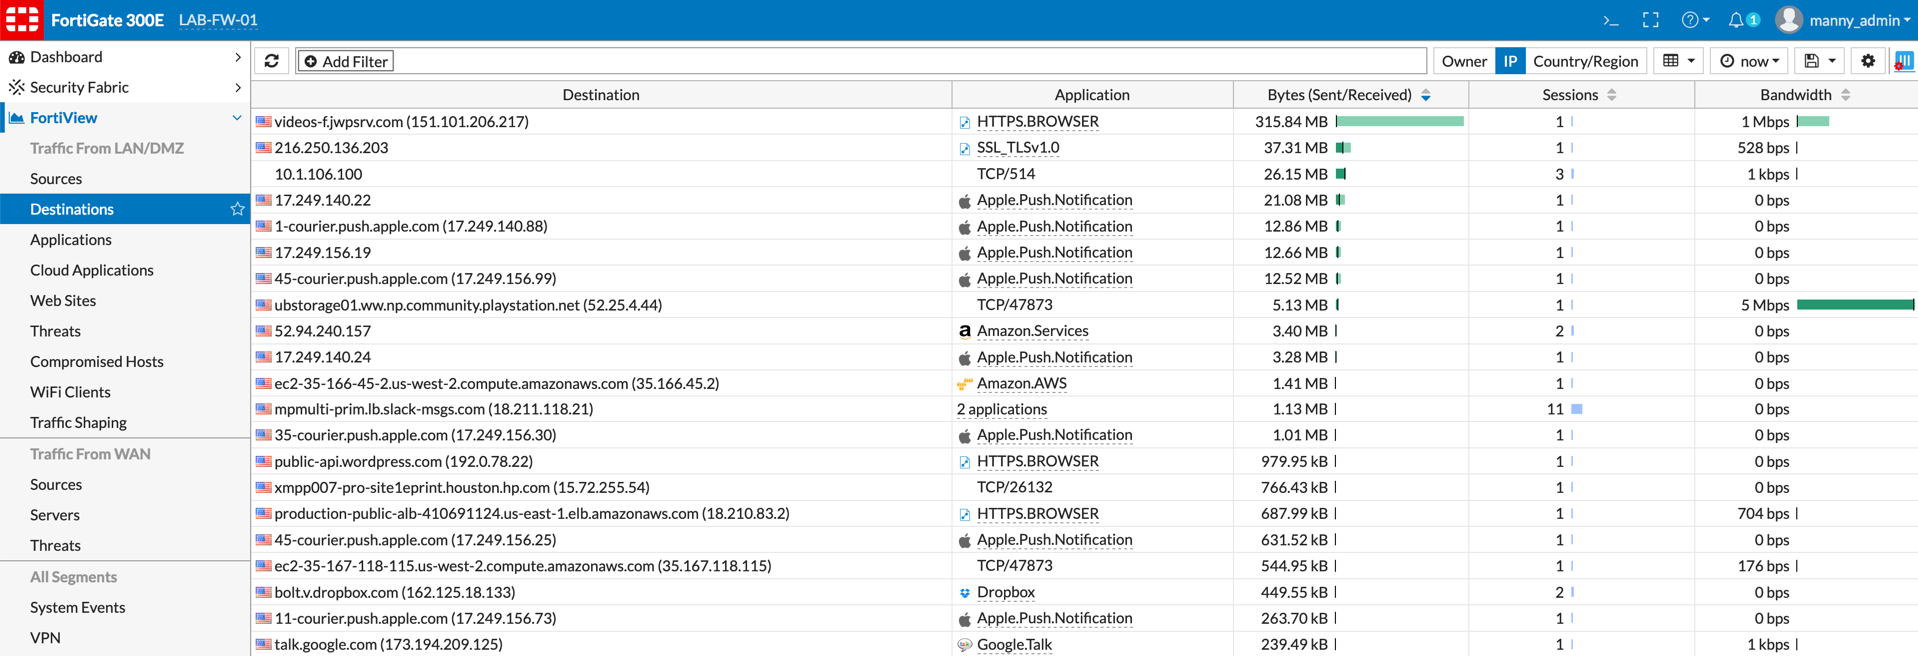
Part of the incredible changes to the product is the introduction to Fortiview. Fortiview allows you to view traffic passing through the Fortigate and allows you to drill down for further analysis.
When you are logged into the Fortigate, you can select ‘Fortiview’ then Source or Destination. In ‘Destination’ specific, you can see traffic that is from a ‘LAN’ category of the interface to a ‘WAN’ categorized interface. You can add filters and to see even more detail, you can double-click on any of those lines.
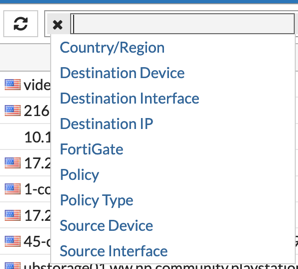
You can filter by any of the entries shown above.

Above, you can see that I filtered the entries by ‘country’ and we can see that the application was ‘WhatsApp’ to ‘157.240.12.53’.
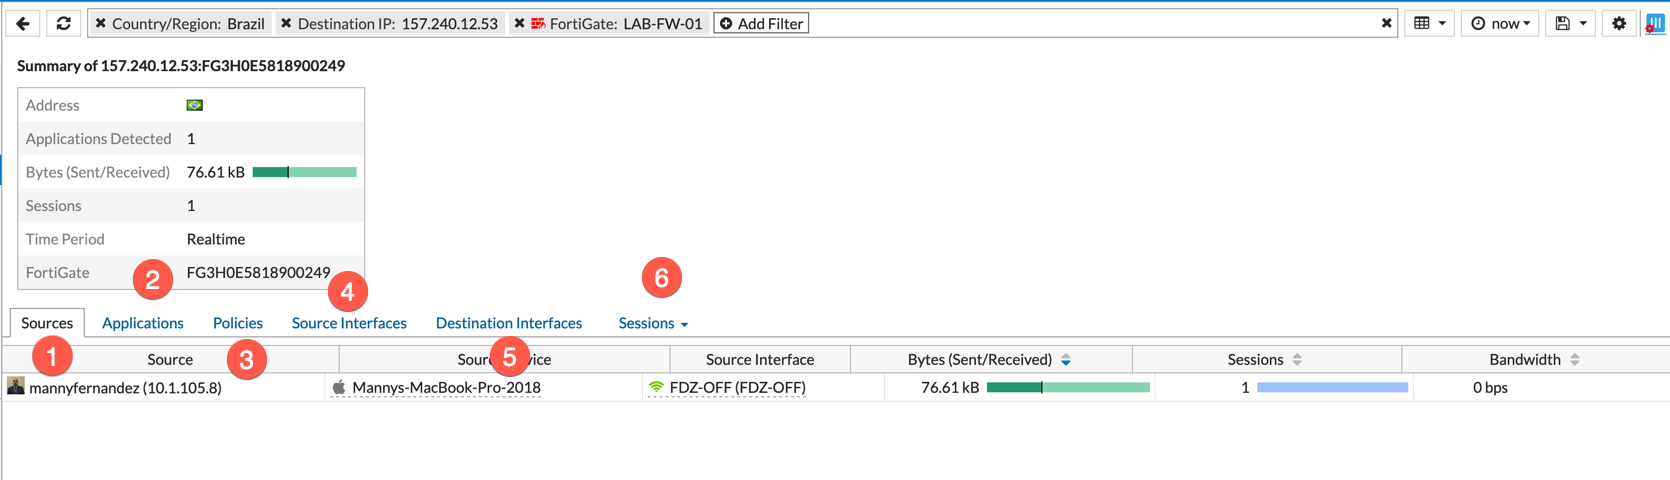
You can double click on the entry and it will show you the sessions with additional details.
- The source, in this case, is my MacBook Pro
- The Applications, that are in use
- The policies that are being hit for the traffic shown.
- The source interface; where the traffic is ingressing from.
- The destination interface; the egress interface.
- The sessions that are active or still in the state table.
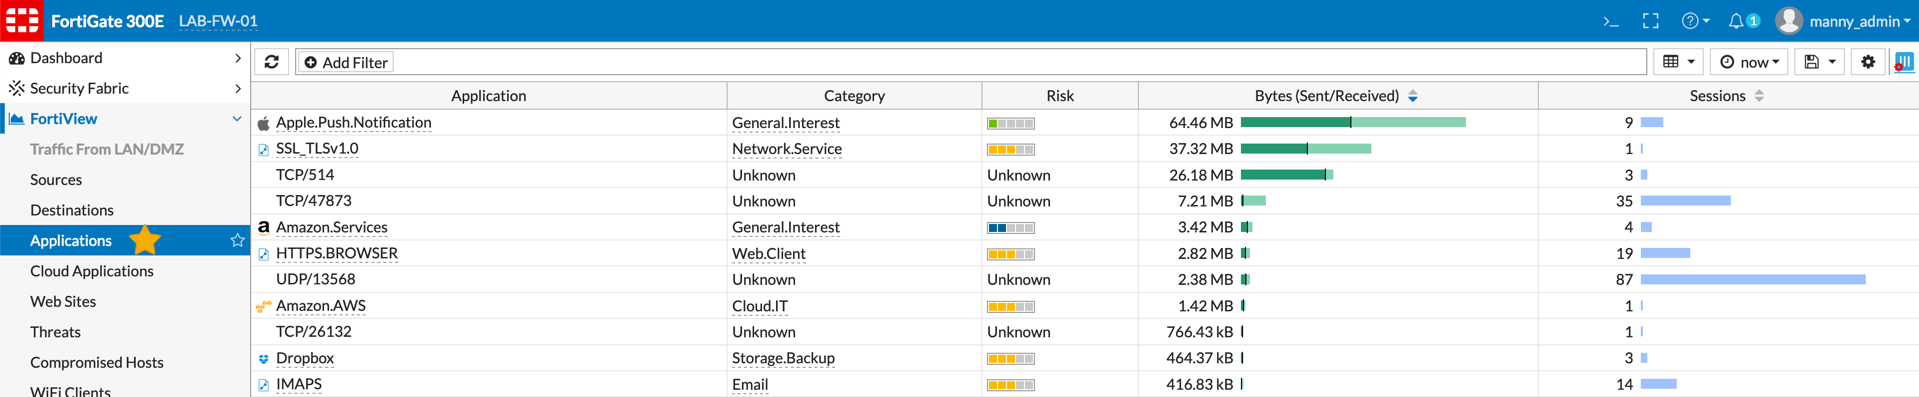
The application section under Fortiview will show you the application, the category of the application as well as the risk rating for the application. Additionally, you can see byte sent/recv as well as sessions.
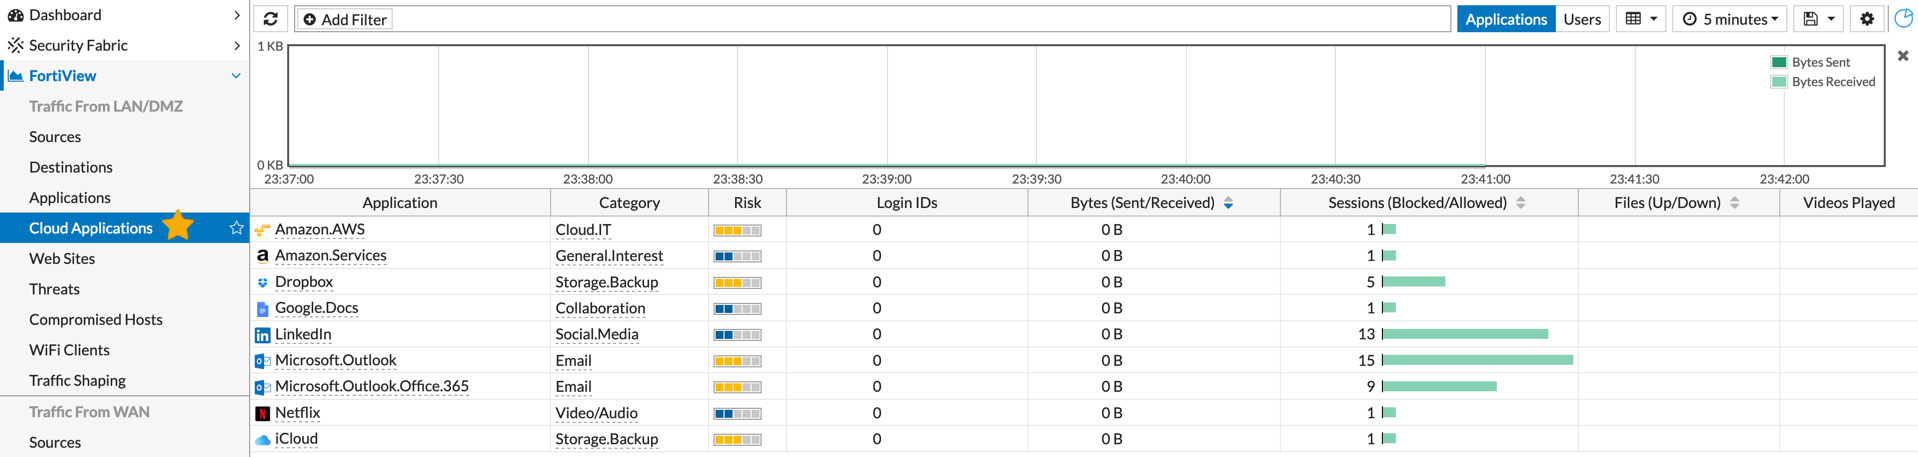
The Cloud Application section of Fortiview gives you information about the cloud applications that are being used on the Fortigate for the period section selected. When you double click on something like ‘YouTube’, it will show you the number of videos they have watched or the number of files that have been downloaded.
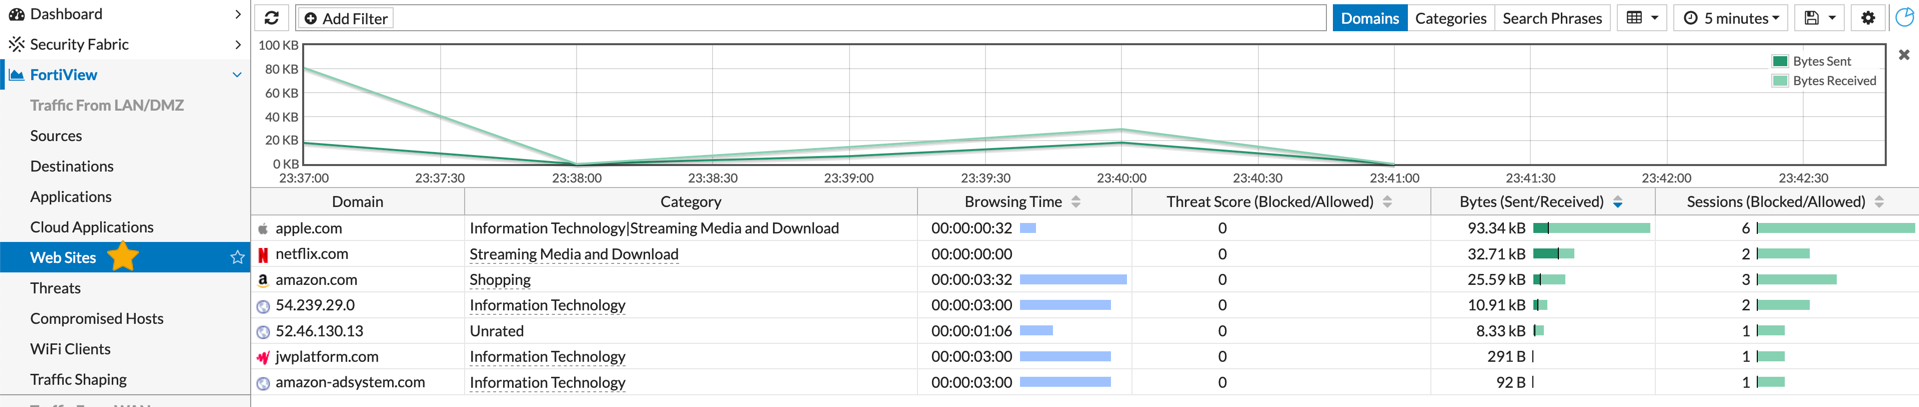
You can select the ‘Web Site’ section of the Fortiview and see the domain name, the category based on Fortiguard, the threat score associated with the domain as well as browsing time, bytes send/received and Sessions blocked/allowed.
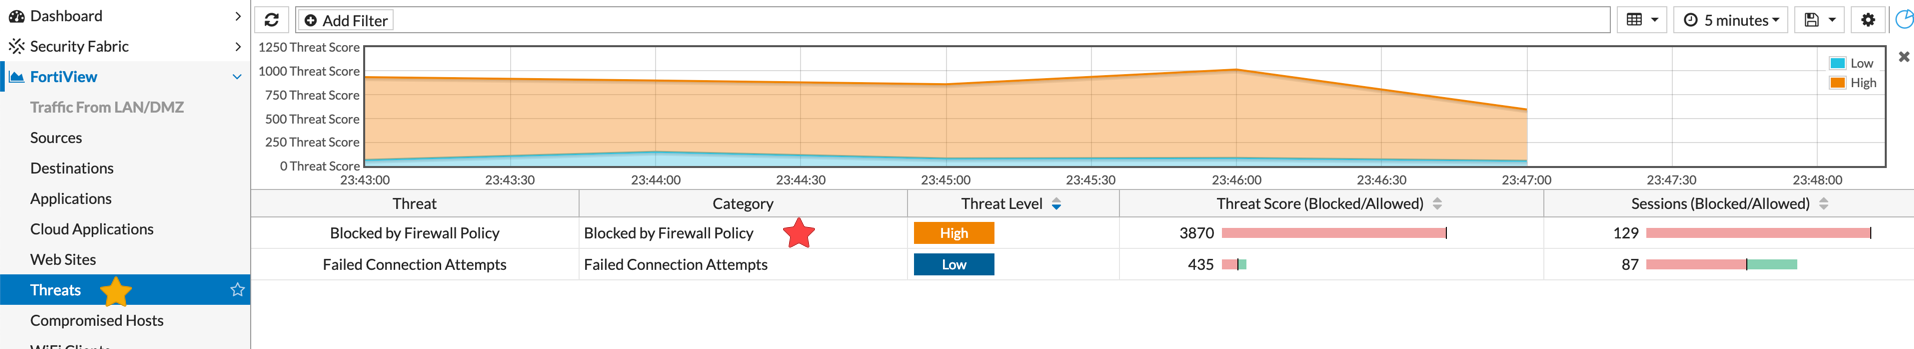
Under ‘Threat’ you will see the threats that were allowed or blocked based on your configuration. If we double-click the ‘Blocked by Firewall Policy’ as an example, under ‘Category’ we can see additional information.
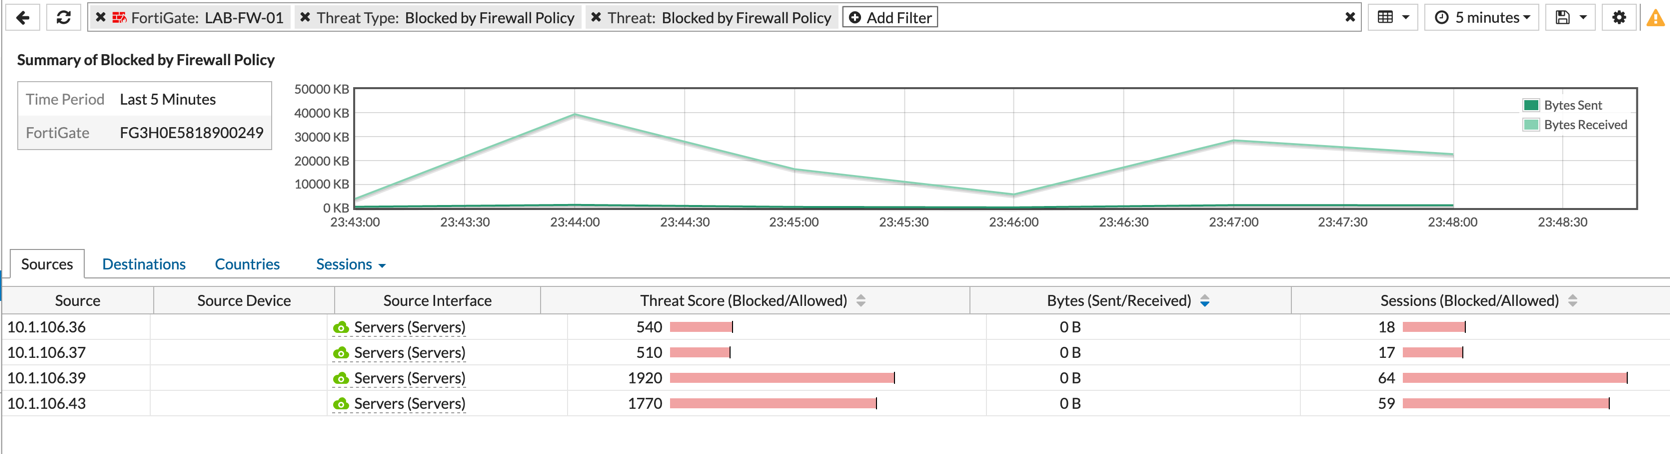
Here we can see that I double-click the ‘Blocked by Firewall Policy’ you can see the different sessions and the various source IP addresses. Once we double-click on any of those sources displayed, we see even more information.
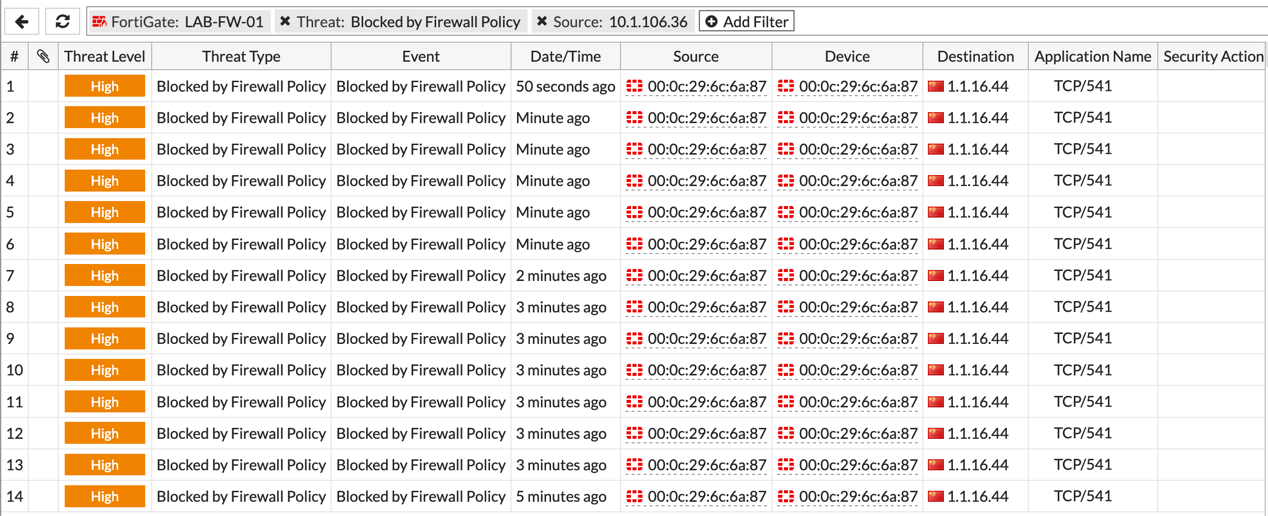
Here we can see how we had some blocked connection from that particular source destined to ‘1.1.16.44’. To see even more additional information, you can double-click any of the entries…
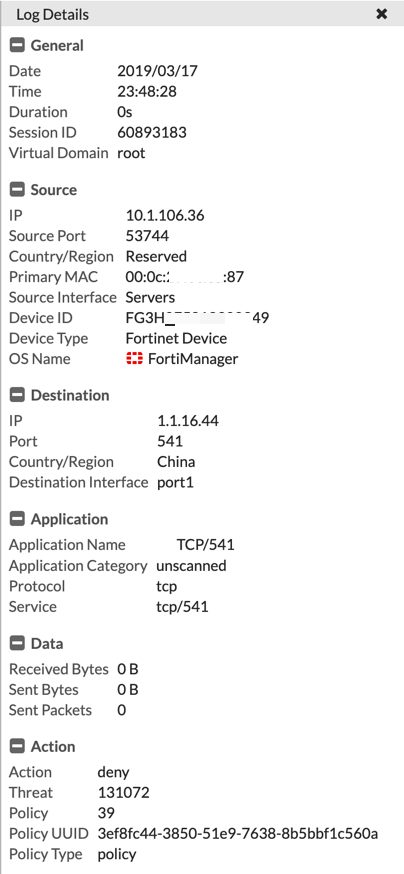
This section is split into two screenshots, however, you can see that the destination IP address is associated with China (although it is not really, but rather a lab IP for this purpose). We can also see the under the ‘Action’ section, we can see ‘Deny’ and that it is based on policy 39.
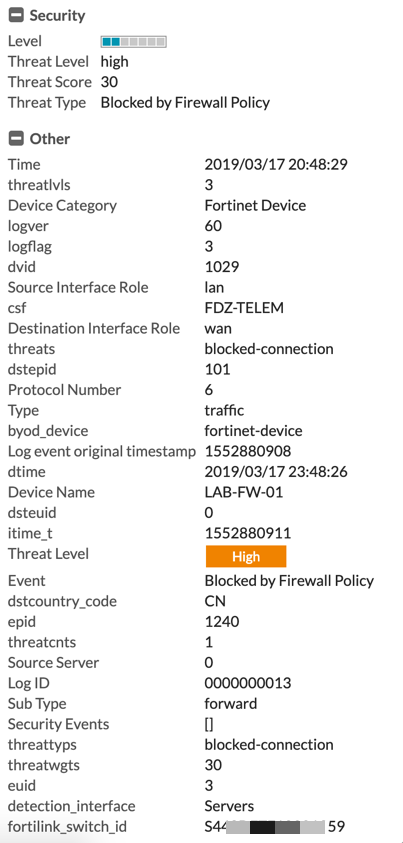
You can see that the logs yield an incredible amount of information.
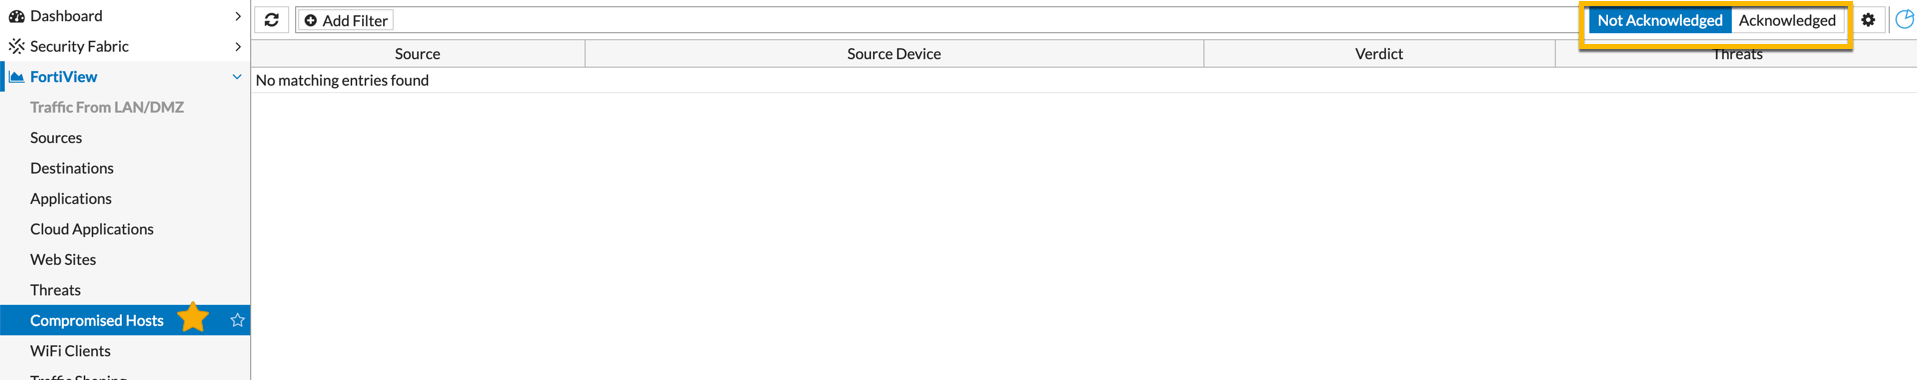
There is also a section ‘Compromised Hosts’ that will show you the compromised hosts on your network. Furthermore, you can filter by ‘Not Acknowledged’ and ‘Acknowledged’.
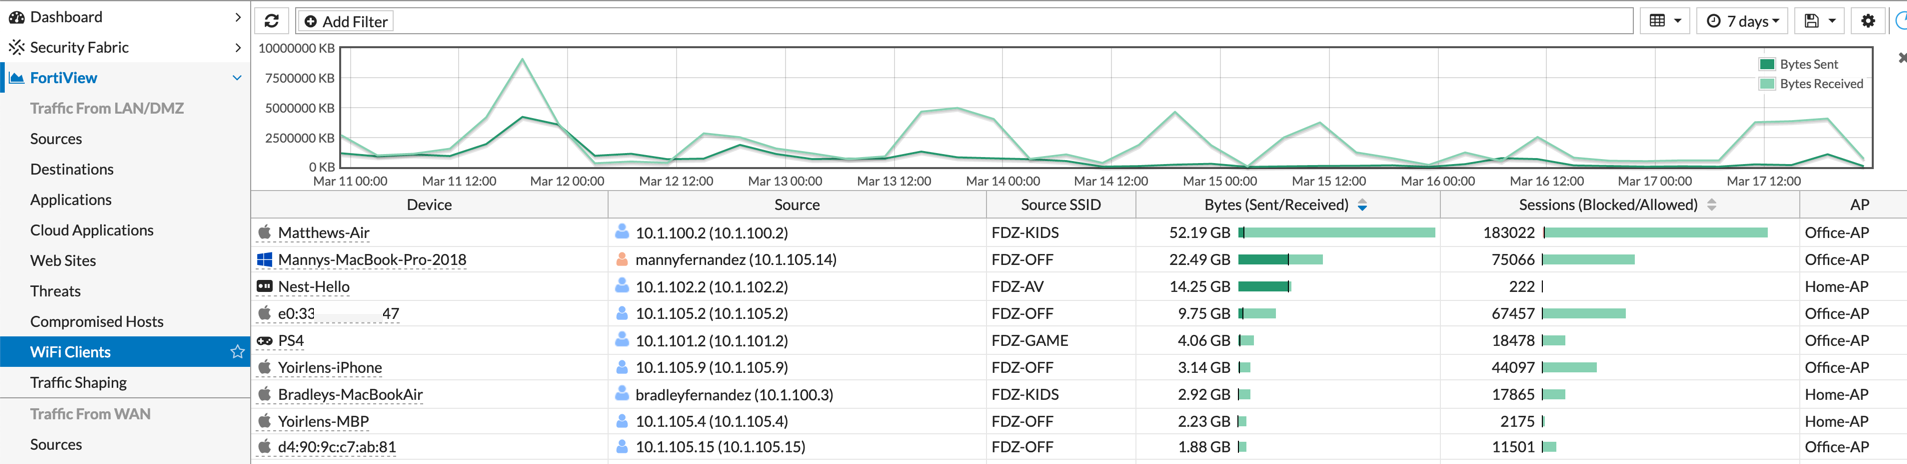
Additionally under the WiFi section, you can see each device that is connected, the SSID, Bytes recv/sent as well as the Sessions blocked/allowed, additionally, you can see the AP you are attached to.
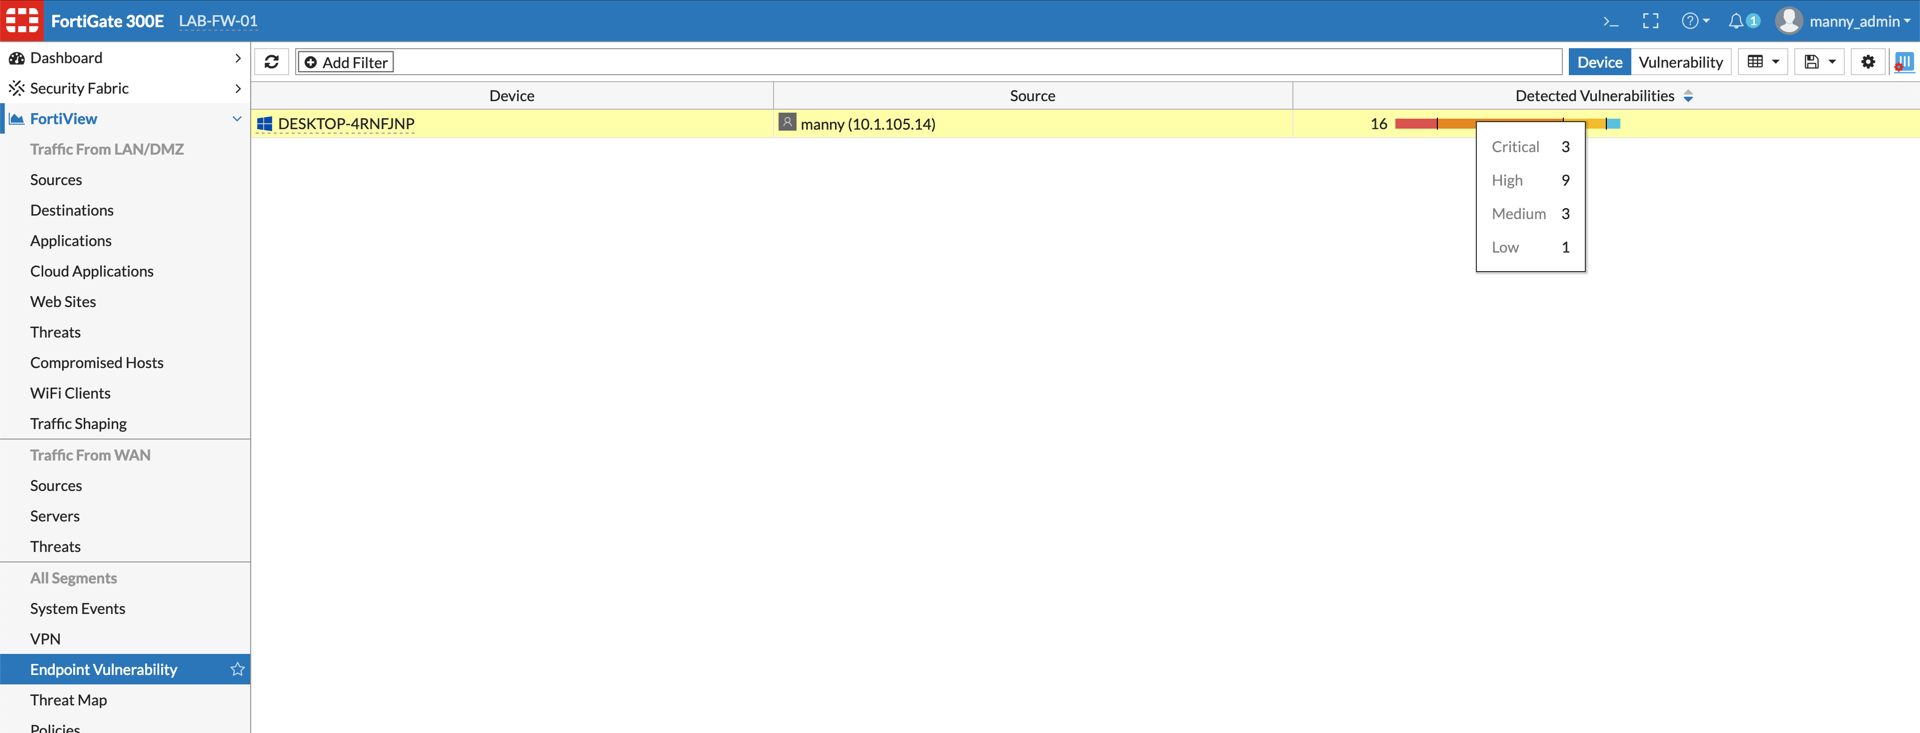
The FortiClient has a built-in Vulnerability Scanner that will collect vulnerabilities and report them to the Fortigate and/or EMS. Above you can see that the test box shown has a number of vulnerabilities.
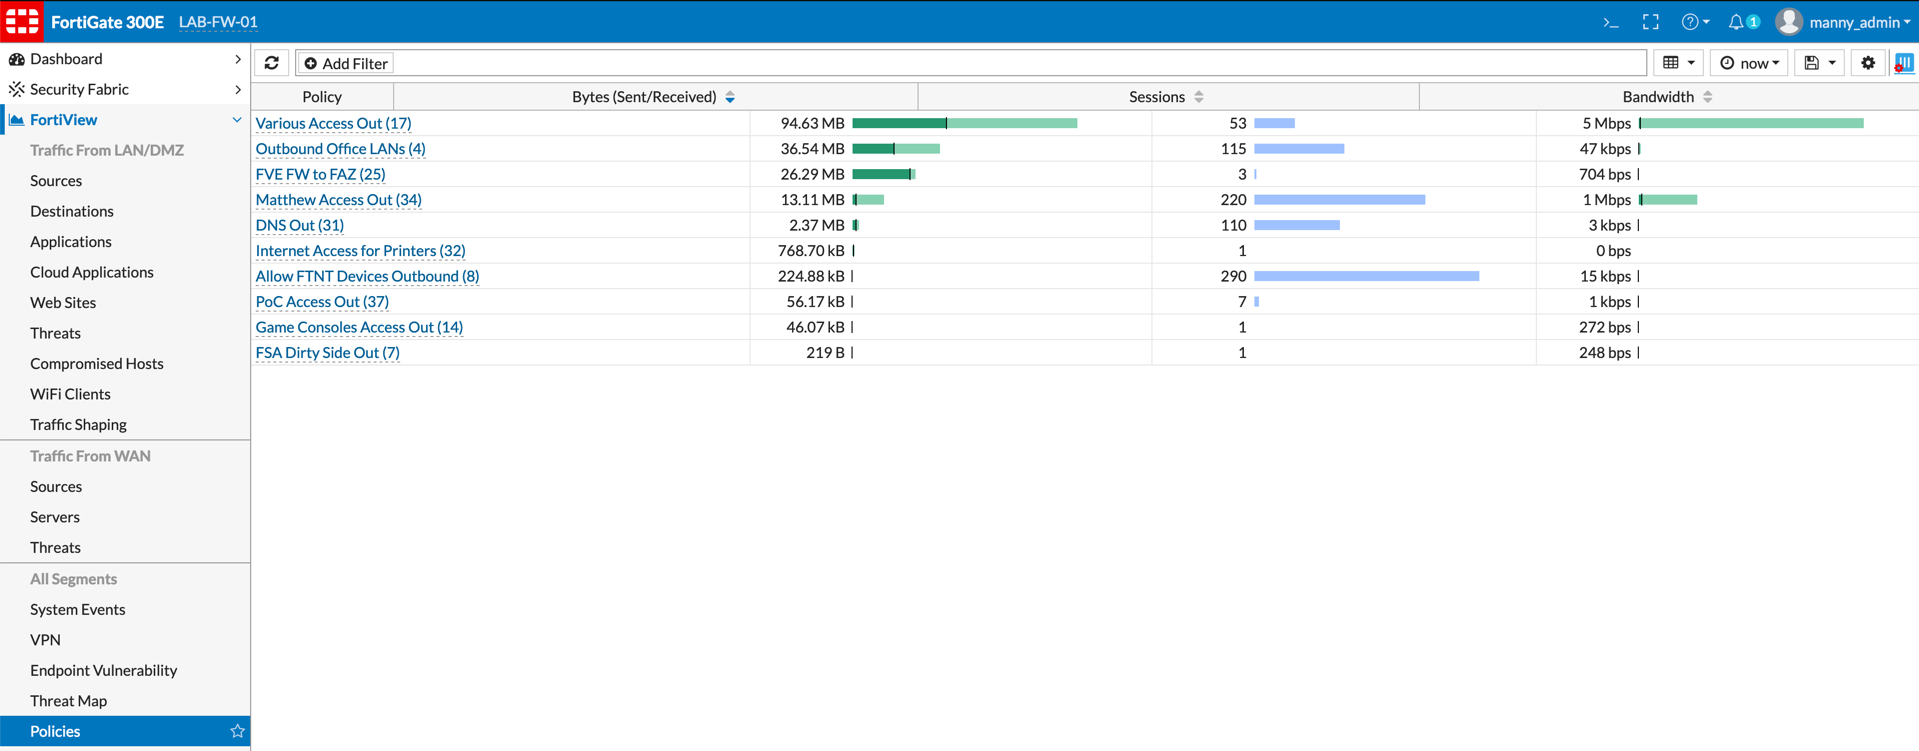
Another useful section is the ‘Policies’. In this section, you can see the policies that are being hit. By double clicking on any of these policies, you will be able to see Source, Destination, and application and services.
Fortinet has made amazing changes to their product. They are not stopping at the Fortiview, stay tuned to even greater visibility and even greater efficacy from the FortiGuard lab team. If you have not seen Fortinet in a while, I recommend you take a second look.
Recent posts
-

-

DNS is one of those technologies that quietly underpins... Full Story
-

BGP issues on FortiGate firewalls usually trace back to... Full Story
-

Every time your laptop talks to your router, a... Full Story
-

If you've spent any time configuring NAT on a... Full Story
-

If you have spent any time configuring firewall policies... Full Story
-

High availability on FortiGate is one of those features... Full Story
-

If you've configured SD-WAN on a FortiGate, you've almost... Full Story
-

FortiLink is the management protocol that turns a FortiSwitch... Full Story
-

FortiSwitches are pretty rock solid from Mean Time Between... Full Story
-

This is a quicky tip. Have you ever gone... Full Story
-

DNS is one of those quiet pieces of internet... Full Story
-

This article is an updated version of the previous... Full Story
-

You will add ns2 as a secondary (slave) BIND9... Full Story
-

In the process of deploying my lab, I needed... Full Story
-

RFC 8805, used to be known as Self-Correcting IP... Full Story
-

Years back, I wrote an article about certificate pinning. ... Full Story
-

FortiGates have the ability to send alerts to Microsoft... Full Story
-

In this post, I am going to walk through... Full Story
-

Troubleshooting VoIP on a FortiGate can feel like trying... Full Story
-

Prior to FortiOS 7.0, there were three commands to... Full Story
-

In this post, I am going to go over... Full Story
-

What we are going to do: We are going... Full Story
-

Choosing between FGCP (FortiGate Clustering Protocol) and FGSP (FortiGate... Full Story
-

Creating a VLAN on macOS (The "Pro" Move) A... Full Story
-

This blog post explores the logic behind how macOS... Full Story
-

Pretty Fly for a Wi-Fi Tell My Wi-Fi Love... Full Story
-

Part of my daily gig is creating BoMs (Bill-of-Materials)... Full Story
-

ICMP introduces several security risks, but careful filtering, rate... Full Story
-

The command diag debug application dhcps -1 enables full... Full Story
-

In the world of FortiOS, execute tac report is... Full Story
-

LLDP; What is it The Link Layer Discovery Protocol... Full Story
-

What it actually does When you run diagnose fdsm... Full Story
-

Monkey Bites are bite-sized, high-impact security insights designed for... Full Story
-

I have run macOS in macOS with Parallels but... Full Story
-

Don't be confused with my other FortiNAC posts where... Full Story
-

This is the third session in a multi-part article... Full Story
-

Today I was configuring key-based authentication on a FortiGate... Full Story
-

Netcat, often called the "Swiss Army knife" of networking,... Full Story
-

At its core, IEEE 802.1X is a network layer... Full Story
-

In case you did not see the previous FortiNAC... Full Story
-

This is our 5th session where we are going... Full Story
-

Now that we have Wireshark installed and somewhat configured,... Full Story
-

The Philosophy of Packet Analysis Troubleshooting isn't about looking... Full Story
-

Have you ever wanted to do some testing on... Full Story
-

Ask ten engineers to define "a network" and you... Full Story
-

1. Executive Summary Objective: This guide turns a FortiAuthenticator... Full Story