At its core, IEEE 802.1X is a network layer... Full Story
By Manny Fernandez
April 6, 2023

FortiGate Troubleshooting Sessions
There are many options when troubleshooting in FortiGate firewalls. I am a BIG sniffer guy. Anyone that knows me or has worked with me, knows my motto of when in doubt, sniff it out. Being able to understand a packet capture is paramount in troubleshooting anything involving networking. FortiOS has many troubleshooting techniques and commands. I regularly use the dia sniffer packet and dia debug flow. Another one is the dia sys session . This command is used to look at the session table.
Stateful inspection; a firewall technology that keeps track of the state of active connections and uses the information to allow reverse traffic through the firewall. For instance, if you are on the inside and make a connection to a web-server, the firewall will automatically permit the return traffic to come through the firewall for a controlled period of time. Stateful Firewalls also create state for stateless traffic such as ICMP and UDP.
I must give credit where credit is due Check Point (as in Check Point Firewall) developed the technique in the 1990s. It has since been adopted as the standard for firewalls from open source IP Tables to FortiGate firewalls and everything in between.
Let’s take a look at the command. The syntax is
LAB-601E # dia sys session
sync List session sync.
list List session.
clear Clear the sessions defined by filter.
stat Stat session.
full-stat Fully stat session.
exp-stat Expectation session statistics.
ttl TTL session.
filter List session with filters.
help Session help.
You almost, almost, almost always want to use the filter option. NOT using it, will show ALL sessions and in a production environment, this WILL overflow your session.
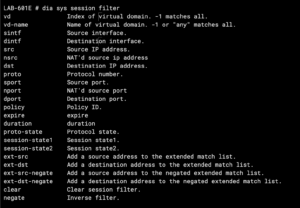
With the filter command, you can get filter out the noise and try to pinpoint the traffic you are interested in. Once you create the filter with this command, you can then use the dia sys session list which will then list the packets that match the filter you created. Now that you created your filter and listed it
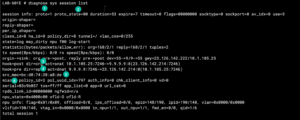
In this example, I am performing a ping to 9.9.9.9 and we want to identify the session.
- We can see
proto=1. Protocols have numbers associated with them. The most used ones isICMPas1,TCPas6andUDPas17 - With
ICMP, theproto_statewill ALWAYS be00since the packet is non-stateful by default. - Source NAT, in this section, you can see
10.1.105.25is talking to9.9.9.9and it will be NAT’d to23.126.142.214 - Destination NAT, this is the return traffic as it is being un-NAT’d.
- MAC address. This section tells you the MAC address of the device in question OR the upstream device such as a router or switch.
- The policy ID the traffic is matching.
Here is a list of protocol numbers:
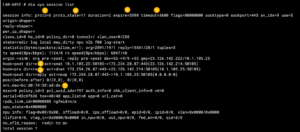
- Here we can see
proto=6which isTCP - State of the proto is
11(see below) - This shows when the packet’s life will
expirein my example, it is3598 - This is the default
tcp timeouton that particular packet. Take a look at mytcp timeoutarticle. - Source NAT, here we can see my
10.1.105.25going to173.254.28.87(www.infosecmonkey.com) - This is the reverse connection.
- Again the MAC address.
In my article I referenced, this tool was essential because I needed to make sure that, THAT particular session needed to stay open for 8 hours.
Now we will look at a udp example
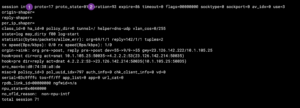
This is very similar to the other examples, but obviously, the proto=17 which is UDP.

duration - duration of the session in seconds.
expire - a countdown based on the 'timeout' defined as the default.
timeout -  How long that session stays in the state table.
shaper - If traffic shaping is being used, this will tell you what shaper is being used.
policy_dir - 0 originating direction | 1 response.
tunnel - VPN tunnel name if one is used.
helper - If helpers are being used, what helper is used.
vlan_cos - Ingress COS values are shown in the output using the range 0-7/255, however, admin COS values are within the range of 8-15/255
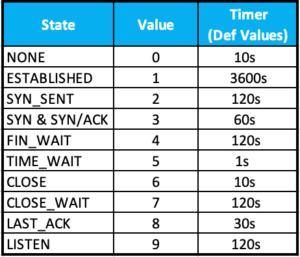
state - The Values are contained in the table below.
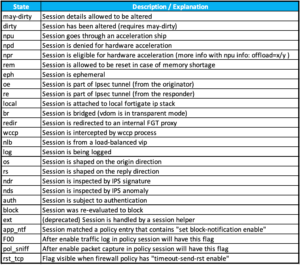
Remember to always issue the dia sys session filter clear or you will get info you may not be expecting or want.
Recent posts
-

-

In case you did not see the previous FortiNAC... Full Story
-

This is our 5th session where we are going... Full Story
-

Now that we have Wireshark installed and somewhat configured,... Full Story
-

The Philosophy of Packet Analysis Troubleshooting isn't about looking... Full Story
