If you've spent any time configuring user authentication on... Full Story
By Manny Fernandez
June 2, 2019

Troubleshooting Fortigate HA
Updated 20190602
Whe you have two Fortigates and you have configured them in HA, we sometimes see issues where they do not sync. You can look at the configs and ensure that it is configured correctly, but what do you do when the two firewalls STILL do not sync.
Here are some commands and techniques I use to troubleshoot HA Problems.
By running the ‘diagnose sys ha checksum show’ on both devices, you can see if the two firewalls’ configs match. Forthermore, you will be able to see what portion of the configs are NOT in sync.
Master Firewall
diagnose sys ha checksum show
is_manage_master()=1, is_root_master()=1
debugzone
global: 8c dd b6 0e 16 23 19 9a f4 7b 67 ac 42 b5 15 f4
root: 7c f4 0c 6e e3 96 04 be f7 3e 2c 62 a6 bd 01 0e
all: 53 dd 29 93 64 bd a9 b7 c1 93 17 42 4a d6 f5 15

checksum
global: 8c dd b6 0e 16 23 19 9a f4 7b 67 ac 42 b5 15 f4
root: 7c f4 0c 6e e3 96 04 be f7 3e 2c 62 a6 bd 01 0e
all: 53 dd 29 93 64 bd a9 b7 c1 93 17 42 4a d6 f5 15
Slave Firewall
diagnose sys ha checksum show
is_manage_master()=0, is_root_master()=0
debugzone
global: ed 8b 56 2c 6b 99 60 8d f7 32 3d ce 62 28 f6 d9
root: 50 e8 38 cb 8b 48 1d 9f 84 e9 5e e0 ed 00 52 7f
all: e6 a7 16 66 2a 15 ff 57 26 39 ba 18 36 02 ca 14

checksum
global: ed 8b 56 2c 6b 99 60 8d f7 32 3d ce 62 28 f6 d9
root: 50 e8 38 cb 8b 48 1d 9f 84 e9 5e e0 ed 00 52 7f
all: e6 a7 16 66 2a 15 ff 57 26 39 ba 18 36 02 ca 14
NOTE: You can also use the ‘diagnose sys ha checksum cluster’ to see both.
We can clearly see that the ‘Slave’ firewall ‘global’ section differs from the master. We can see that ‘global’ on the Master ends in ‘b5 15 f4’ while the Slave’s ‘Global’ section ends in ’28 f6 d9’
Lets say that you want to see where exactly the difference lies on the ‘global’ section, you would need to run the following:
‘diagnose sys ha checksum show global’
Similar to the above command, this command specifies ‘global’. You can run the command with the ‘root’ switch to compare that section as well other VDOMs if you happen to be using them.
Your best bet is to capture the output of both commands on both firewalls, and then use a diff application/utility to compare the two.
With the output, we can see that there is an error on the ‘interfaces’. This could be something where the slave has a VLAN trunk not present on the master or something similar. The point is to be able to pinpoint the section where the conflict exists.
PRO TIP: If you want to access the slave unit from the Master unit, enter the following:
get system ha status

Master:200

FGT500E-8 FGT5K2801021111 1 Slave :128 FGT500E-3 FGT5K0028030322 0
execute ha manage 0 %admin-account%
THE MOST IMPORTANT THINGS TO NOTE:
Give it time. If you see the the files are in sync from a diagnose sys ha checksum show perspective and the output of get system ha status shows that they are in sync, give it time to sync. Give it a few minutes.
The ‘get system ha status’ will give you the following output:
HA Health Status: OK
Model: FortiGate-100E
Mode: HA A-P
Group: 0
Debug: 0
Cluster Uptime: 35 days 2:30:25
Cluster state change time: 2018-11-29 14:14:03
Master selected using:
<2018/11/29 14:14:03> FG100<REMOVED>0 is selected as the master because it has the largest value of uptime.
<2018/11/29 13:56:53> FG100<REMOVED>0 is selected as the master because it's the only member in the cluster.
ses_pickup: enable, ses_pickup_delay=disable
override: disable
Configuration Status:
FG100<REMOVED>0(updated 5 seconds ago): in-sync
FG100<REMOVED>2(updated 1 seconds ago): in-sync
System Usage stats:
FG100E<REMOVED>0(updated 5 seconds ago):
sessions=20, average-cpu-user/nice/system/idle=0%/0%/0%/99%, memory=37%
FG100<REMOVED>2(updated 1 seconds ago):
sessions=0, average-cpu-user/nice/system/idle=0%/0%/0%/99%, memory=36%
HBDEV stats:
FG100<REMOVED>0(updated 5 seconds ago):
ha1: physical/1000auto, up, rx-bytes/packets/dropped/errors=2531834102/21953614/0/0, tx=1367520059/25722775/0/0
ha2: physical/1000auto, up, rx-bytes/packets/dropped/errors=1723489184/15159840/0/0, tx=1875201142/15160119/0/0
FG100<REMOVED>2(updated 1 seconds ago):
ha1: physical/1000auto, up, rx-bytes/packets/dropped/errors=1368194283/25722784/0/0, tx=2530579002/21953633/0/0
ha2: physical/1000auto, up, rx-bytes/packets/dropped/errors=1875205619/15160130/0/0, tx=1723496330/15159858/0/0
MONDEV stats:
FG100<REMOVED>0(updated 5 seconds ago):
wan2: physical/1000auto, up, rx-bytes/packets/dropped/errors=3329193710/24219230/0/0, tx=2913222327/8262630/0/0
FG100<REMOVED>2(updated 1 seconds ago):
wan2: physical/1000auto, up, rx-bytes/packets/dropped/errors=878991333/13504560/0/0, tx=0/0/0/0
Master: <REMOVED> , FG100<REMOVED>0, cluster index = 0
Slave : <REMOVED> , FG100<REMOVED>2, cluster index = 1
number of vcluster: 1
vcluster 1: work 169.254.0.1
Master: FG100<REMOVED>0, operating cluster index = 0
Slave : FG100<REMOVED>2, operating cluster index = 1
You can see the section that says in-sync. This tells you the configuration is in sync. Below are some additional HA troubleshooting commands you can use.
dia debug application hasync -1
dia debug application hatalk -1
dia deb ena
The above output will show you the process of the HA Heartbeat conversations as well as the synchronization of the configs.
Differences on Chassis Units
Chassis ID
With a chassis based Fortigate firewall, make sure you have unique chassis id' on each Fortigate. If you have the HA config on both units but the second firewall does not appear in the GUI, chances are you missed this step or the group-name.
MASTER UNIT
config system ha
set group-id 1
set group-name "CUSTOMER-HA"
set mode a-p
set password <password removed>
set hbdev "ha1" 0 "ha2" 0
set chassis-id 1
set hbdev-second-vlan-id 998
set session-pickup enable
set override disable
set priority 180
end
SLAVE UNIT
config system ha
set group-id 1
set group-name "CUSTOMER-HA"
set mode a-p
set password <password removed>
set hbdev "ha1" 0 "ha2" 0
set chassis-id 2
set hbdev-second-vlan-id 998
set session-pickup enable
set override disable
set priority 128
end
Troubleshooting Sync Issues on Chassis Based Units
Specifically on the 7K, 6K, and 3700D series boxes, there is a different set of commands to run to validate synchronization. With these boxes, you will see the GUI showing the HA is in sync, but if you go out to the CLI and run the `diagnose sys ha checksum cluster` command, it will not show the firewalls in sync.

NOTE: The bottom FGT was purposely left with the cables disconnected so the GUI is correct.
However if you type the get sys ha status command, it will tell you it is in sync.
F6KF30<REMOVED>(global) # get sys ha status
HA Health Status: OK
Model: FortiGate-6000F
Mode: HA A-P
Group: 1
Debug: 0
Cluster Uptime: 0 days 4:33:46
Cluster state change time: 2019-05-31 19:54:13
Master selected using:
<2019/05/31 19:54:13> F6KF30<REMOVED>is selected as the master because its peer has no active worker.
<2019/05/31 19:50:49> F6KF30<REMOVED>is selected as the master because it's the only member in the cluster.
<2019/05/31 19:50:43> F6KF30<REMOVED>is selected as the master because the peer member F6KF30<REMOVED> has SET_AS_SLAVE flag set.
<2019/05/31 19:39:58> F6KF30<REMOVED> is selected as the master because it has the largest value of uptime.
ses_pickup: enable, ses_pickup_delay=disable
override: disable
Configuration Status:
F6KF30<REMOVED>(updated 5 seconds ago): in-sync
F6KF30<REMOVED>(updated 1 seconds ago): in-sync
System Usage stats:
F6KF30<REMOVED>(updated 5 seconds ago):
sessions=45439, average-cpu-user/nice/system/idle=0%/0%/0%/99%, memory=11%
F6KF30<REMOVED>(updated 1 seconds ago):
sessions=33673, average-cpu-user/nice/system/idle=0%/0%/0%/99%, memory=10%
When you run the non-chassis command, you can see that the devices appear to be out of sync (See red text below)
F6KF30<REMOVED> (global) # diagnose sys ha checksum cluster

================== F6KF30<REMOVED> ==================

is_manage_master()=1, is_root_master()=1
debugzone
global: 75 99 03 87 1b 15 fa 9c f6 9b a8 e4 3b b9 90 7c
root: 53 86 74 dd 65 a2 98 38 9c fe 8d 95 7b 86 29 30
mgmt-vdom: ce 2c 1a 33 38 69 d1 30 4b 4c 15 09 8a 06 4f b0
all: 77 33 97 a3 6f cb 26 20 55 c8 fe b2 a8 03 4e 5b

checksum
global: 75 99 03 87 1b 15 fa 9c f6 9b a8 e4 3b b9 90 7c
root: 53 86 74 dd 65 a2 98 38 9c fe 8d 95 7b 86 29 30
mgmt-vdom: ce 2c 1a 33 38 69 d1 30 4b 4c 15 09 8a 06 4f b0
all: 77 33 97 a3 6f cb 26 20 55 c8 fe b2 a8 03 4e 5b

================== F6KF30<REMOVED> ==================

is_manage_master()=0, is_root_master()=0
debugzone
global: 32 06 5d ce 11 2e d3 18 76 fc 4c 41 63 1b a6 e3
root: e7 d1 e6 4a 16 bd 78 e5 41 6b 16 ed c2 37 75 cd
mgmt-vdom: b4 1d da cb 28 a8 0c 7d 45 ba 58 98 d9 25 57 67
all: 55 06 53 5a 69 ee b6 46 61 a2 8f 4f cb 04 00 d0

checksum
global: 32 06 5d ce 11 2e d3 18 76 fc 4c 41 63 1b a6 e3
root: e7 d1 e6 4a 16 bd 78 e5 41 6b 16 ed c2 37 75 cd
mgmt-vdom: b4 1d da cb 28 a8 0c 7d 45 ba 58 98 d9 25 57 67
all: 55 06 53 5a 69 ee b6 46 61 a2 8f 4f cb 04 00 d0
However, when the proper command is typed, you can see a different output but you see it based on ‘blades’ or line cards. The command is diag sys confsync status. You can see the sync commands in red below.
F6KF30<REMOVED> (global) # diag sys confsync status
==========================================================================
Slot: 1 Module SN: FPC6KFT0<REMOVED>
ELBC: svcgrp_id=1, chassis=1, slot_id=1
ELBC HB devs:
elbc-ctrl/1: active=1, hb_count=14405
ELBC mgmt devs:
elbc-base-ctrl: mgmtip_set=1

zone: self_idx:2, master_idx:1, members:3
FPC6KFT0<REMOVED>, Slave, uptime=14406.89, priority=16, slot_id=1:1, idx=2, flag=0x4, in_sync=1
F6KF30<REMOVED>, Slave, uptime=13634.30, priority=3, slot_id=2:0, idx=0, flag=0x10, in_sync=1
elbc-base-ctrl: state=3(connected), ip=169.254.1.115, last_hb_time=1634388.22, hb_nr=65505
F6KF30<REMOVED>, Master, uptime=14403.12, priority=1, slot_id=1:0, idx=1, flag=0x10, in_sync=1
elbc-base-ctrl: state=3(connected), ip=169.254.1.15, last_hb_time=1634388.26, hb_nr=69222

==========================================================================
Slot: 2 Module SN: FPC6KFT0<REMOVED>
ELBC: svcgrp_id=1, chassis=1, slot_id=2
ELBC HB devs:
elbc-ctrl/1: active=1, hb_count=14405
ELBC mgmt devs:
elbc-base-ctrl: mgmtip_set=1

zone: self_idx:2, master_idx:1, members:3
FPC6KFT0<REMOVED>, Slave, uptime=14406.37, priority=17, slot_id=1:2, idx=2, flag=0x4, in_sync=1
F6KF30<REMOVED>, Slave, uptime=13634.30, priority=3, slot_id=2:0, idx=0, flag=0x10, in_sync=1
elbc-base-ctrl: state=3(connected), ip=169.254.1.115, last_hb_time=1634326.46, hb_nr=65505
F6KF30<REMOVED>, Master, uptime=14403.12, priority=1, slot_id=1:0, idx=1, flag=0x10, in_sync=1
elbc-base-ctrl: state=3(connected), ip=169.254.1.15, last_hb_time=1634326.50, hb_nr=69222
UPDATED 20190603-2209
When running the diag sys confsync status it will show you all the blades, however the last line of the output, compares all blades to the master
MBD SN: F6KF30<REMOVED>
ELBC: svcgrp_id=1, chassis=1, slot_id=0

zone: self_idx:1, master_idx:1, members:14
F6KF30<REMOVED>, Master, uptime=14403.12, priority=1, slot_id=1:0, idx=1, flag=0x10, in_sync=1
F6KF30<REMOVED>, Slave, uptime=13634.30, priority=3, slot_id=2:0, idx=0, flag=0x10, in_sync=1
elbc-base-ctrl: state=3(connected), ip=169.254.1.115, last_hb_time=1634141.97, hb_nr=65505
If the Fortigates were NOT in sync, they would show in_sync=0
Thank you Wei Ling Neo for the information on the last update.
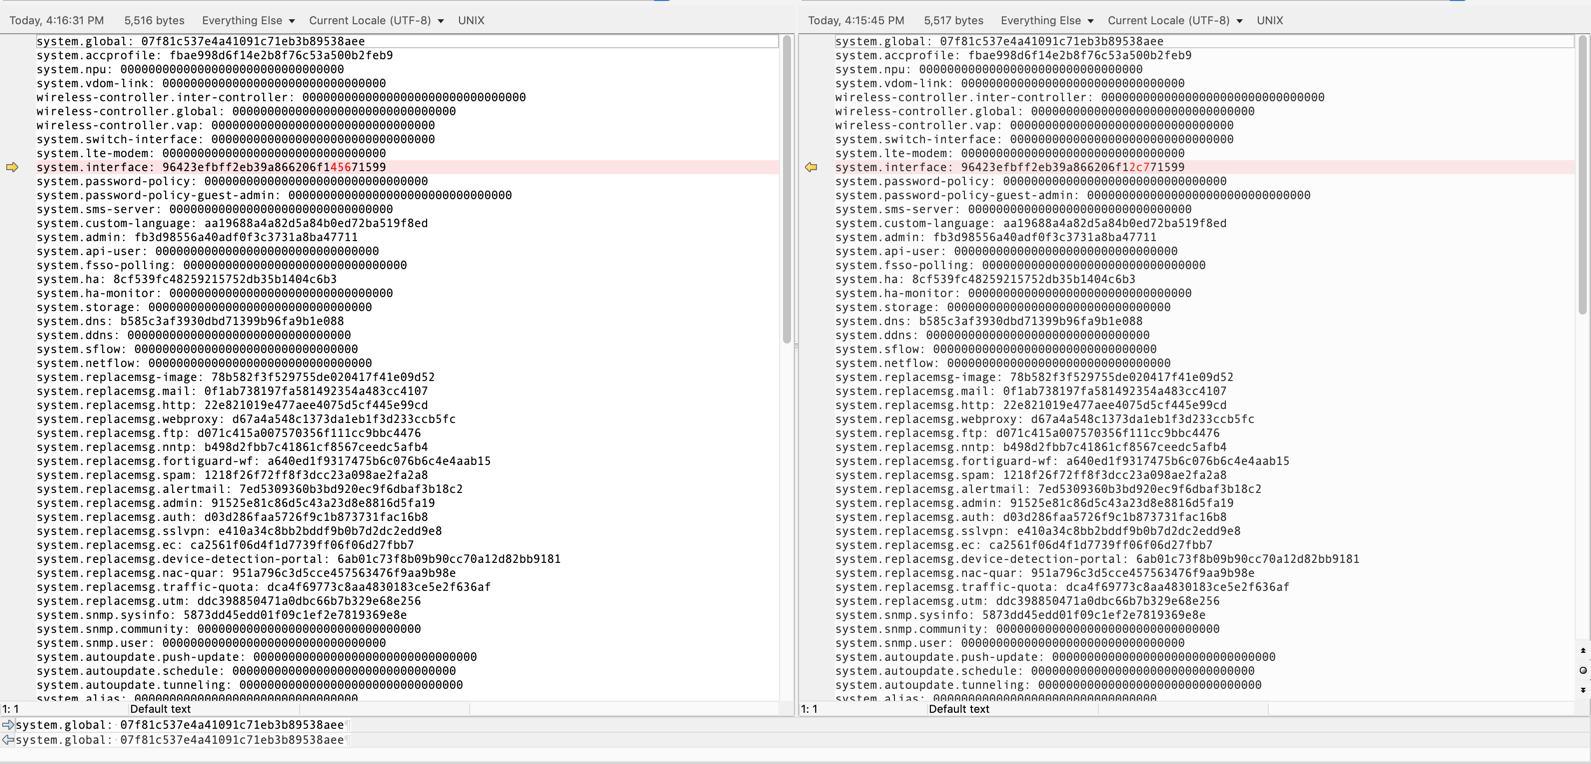
To show the changes, I edited an interface’s alias and saved the config. You can see that the first section shows the complete config NOT in sync, while the second section shows all in sync. Pay particular attention to the in_sync=0 and in_sync=1 in the output
==========================================================================
MBD SN: F6KF30T0XXXXXX38
ELBC: svcgrp_id=1, chassis=1, slot_id=0

zone: self_idx:1, master_idx:1, members:14
F6KF30T0XXXXXX38, Master, uptime=3385497.02, priority=1, slot_id=1:0, idx=1, flag=0x10, in_sync=1
F6KF30T0XXXXXX31, Slave, uptime=2712.84, priority=3, slot_id=2:0, idx=0, flag=0x10, in_sync=1
elbc-base-ctrl: state=3(connected), ip=169.254.1.115, last_hb_time=5005235.91, hb_nr=4021
FPC6KFT0XXXXXX88, Slave, uptime=3386086.26, priority=18, slot_id=1:3, idx=2, flag=0x24, in_sync=1
elbc-base-ctrl: state=3(connected), ip=169.254.1.5, last_hb_time=5005235.91, hb_nr=16216163
FPC6KFT0XXXXXX91, Slave, uptime=3386045.32, priority=21, slot_id=1:6, idx=3, flag=0x24, in_sync=1
elbc-base-ctrl: state=3(connected), ip=169.254.1.8, last_hb_time=5005235.96, hb_nr=16215556
FPC6KFT0XXXXXX92, Slave, uptime=3386049.03, priority=19, slot_id=1:4, idx=4, flag=0x24, in_sync=0
elbc-base-ctrl: state=3(connected), ip=169.254.1.6, last_hb_time=5005236.09, hb_nr=16215798
FPC6KFT0XXXXXX93, Slave, uptime=3386017.03, priority=20, slot_id=1:5, idx=5, flag=0x24, in_sync=1
elbc-base-ctrl: state=3(connected), ip=169.254.1.7, last_hb_time=5005236.06, hb_nr=16215854
FPC6KFT0XXXXXX32, Slave, uptime=3385995.41, priority=16, slot_id=1:1, idx=6, flag=0x24, in_sync=1
elbc-base-ctrl: state=3(connected), ip=169.254.1.3, last_hb_time=5005235.91, hb_nr=16215659
FPC6KFT0XXXXXX34, Slave, uptime=3385867.84, priority=17, slot_id=1:2, idx=7, flag=0x24, in_sync=0
elbc-base-ctrl: state=3(connected), ip=169.254.1.4, last_hb_time=5005235.96, hb_nr=16214512
FPC6KFT0XXXXXX68, Slave, uptime=2651.31, priority=120, slot_id=2:5, idx=8, flag=0x24, in_sync=0
elbc-base-ctrl: state=3(connected), ip=169.254.1.107, last_hb_time=5005235.91, hb_nr=4021
FPC6KFT0XXXXXX69, Slave, uptime=2651.17, priority=121, slot_id=2:6, idx=9, flag=0x24, in_sync=0
elbc-base-ctrl: state=3(connected), ip=169.254.1.108, last_hb_time=5005235.91, hb_nr=4026
FPC6KFT0XXXXXX71, Slave, uptime=2650.58, priority=119, slot_id=2:4, idx=10, flag=0x24, in_sync=0
elbc-base-ctrl: state=3(connected), ip=169.254.1.106, last_hb_time=5005236.06, hb_nr=4032
FPC6KFT0XXXXXX72, Slave, uptime=2652.17, priority=118, slot_id=2:3, idx=11, flag=0x24, in_sync=0
elbc-base-ctrl: state=3(connected), ip=169.254.1.105, last_hb_time=5005235.91, hb_nr=4030
FPC6KFT0XXXXXX28, Slave, uptime=2651.72, priority=116, slot_id=2:1, idx=12, flag=0x24, in_sync=0
elbc-base-ctrl: state=3(connected), ip=169.254.1.103, last_hb_time=5005235.96, hb_nr=4030
FPC6KFT0XXXXXX29, Slave, uptime=2652.27, priority=117, slot_id=2:2, idx=13, flag=0x24, in_sync=0
elbc-base-ctrl: state=3(connected), ip=169.254.1.104, last_hb_time=5005236.09, hb_nr=4029


F6KF30T0XXXXXX38 (root) # diag sys confsync status


ELBC: svcgrp_id=1, chassis=1, slot_id=0

zone: self_idx:1, master_idx:1, members:14
F6KF30T0XXXXXX38, Master, uptime=3385504.79, priority=1, slot_id=1:0, idx=1, flag=0x10, in_sync=1
F6KF30T0XXXXXX31, Slave, uptime=2720.58, priority=3, slot_id=2:0, idx=0, flag=0x10, in_sync=1
elbc-base-ctrl: state=3(connected), ip=169.254.1.115, last_hb_time=5005243.64, hb_nr=4058
FPC6KFT0XXXXXX88, Slave, uptime=3386094.00, priority=18, slot_id=1:3, idx=2, flag=0x24, in_sync=1
elbc-base-ctrl: state=3(connected), ip=169.254.1.5, last_hb_time=5005243.64, hb_nr=16216200
FPC6KFT0XXXXXX91, Slave, uptime=3386053.04, priority=21, slot_id=1:6, idx=3, flag=0x24, in_sync=1
elbc-base-ctrl: state=3(connected), ip=169.254.1.8, last_hb_time=5005243.68, hb_nr=16215593
FPC6KFT0XXXXXX92, Slave, uptime=3386056.58, priority=19, slot_id=1:4, idx=4, flag=0x24, in_sync=1
elbc-base-ctrl: state=3(connected), ip=169.254.1.6, last_hb_time=5005243.64, hb_nr=16215834
FPC6KFT0XXXXXX93, Slave, uptime=3386024.56, priority=20, slot_id=1:5, idx=5, flag=0x24, in_sync=1
elbc-base-ctrl: state=3(connected), ip=169.254.1.7, last_hb_time=5005243.58, hb_nr=16215890
FPC6KFT0XXXXXX32, Slave, uptime=3386003.15, priority=16, slot_id=1:1, idx=6, flag=0x24, in_sync=1
elbc-base-ctrl: state=3(connected), ip=169.254.1.3, last_hb_time=5005243.64, hb_nr=16215696
FPC6KFT0XXXXXX34, Slave, uptime=3385875.56, priority=17, slot_id=1:2, idx=7, flag=0x24, in_sync=1
elbc-base-ctrl: state=3(connected), ip=169.254.1.4, last_hb_time=5005243.68, hb_nr=16214549
FPC6KFT0XXXXXX68, Slave, uptime=2659.08, priority=120, slot_id=2:5, idx=8, flag=0x24, in_sync=1
elbc-base-ctrl: state=3(connected), ip=169.254.1.107, last_hb_time=5005243.68, hb_nr=4058
FPC6KFT0XXXXXX69, Slave, uptime=2658.91, priority=121, slot_id=2:6, idx=9, flag=0x24, in_sync=1
elbc-base-ctrl: state=3(connected), ip=169.254.1.108, last_hb_time=5005243.64, hb_nr=4063
FPC6KFT0XXXXXX71, Slave, uptime=2658.11, priority=119, slot_id=2:4, idx=10, flag=0x24, in_sync=1
elbc-base-ctrl: state=3(connected), ip=169.254.1.106, last_hb_time=5005243.58, hb_nr=4068
FPC6KFT0XXXXXX72, Slave, uptime=2659.90, priority=118, slot_id=2:3, idx=11, flag=0x24, in_sync=1
elbc-base-ctrl: state=3(connected), ip=169.254.1.105, last_hb_time=5005243.64, hb_nr=4067
FPC6KFT0XXXXXX28, Slave, uptime=2659.44, priority=116, slot_id=2:1, idx=12, flag=0x24, in_sync=1
elbc-base-ctrl: state=3(connected), ip=169.254.1.103, last_hb_time=5005243.68, hb_nr=4067
FPC6KFT0XXXXXX29, Slave, uptime=2659.82, priority=117, slot_id=2:2, idx=13, flag=0x24, in_sync=1
elbc-base-ctrl: state=3(connected), ip=169.254.1.104, last_hb_time=5005243.64, hb_nr=4065

F6KF30T0XXXXXX38 (root) #
Rebooting HA Pair
exe ha man <ID>
exe reboot
Then run the exec reboot on the master.
Recent posts
-

-

DNS is one of those technologies that quietly underpins... Full Story
-

BGP issues on FortiGate firewalls usually trace back to... Full Story
-

Every time your laptop talks to your router, a... Full Story
-

If you've spent any time configuring NAT on a... Full Story
-

If you have spent any time configuring firewall policies... Full Story
-

High availability on FortiGate is one of those features... Full Story
-

If you've configured SD-WAN on a FortiGate, you've almost... Full Story
-

FortiLink is the management protocol that turns a FortiSwitch... Full Story
-

FortiSwitches are pretty rock solid from Mean Time Between... Full Story
-

This is a quicky tip. Have you ever gone... Full Story
-

DNS is one of those quiet pieces of internet... Full Story
-

This article is an updated version of the previous... Full Story
-

You will add ns2 as a secondary (slave) BIND9... Full Story
-

In the process of deploying my lab, I needed... Full Story
-

RFC 8805, used to be known as Self-Correcting IP... Full Story
-

Years back, I wrote an article about certificate pinning. ... Full Story
-

FortiGates have the ability to send alerts to Microsoft... Full Story
-

In this post, I am going to walk through... Full Story
-

Troubleshooting VoIP on a FortiGate can feel like trying... Full Story
-

Prior to FortiOS 7.0, there were three commands to... Full Story
-

In this post, I am going to go over... Full Story
-

What we are going to do: We are going... Full Story
-

Choosing between FGCP (FortiGate Clustering Protocol) and FGSP (FortiGate... Full Story
-

Creating a VLAN on macOS (The "Pro" Move) A... Full Story
-

This blog post explores the logic behind how macOS... Full Story
-

Pretty Fly for a Wi-Fi Tell My Wi-Fi Love... Full Story
-

Part of my daily gig is creating BoMs (Bill-of-Materials)... Full Story
-

ICMP introduces several security risks, but careful filtering, rate... Full Story
-

The command diag debug application dhcps -1 enables full... Full Story
-

In the world of FortiOS, execute tac report is... Full Story
-

LLDP; What is it The Link Layer Discovery Protocol... Full Story
-

What it actually does When you run diagnose fdsm... Full Story
-

Monkey Bites are bite-sized, high-impact security insights designed for... Full Story
-

I have run macOS in macOS with Parallels but... Full Story
-

Don't be confused with my other FortiNAC posts where... Full Story
-

This is the third session in a multi-part article... Full Story
-

Today I was configuring key-based authentication on a FortiGate... Full Story
-

Netcat, often called the "Swiss Army knife" of networking,... Full Story
-

At its core, IEEE 802.1X is a network layer... Full Story
-

In case you did not see the previous FortiNAC... Full Story
-

This is our 5th session where we are going... Full Story
-

Now that we have Wireshark installed and somewhat configured,... Full Story
-

The Philosophy of Packet Analysis Troubleshooting isn't about looking... Full Story
-

Have you ever wanted to do some testing on... Full Story
-

Ask ten engineers to define "a network" and you... Full Story
-

1. Executive Summary Objective: This guide turns a FortiAuthenticator... Full Story