If you've spent any time configuring user authentication on... Full Story
By Manny Fernandez
February 10, 2021

Using WAN Link Monitor for Redundant Internet Connections
First thing I want to mention is that there is other ways of doing multiple ISPs using SD WAN configuration (Included with FortiOS). Depending on the version of FortiOS you are running, the SD WAN features may vary. In 6.4, Fortinet released hundred of new SD WAN feature.
This post is the non-SD WAN configuration using ping to track reachability. For those familiar with Cisco, this feature is similar to SLA in the Cisco world.
Lets get started.
Use Case: Customer has a primary and a backup Internet Service Provider. They want all traffic to egress via port1 (ISP1) and if that fails, they want to use port2 (ISP2).
Note: In my lab, I am using this configuration for my Internet failover.
Static Routes
First lets talk about static routes. In the FortiGate, you can modify the Distance and the Priority. I see this “mistake” often when visiting customers.
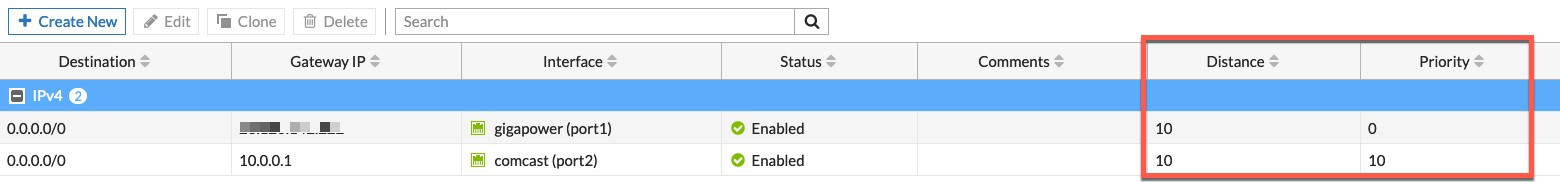
In my example, you can see that the Distance are equal while the Priority are different. If you have a higher distance on your secondary ISP, any VIPs you have defined for that ISP, will not be available until such time as ISP2 becomes the preferred route.
So lets elaborate. If I have a VIP set up for ISP2, and lets say I am Old School and I am running email internally. Normally, you would have two MX (Mail Exchange) records configured on your DNS server. Regardless of the preference of the MX records, the sender may choose either one. That is, if your primary MX IP is not responding for whatever reason, the sender may choose to use the secondary MX. This is a trick old SPAM’ers use to use to try and bypass anti-SPAM solutions that may not have been configured to handle mail on the secondary ISP.
If you have a loaded distance on the secondary ISP, those connection would not work. This is similar for remote management of the FortiGate from the outside world. With the same distance, you will be able to hit any of the management IPs regardless of the preferred route.
WAN Link Monitor
The proposed goal for this config is to ping 4.2.2.2 from port1 (ISP1) and if that ping experiences 5 losses, it will consider ISP1 down. Since my firewall is plugged into a device (modem/router) via Ethernet port, that interface will always be considered as UP unless your router/modem is shut off or cable is disconnected. This is not a valid way of addressing reachability. Your ISP may have experienced a fiber cut up stream that affects outbound Internet as an example. In this scenario, your firewall would not know that the Internet is not passing traffic.
NOTE: If your ISP router/modem is sending you a default route or a/multi prefixes, then this may not be the case. In this exception, the ISP would be sending you a route based on its knowledge of the backend network (its connectivity to the Internet). With this type of configuration, the default route handed to you via BGP (as the ISP preferred method) would disappear from the FortiGate’s routing table leaving you with the secondary ISP route.
You will need to access the CLI for this configuration.

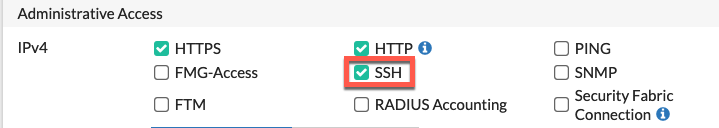
You can access it via the GUI (this is version 6.4x so on earlier FortiOS, it will look different) or via an SSH session. If you use the latter, ensure you have ssh allowed in the Administrative Access under the physical interface, VLAN interface or SSID depending on how you are accessing the FortiGate.
Once you are in the CLI, you will need to type the following:
config system link-monitor
and hit enter.
We are going to create a name for this link-monitor. Something descriptive like wan-link-isp1
edit wan-link-isp1
Once inside of the wan-link-isp1 configuration, you will need to fill in the following:
 set addr-mode ipv4
set srcintf "port1"
set server "4.2.2.2"
set protocol ping
set gateway-ip 23.X.X.X
set source-ip 23.X.X.Y
set interval 500
set probe-timeout 500
set failtime 5
set recoverytime 5
set probe-count 30
set ha-priority 1
set update-static-route enable
set status enable
next
In my case,
- I am using the source interface (
srcintf) asport1. - The server is
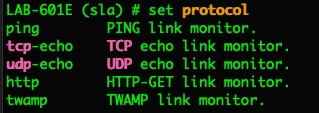
4.2.2.2which is what I am going to be pinging to test reachability to the Internet. DO NOT USE THE ISPs BACKBONE ROUTER. Use something passed the ISPs network like8.8.8.8or something similar. - The protocols is going to be
pingas in ICMP.
- Gateway IP is the
default gatewayfor ISP1 (in my case, connected to port`) - Source IP is usually the IP address assigned to
port1(or whatever port you are using for your ISP1). - The other variables allow you to define how many ping drops will consider it as
down and more importantly, how many successful ping should consider the circuit asup. Beware that if this is set too short (even if it is set correctly and your ISP is bouncing), you can run into a situation where you are flapping back and forth because the FortiGate will think the circuit is back up after therecoverytimevariable is hit. Lets say you have this set to 5 but ISP1 is dropping every 6 packets. - Lastly, the
set update static-routeneeds to be set toenablein order for the routes to be updated in the RIB.
With this configuration, there will be a ping every 500ms from the IP address of port1 using the default gateway for ISP1. If I lose 5 pings, the ISP1 route will be removed from the RIB leaving ISP2 as the active default gateway. The pings will continue egressing through port1 and once I have 5 successful pings, the ISP2 route will be removed from the RIB and ISP1 will return to being the active route.
Troubleshooting link-monitor
Now we are going to cover the troubleshooting steps to check on the status of the monitor.
By running a show full command from the config system link-monitor you will be able to see all of your configuration including the default values.
Next we can check the routing table to see which is the active route
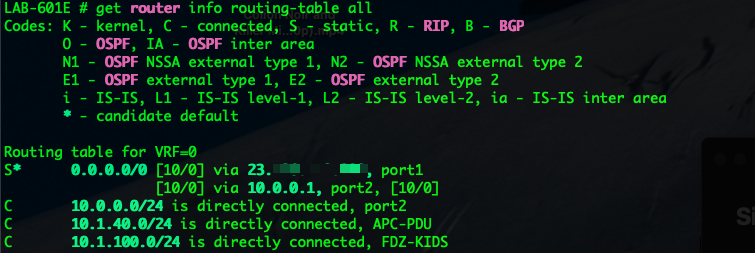
As you can see, my active default route is via port1
Next you can run diagnose sys link-monitor status
--DOWN--
Link Monitor: sla Status: die Create time: Tue Oct 10 12:01:57 2020
Source interface: port1 (7)
Source IP: 23.X.X.Y
Interval: 5, Timeout 1
Fail times: 2/5
Send times: 2
Peer: 4.2.2.2(4.2.2.2)
Source IP(23.X.X.Y)
Route:23.X.X.Y->4.2.2.2/32, gwy(23.X.X.X)
protocol: ping, state: die
Recovery times(0/5)
Continuous sending times after the first recovery time 0
Packet sent: 224, Packet received: 0, Packet lost: 100.000%, Packet sequnece: 224

--UP--
Link Monitor: sla Status: alive Create time: Tue Oct 10 17:37:56 2020
Source interface: port1 (7)
Source IP: 23.X.X.Y
Interval: 5, Timeout 1
Fail times: 0/5
Send times: 0
Peer: 4.2.2.2(4.2.2.2)
Source IP(23.X.X.Y)
Route: 23.X.X.Y->4.2.2.2/32, gwy(23.X.X.X)
protocol: ping, state: alive
Latency: 15.942 ms, Jitter: 17.398
Received times(0)
Continuous sending times after the first recovery time 0
Packet sent: 38016, Packet received: 4801, Packet lost: 0.000%, Packet sequnece: 38016
NOTE: The following is a different firewall that I used to capture the data.
As you can see the Status will tell you if the monitor is alive or die (meaning it is down).
diagnose sys link-monitor interface port1 will show you a summarized view and give you additional information.

UPDATE:
I found that the message that was being received was full of information I did not need. When reviewing the log I identified certain portions I wanted to see.
logid=”0100022922″ type=”event” subtype=”system” level=”notice” vd=”root” logdesc=”Link monitor status” name=”wan-link-phoenix” interface=”phoenix” probeproto=”ping” msg=”Link Monitor changed state from die to alive, protocol: ping.”
The above including the date and time was too much information. By modifying the message body and analyzing the log I was able to pick and choose what I want.
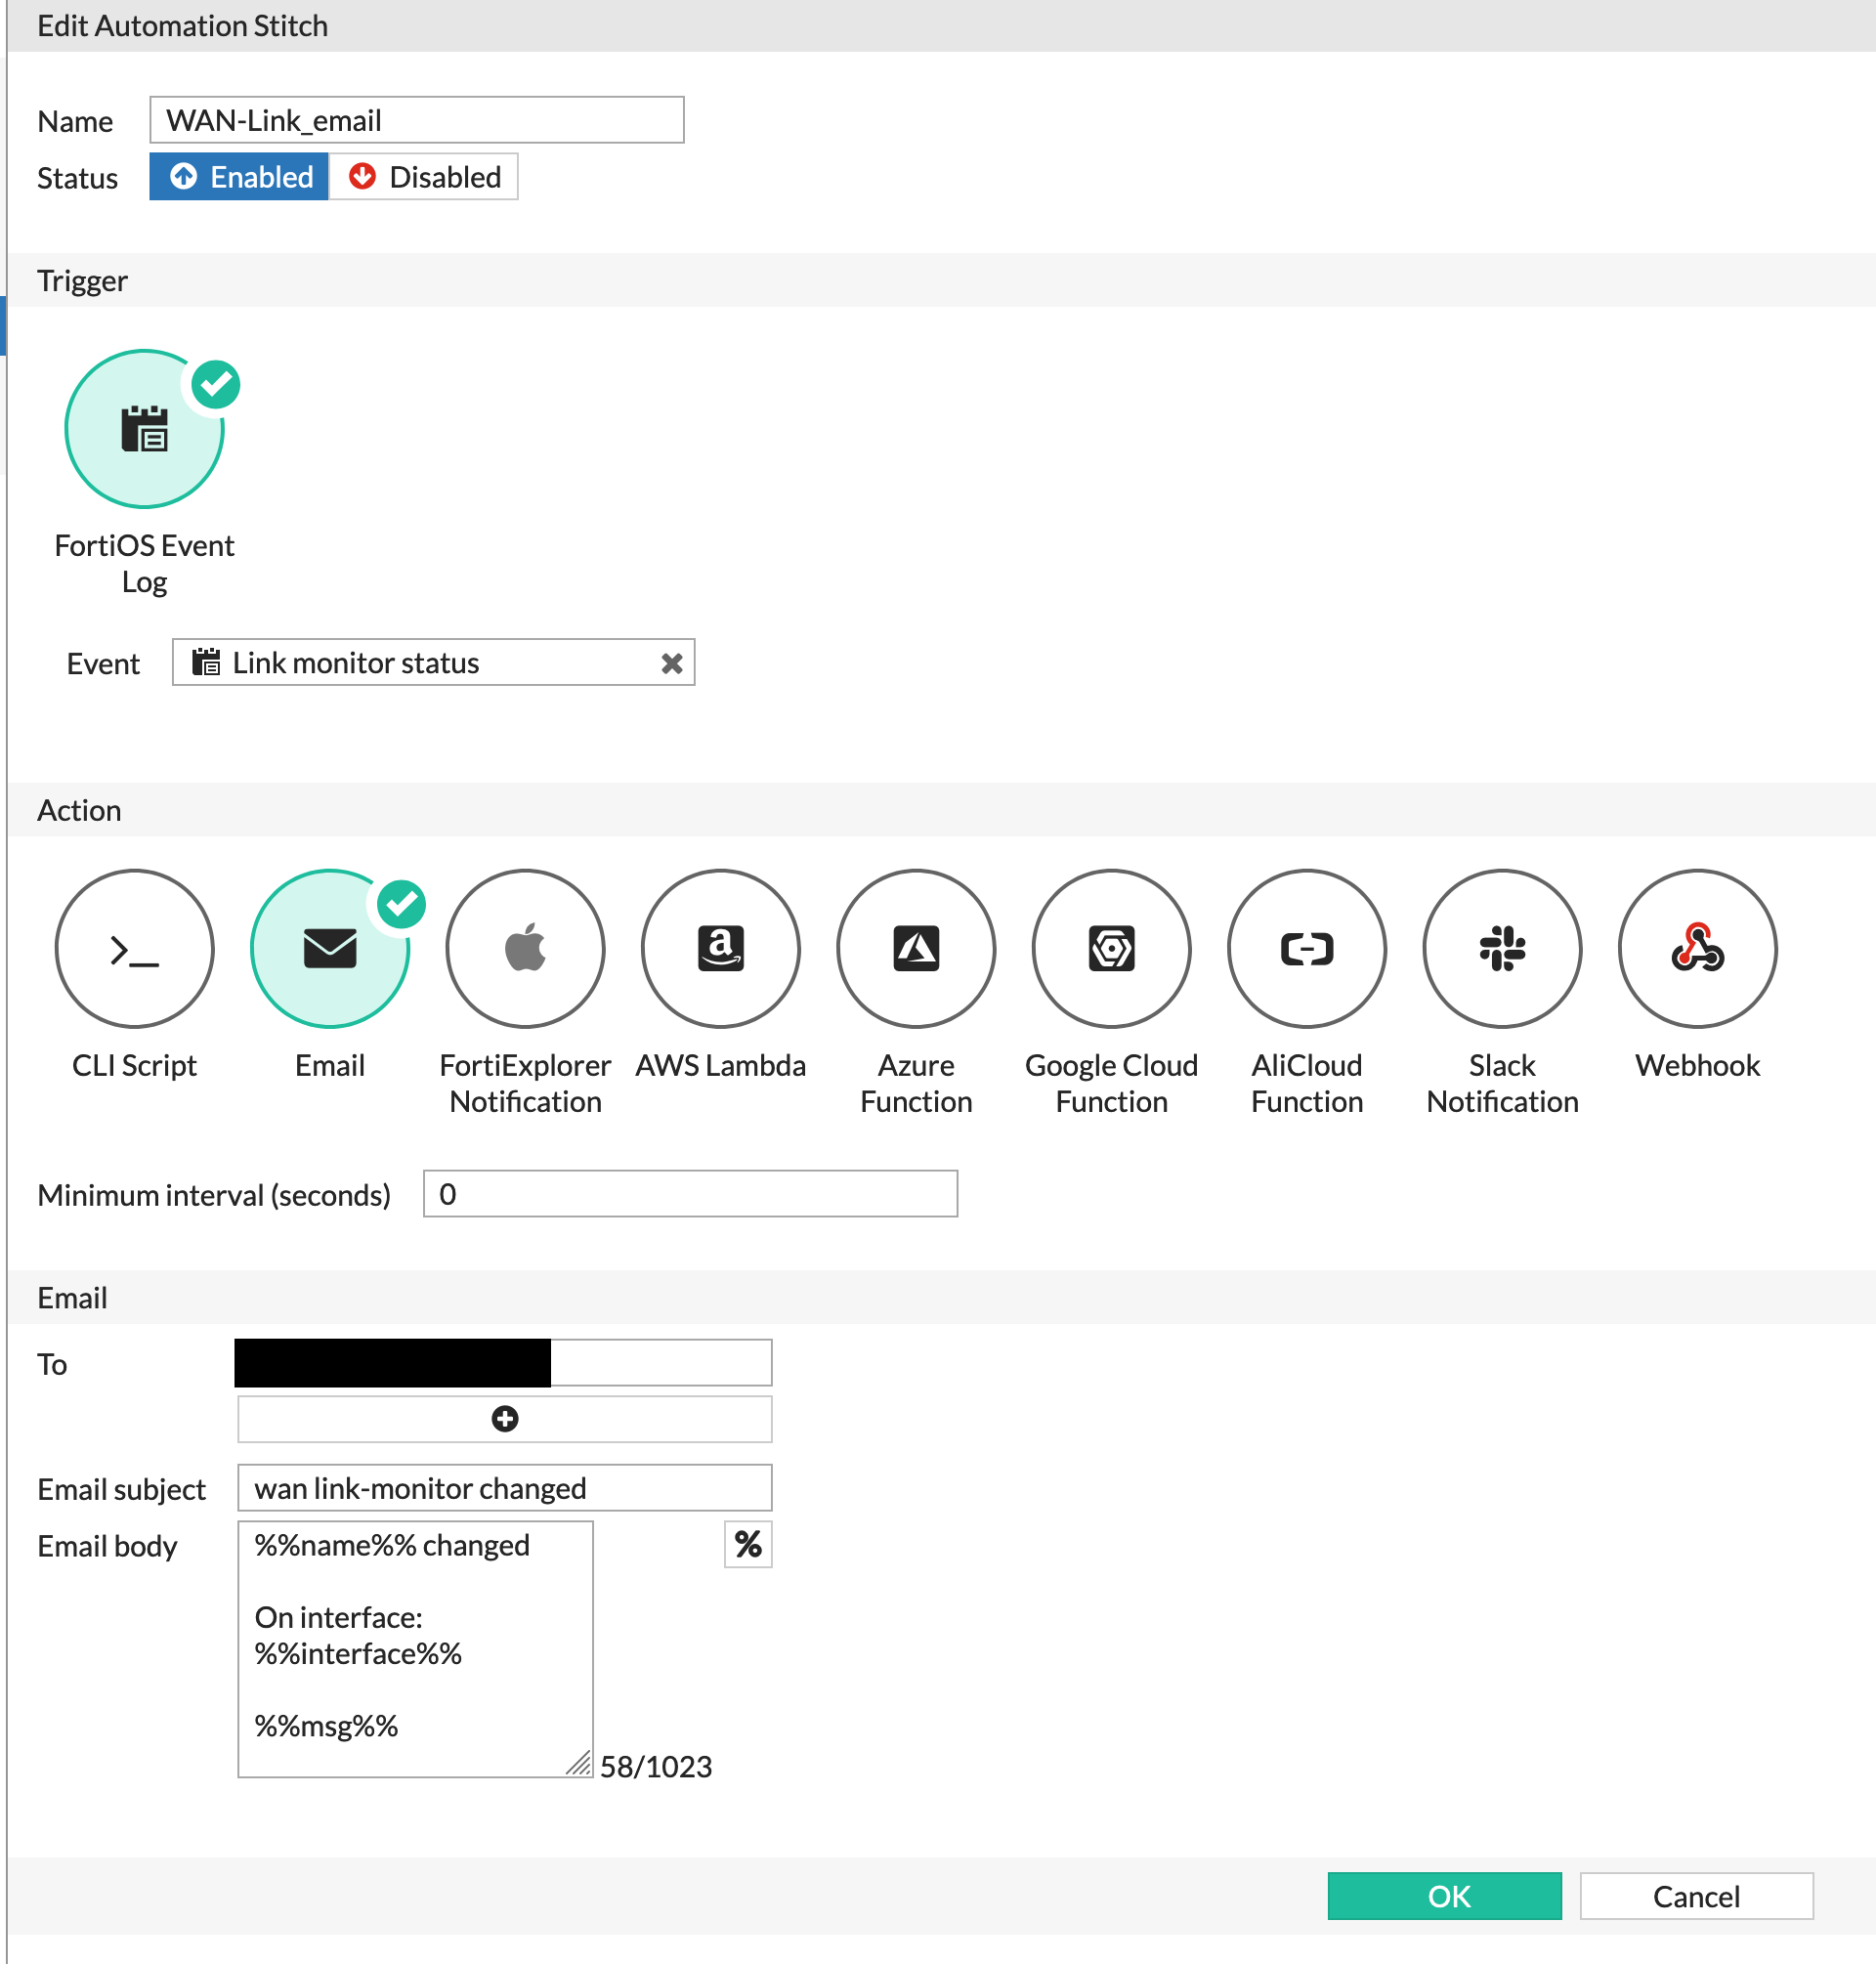
Above you can see how it was modified
%%name%% changed

On interface %%interface%%

%%msg%%
You can match the sections of the log above with what you expect to see.
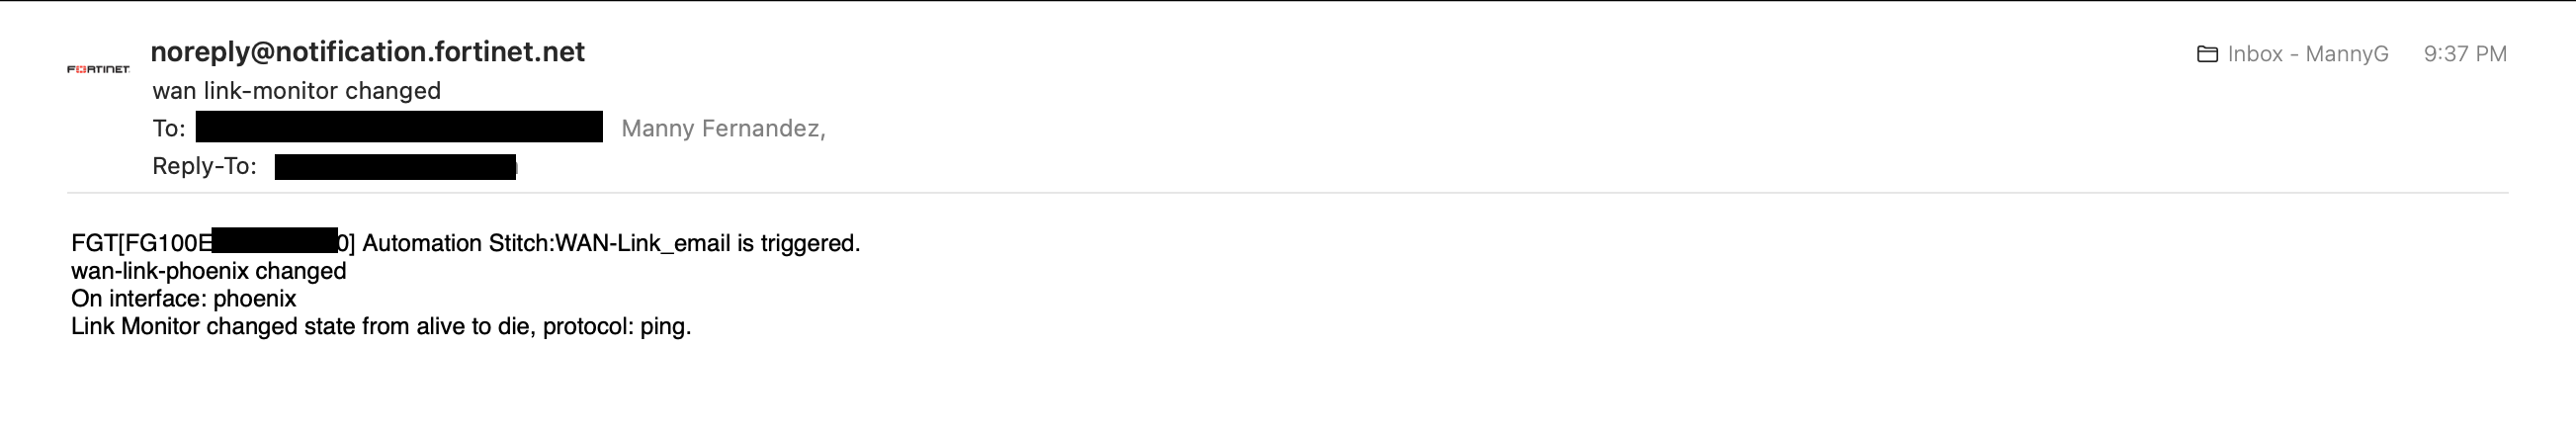
Above we can see the wan link going down.
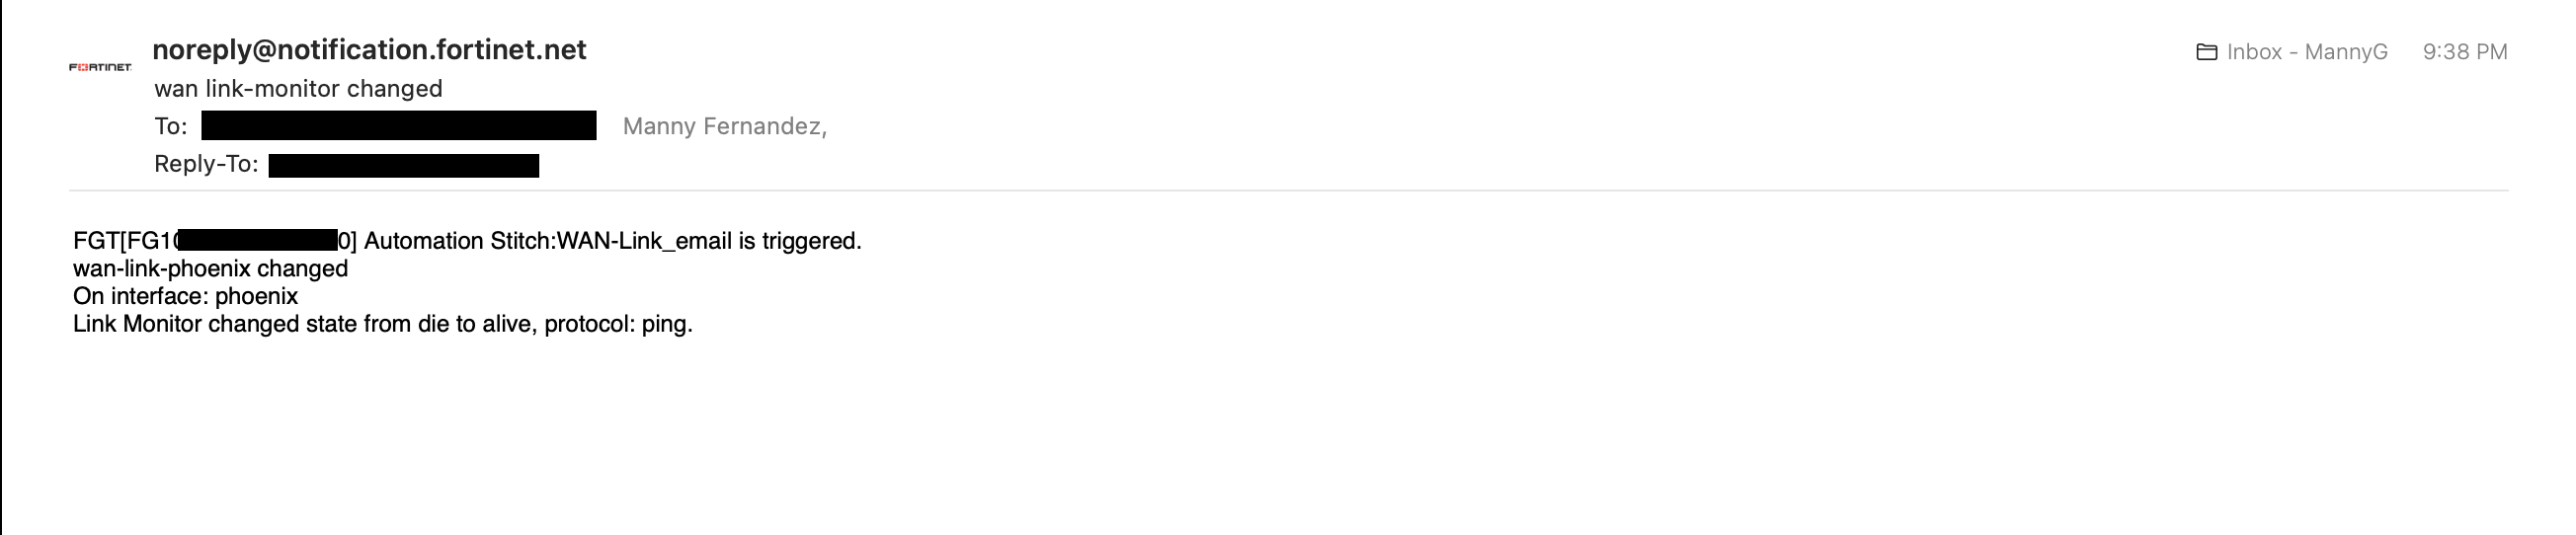
Above we can see the wan link coming back up.
Hope this helps.
Recent posts
-

-

DNS is one of those technologies that quietly underpins... Full Story
-

BGP issues on FortiGate firewalls usually trace back to... Full Story
-

Every time your laptop talks to your router, a... Full Story
-

If you've spent any time configuring NAT on a... Full Story
-

If you have spent any time configuring firewall policies... Full Story
-

High availability on FortiGate is one of those features... Full Story
-

If you've configured SD-WAN on a FortiGate, you've almost... Full Story
-

FortiLink is the management protocol that turns a FortiSwitch... Full Story
-

FortiSwitches are pretty rock solid from Mean Time Between... Full Story
-

This is a quicky tip. Have you ever gone... Full Story
-

DNS is one of those quiet pieces of internet... Full Story
-

This article is an updated version of the previous... Full Story
-

You will add ns2 as a secondary (slave) BIND9... Full Story
-

In the process of deploying my lab, I needed... Full Story
-

RFC 8805, used to be known as Self-Correcting IP... Full Story
-

Years back, I wrote an article about certificate pinning. ... Full Story
-

FortiGates have the ability to send alerts to Microsoft... Full Story
-

In this post, I am going to walk through... Full Story
-

Troubleshooting VoIP on a FortiGate can feel like trying... Full Story
-

Prior to FortiOS 7.0, there were three commands to... Full Story
-

In this post, I am going to go over... Full Story
-

What we are going to do: We are going... Full Story
-

Choosing between FGCP (FortiGate Clustering Protocol) and FGSP (FortiGate... Full Story
-

Creating a VLAN on macOS (The "Pro" Move) A... Full Story
-

This blog post explores the logic behind how macOS... Full Story
-

Pretty Fly for a Wi-Fi Tell My Wi-Fi Love... Full Story
-

Part of my daily gig is creating BoMs (Bill-of-Materials)... Full Story
-

ICMP introduces several security risks, but careful filtering, rate... Full Story
-

The command diag debug application dhcps -1 enables full... Full Story
-

In the world of FortiOS, execute tac report is... Full Story
-

LLDP; What is it The Link Layer Discovery Protocol... Full Story
-

What it actually does When you run diagnose fdsm... Full Story
-

Monkey Bites are bite-sized, high-impact security insights designed for... Full Story
-

I have run macOS in macOS with Parallels but... Full Story
-

Don't be confused with my other FortiNAC posts where... Full Story
-

This is the third session in a multi-part article... Full Story
-

Today I was configuring key-based authentication on a FortiGate... Full Story
-

Netcat, often called the "Swiss Army knife" of networking,... Full Story
-

At its core, IEEE 802.1X is a network layer... Full Story
-

In case you did not see the previous FortiNAC... Full Story
-

This is our 5th session where we are going... Full Story
-

Now that we have Wireshark installed and somewhat configured,... Full Story
-

The Philosophy of Packet Analysis Troubleshooting isn't about looking... Full Story
-

You have twenty years of muscle memory. You type... Full Story
-

I deployed thousands of ASA firewalls when I was... Full Story
-

Have you ever wanted to do some testing on... Full Story