I have run macOS in macOS with Parallels but... Full Story
By Manny Fernandez
June 8, 2019

Useful Fortiswitch CLI commands and settings
So I “grew up” on the Cisco CLI. Later moved to Linux and loved it. I am now on a MacBook and find myself shelling out to do things faster. Recently I was working with a customer that had deployed some Fortiswitches and we were trying to identify some devices and where they were connected. I struggled because I did not know the commands. I am going to share them with you in hopes you do not run into the same issues I did. The ordeal lead me down a discovery road to try to get the tools I need on a regular basis to get things done. This is based on a Fortiswitch, attached to a Fortigate via Fortilink.
Monitoring Fortiswitch Up/Down Ports
In the Cisco world, you can do a ‘term mon’ and unplug and plug devices in and see what port goes up or down. I did not know how to do this in the Fortiswitch until now.
exec log
This is the main command. We are going to build on it. Lets say you want to monitor the ports for either up or down you can don this by adding a filter to the output. You do this by adding the field suffix to the command with a one of the field names you can choose from.
exec log filter field status up, down
The above command will filter out the logs that do not match the staus of either up or down. Next we want to show the actual log.
exec log display
Here is the output:
1: 2019-06-07 22:17:16 log_id=0100001401 type=event subtype=link pri=information vd=root unit="primary" switch.physical-port="port1" status="down" msg="primary switch port port1 has gone down"
2: 2019-06-07 22:14:05 log_id=0100001400 type=event subtype=link pri=information vd=root unit="primary" switch.physical-port="port1" status="up" msg="primary switch port port1 has come up"
3: 2019-06-07 22:14:01 log_id=0100001401 type=event subtype=link pri=information vd=root unit="primary" switch.physical-port="port1" status="down" msg="primary switch port port1 has gone down"
4: 2019-06-07 22:13:44 log_id=0100001400 type=event subtype=link pri=information vd=root unit="primary" switch.physical-port="port1" status="up" msg="primary switch port port1 has come up"
5: 2019-06-07 22:09:57 log_id=0100001401 type=event subtype=link pri=information vd=root unit="primary" switch.physical-port="port1" status="down" msg="primary switch port port1 has gone down"
6: 1969-12-31 19:01:09 log_id=0100001400 type=event subtype=link pri=information vd=root unit="primary" switch.physical-port="port1" status="up" msg="primary switch port port1 has come up"
7: 1969-12-31 19:01:06 log_id=0100001401 type=event subtype=link pri=information vd=root unit="primary" switch.physical-port="port1" status="down" msg="primary switch port port1 has gone down"
Filtering out all except spanning-tree events
In this case, we are going to use another field command. This time however it will be the subtype field. We want to see any log entries that pertain to spanning-tree.
exec log filter field subtype spanning_tree
Now you can run the command to show the logs:
exec log display
Here is the output:
1: 2019-06-07 22:17:16 log_id=0105008255 type=event subtype=spanning_tree pri=notice vd=root user="stp_daemon" action=state-change unit="primary" switch.physical-port="port1" instanceid="0" event="state migration" oldstate="forwarding" newstate="discarding" msg="primary port port1 instance 0 changed state from forwarding to discarding"
2: 2019-06-07 22:17:16 log_id=0105008255 type=event subtype=spanning_tree pri=notice vd=root user="stp_daemon" action=role-change unit="primary" switch.physical-port="port1" instanceid="0" event="role migration" oldrole="designated" newrole="disabled" msg="primary port port1 instance 0 changed role from designated to disabled"
3: 2019-06-07 22:14:08 log_id=0105008255 type=event subtype=spanning_tree pri=notice vd=root user="stp_daemon" action=state-change unit="primary" switch.physical-port="port1" instanceid="0" event="state migration" oldstate="discarding" newstate="forwarding" msg="primary port port1 instance 0 changed state from discarding to forwarding"
4: 2019-06-07 22:14:05 log_id=0105008255 type=event subtype=spanning_tree pri=notice vd=root user="stp_daemon" action=role-change unit="primary" switch.physical-port="port1" instanceid="0" event="role migration" oldrole="disabled" newrole="designated" msg="primary port port1 instance 0 changed role from disabled to designated"
5: 2019-06-07 22:14:01 log_id=0105008255 type=event subtype=spanning_tree pri=notice vd=root user="stp_daemon" action=state-change unit="primary" switch.physical-port="port1" instanceid="0" event="state migration" oldstate="forwarding" newstate="discarding" msg="primary port port1 instance 0 changed state from forwarding to discarding"
6: 2019-06-07 22:14:01 log_id=0105008255 type=event subtype=spanning_tree pri=notice vd=root user="stp_daemon" action=role-change unit="primary" switch.physical-port="port1" instanceid="0" event="role migration" oldrole="designated" newrole="disabled" msg="primary port port1 instance 0 changed role from designated to disabled"
7: 2019-06-07 22:13:47 log_id=0105008255 type=event subtype=spanning_tree pri=notice vd=root user="stp_daemon" action=state-change unit="primary" switch.physical-port="port1" instanceid="0" event="state migration" oldstate="discarding" newstate="forwarding" msg="primary port port1 instance 0 changed state from discarding to forwarding"
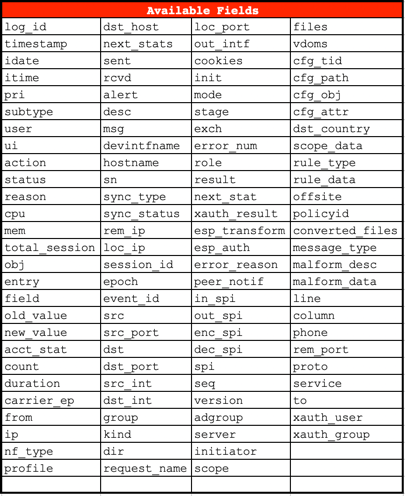
Available fields to be used with various queries:
Displaying the MAC address table of switches
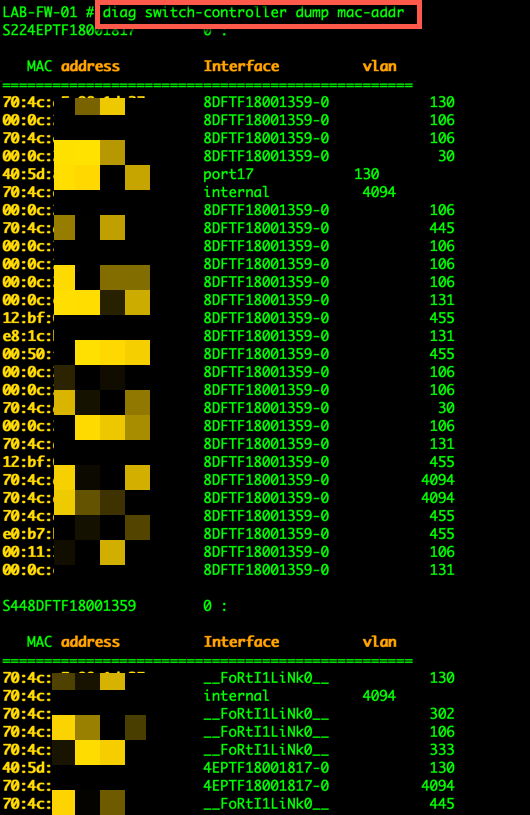
To show all of the MAC addresses attached to your switches you can use the diag command below.
diag switch-controller dump mac-addr
The output will show you all of the MAC addresses attached globally to your switch(s).
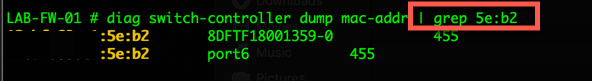
You could also grep your output if you are looking for a particular MAC address
You COULD also narrow it down to the switch level as well. If you do not know the s/n of your switches, you can run the following command:
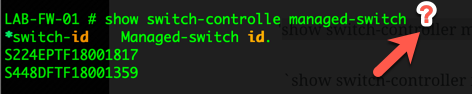
By adding the trailing ? , it will display your switches. You can then use that number in your command:
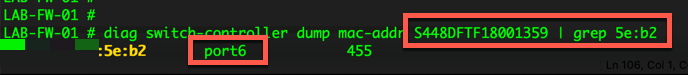
diag switch-controller dump mac-addr S448DFTF18001359 | grep 5e:b2
The above command will check switch S448DFTF18001359 and will grep through the output and only show you MAC addresses containing 5e:b2.
Logging
You can use the following command to enable and disable the managed FortiSwitches to export their syslogs to the FortiGate. The setting is global, and the default setting is enabled . To allow a level of filtering, FortiGate sets the user field to fortiswitch-syslog for each entry.
config switch-controller managed-switch
     edit <switch-id>
          config switch-log
          set local-override enable
      end
Once you set the switch to override, you can set the appropriate log settings for that particular switch:
config switch-controller switch-log
        set status {enable | disable}    #Enable/disable adding FortiSwitch logs to FortiGate event log.
        set severity {option}      #Severity of FortiSwitch logs that are added to the FortiGate event log.
              emergency  - Emergency level.
              alert  - Alert level.
              critical  - Critical level. #Default
              error   - Error level.
              warning  - Warning level.
              notification    -   Notification level.
              information    -   Information level.
              debug    -    Debug level.
          end
If you are running Fortinalyzer, you COULD use the event handler to create a filter based on text and send an alert when it matches that output.
Recent posts
-

-

Don't be confused with my other FortiNAC posts where... Full Story
-

This is the third session in a multi-part article... Full Story
-

Today I was configuring key-based authentication on a FortiGate... Full Story
-

Netcat, often called the "Swiss Army knife" of networking,... Full Story
-

At its core, IEEE 802.1X is a network layer... Full Story
-

In case you did not see the previous FortiNAC... Full Story
-

This is our 5th session where we are going... Full Story
-

Now that we have Wireshark installed and somewhat configured,... Full Story
-

The Philosophy of Packet Analysis Troubleshooting isn't about looking... Full Story