If you've spent any time configuring user authentication on... Full Story
By Manny Fernandez
May 14, 2020

Built-In “IPerf” on the FortiGate Firewall
I happen to love iperf. Iperf is a tool that has been around for a long time. The idea is to create a connection between a device running iperf in client mode to a device running iperf in server mode and test the circuit in a basic way for throughput. This is not an Ixia or a FortiTester but it WILL give you good information. I was involved in the 2012 Presidential debate at Lynn University. AT&T gave me access to a Linux box on their backbone to run iperf and then from inside the campus, I was able to test real bandwidth on the backbone as opposed to using some other speed test site that are not really reliable. I was not aware that FortiOS had iperf3 embedded in it. So I decided to write this article. Actually, a friend and colleague of mine, Brent Klespies turned me on to a feature.
Lets get started.
Installing the IPerf
Since I normally run CentOS for my server-side Linux boxes, I am going to go ahead and install the iperf package using yum however if you are using a different distro, use the package distribution of your choice.
yum install iperf3
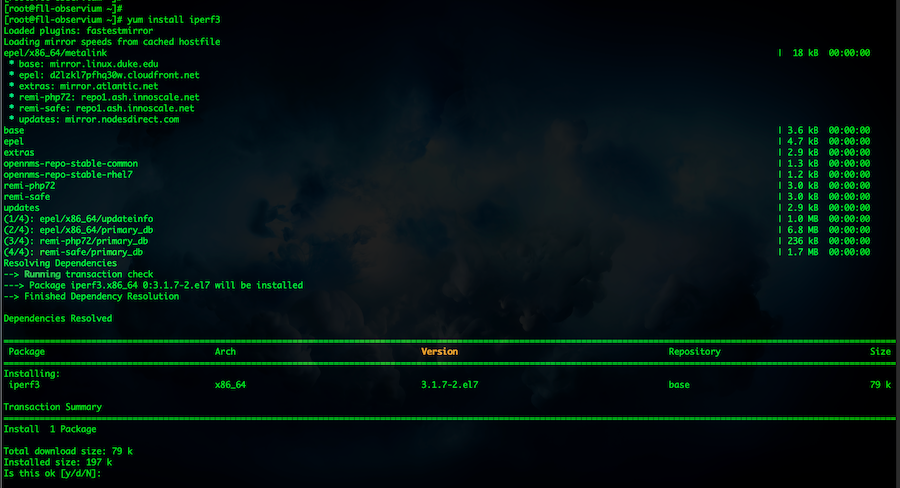
Choose yes when prompted.
Running IPerf as a “server”
Previously, I did an article on iperf however it did not cover the FortiOS.
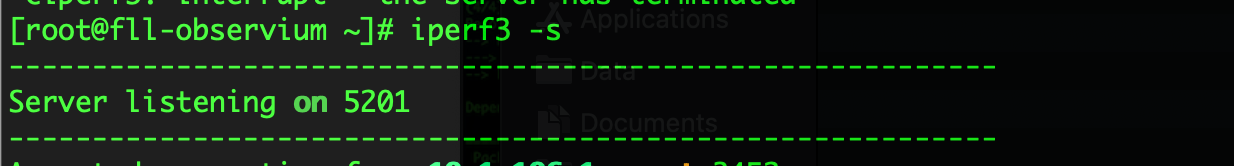
To run the server using its default port number TCP 5120 you can simply run the following:
iperf3 -s
The -s tells the iperf that it will be in server mode.
There are other options specific to the server side of iperf3
      -s, --server
              run in server mode

       -D, --daemon
              run the server in background as a daemon

       -I, --pidfile file
              write a file with the process ID, most useful when running as  a
              daemon.

       -1, --one-off
              handle one client connection, then exit.

       --rsa-private-key-path file
              path  to  the  RSA  private key (not password-protected) used to
              decrypt authentication credentials from  the  client  (if  built
              with OpenSSL support).

       --authorized-users-path file
              path  to the configuration file containing authorized users cre-
              dentials to run iperf tests (if  built  with  OpenSSL  support).
              The  file  is  a  comma separated list of usernames and password
              hashes; more information on the structure of  the  file  can  be
              found in the EXAMPLES section.

       -i  -- interval times

       -p  -- Port number you want to use
Here is an example of using a custom port
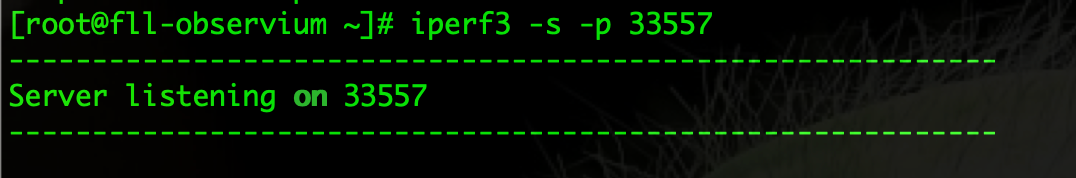
In this example, I am forcing the iperf3 to use the non-standard port of 33557
Configuring the FortiGate side
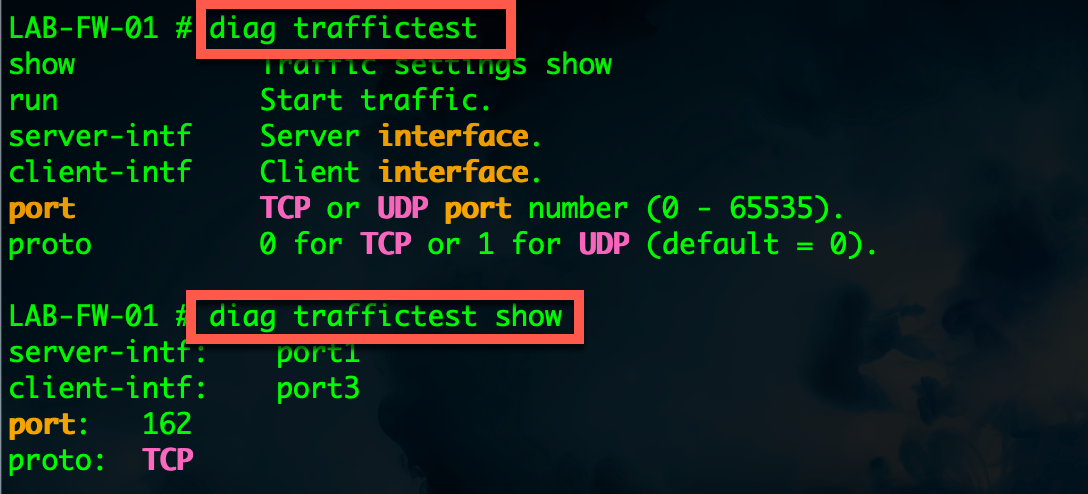
The based command we are going to use is diag traffictest. By using the ? after the base command, you will see the options:
LAB-FW-01 # diag traffictest
show Traffic settings show
run Start traffic.
server-intf Server interface.
client-intf Client interface.
port TCP or UDP port number (0 - 65535).
proto 0 for TCP or 1 for UDP (default = 0).
To set the client-intf use the following command:
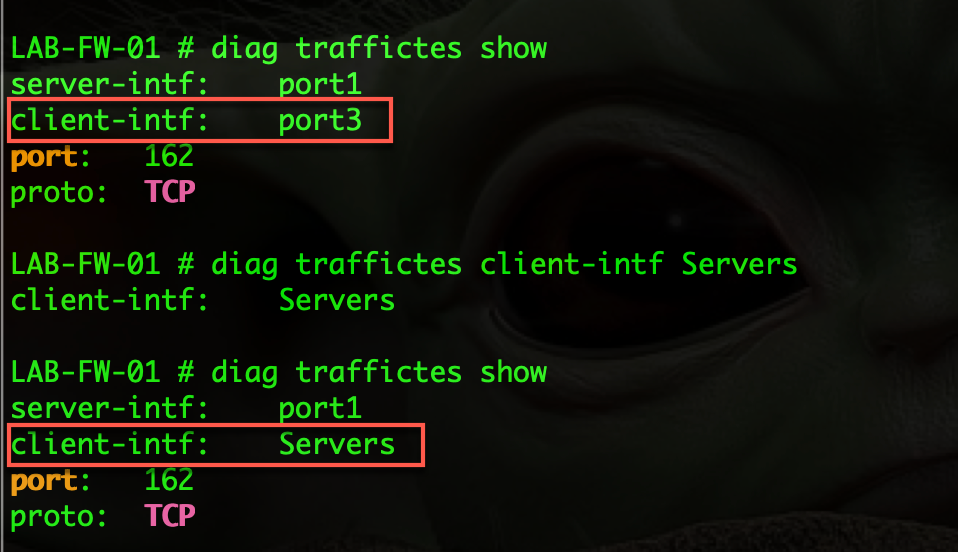
In my case Servers is a Layer 3 VLAN that is attached to my 10.1.106.0/24
To change the port to use, use the following command:
diag traffictest port 5201
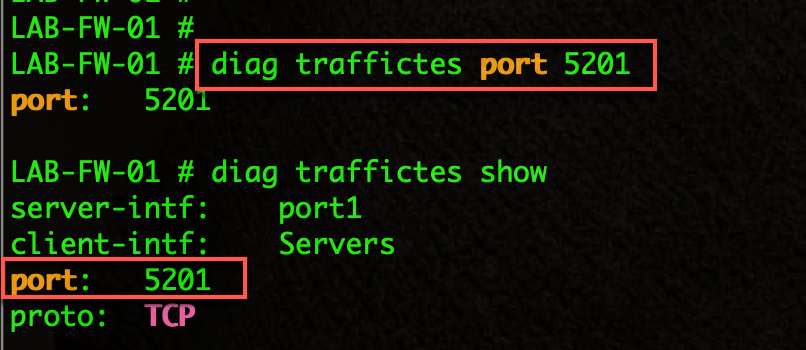
By issuing the diag traffictest show command, we can see that we now have the client-intf set to Servers and the port is set to 5201
Running IPserf as a “client”
Running iperf from the FortiGate is similar to running it from a Linux, Mac or Windows device.
In my case I am going to run diag traffictest run -P 6 -f G -V -c 10.1.106.50
Here are the options which are available for the FortiOS by running diag traffictest run -h
LAB-FW-01 # diag traffictest run
[-h/arg] Help/Multi-Arguments for client

LAB-FW-01 # diag traffictest run -h
-f, --format [kmgKMG] format to report: Kbits, Mbits, KBytes, MBytes
-i, --interval # seconds between periodic bandwidth reports
-F, --file name xmit/recv the specified file
-A, --affinity n/n,m set CPU affinity
-V, --verbose more detailed output
-J, --json output in JSON format
-d, --debug emit debugging output
-v, --version show version information and quit
-h, --help show this message and quit
-b, --bandwidth #[KMG][/#] target bandwidth in bits/sec (0 for unlimited)
(default 1 Mbit/sec for UDP, unlimited for TCP)
(optional slash and packet count for burst mode)
-t, --time # time in seconds to transmit for (default 10 secs)
-n, --bytes #[KMG] number of bytes to transmit (instead of -t)
-k, --blockcount #[KMG] number of blocks (packets) to transmit (instead of -t or -n)
-l, --len #[KMG] length of buffer to read or write
(default 128 KB for TCP, 8 KB for UDP)
-P, --parallel # number of parallel client streams to run
-R, --reverse run in reverse mode (server sends, client receives)
-w, --window #[KMG] TCP window size (socket buffer size)
-C, --linux-congestion <algo> set TCP congestion control algorithm (Linux only)
-M, --set-mss # set TCP maximum segment size (MTU - 40 bytes)
-N, --nodelay set TCP no delay, disabling Nagle's Algorithm
-4, --version4 only use IPv4
-6, --version6 only use IPv6
-S, --tos N set the IP 'type of service'
-L, --flowlabel N set the IPv6 flow label (only supported on Linux)
-Z, --zerocopy use a 'zero copy' method of sending data
-O, --omit N omit the first n seconds
-T, --title str prefix every output line with this string
--get-server-output get results from server

[KMG] indicates options that support a K/M/G suffix for kilo-, mega-, or giga-
The Output
Here are some samples of some output I ran to a Virtual Linux box at 10.1.106.50
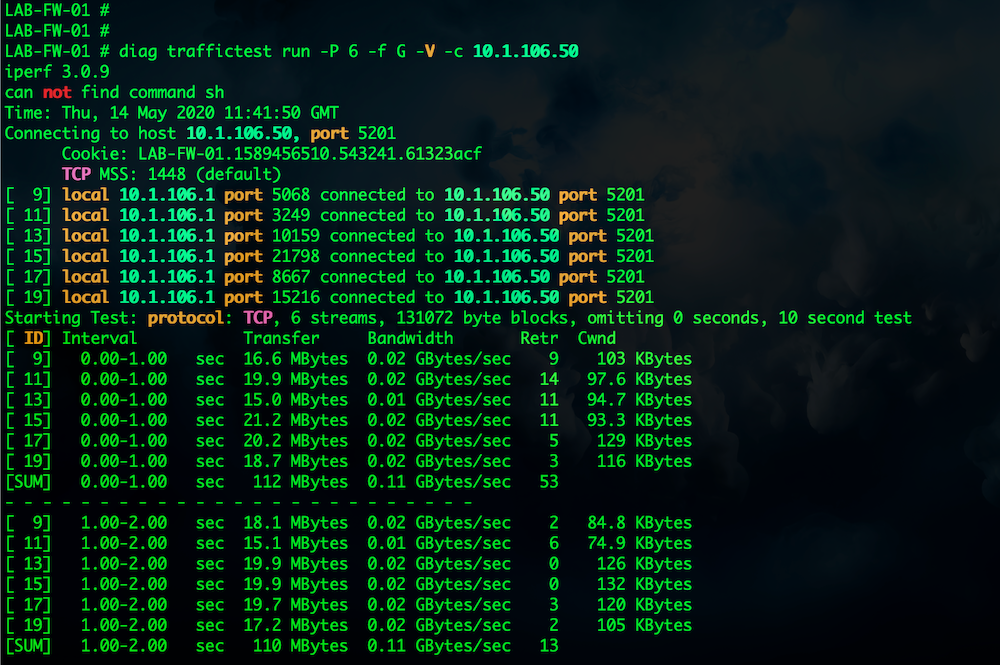
In my client command above, I used 6 parallel streams. Here in the output you can see 6 streams (9,11,13,15,17 & 19) and then the SUM on the bottom of each section shows the aggregate. In my case, 112 Mbytes.
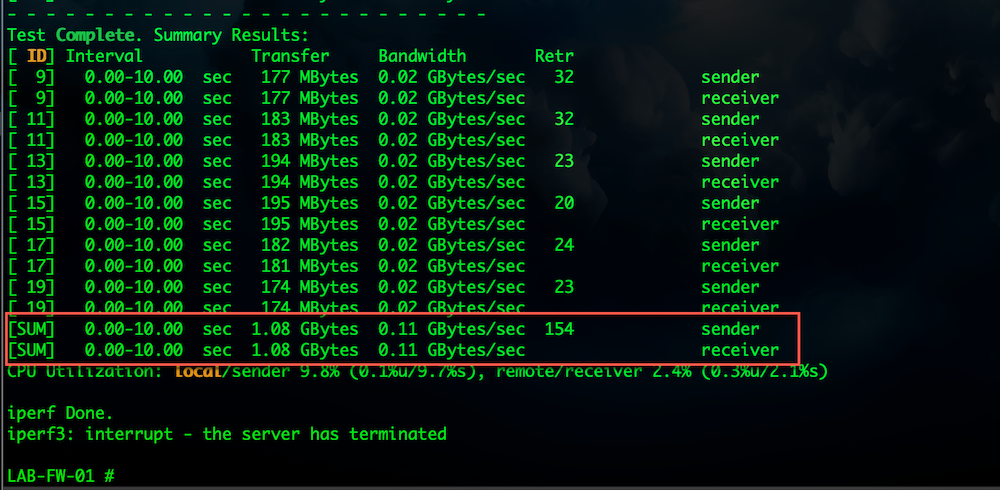
Finally, we see the results of 1.08 GB up and down
Validating Connectivity
If you wanted to make sure the packets are being received on the Linux side, you can run tcpdump using the following command
tcpdump -i ens192 port 5201 -v -nnn NOTE: my interface name is ens192 you may have eth0 or something else.
[root@fll-observium ~]# tcpdump -i ens192 port 5201 -v -nnn
tcpdump: listening on ens192, link-type EN10MB (Ethernet), capture size 262144 bytes
14:35:16.151376 IP (tos 0x0, ttl 64, id 59597, offset 0, flags [none], proto TCP (6), length 60)
10.1.106.1.6346 > 10.1.106.50.5201: Flags [S], cksum 0xf38a (correct), seq 760702769, win 65535, options [mss 1460,sackOK,TS val 8301080 ecr 0,nop,wscale 13], length 0
14:35:16.151433 IP (tos 0x0, ttl 64, id 0, offset 0, flags [DF], proto TCP (6), length 60)
10.1.106.50.5201 > 10.1.106.1.6346: Flags [S.], cksum 0xe863 (incorrect -> 0xf4a8), seq 1028536634, ack 760702770, win 28960, options [mss 1460,sackOK,TS val 834659694 ecr 8301080,nop,wscale 7], length 0
14:35:16.152145 IP (tos 0x0, ttl 64, id 59598, offset 0, flags [none], proto TCP (6), length 52)
10.1.106.1.6346 > 10.1.106.50.5201: Flags [.], cksum 0x947f (correct), ack 1, win 22, options [nop,nop,TS val 8301080 ecr 834659694], length 0
Hope this helps.
Recent posts
-

-

DNS is one of those technologies that quietly underpins... Full Story
-

BGP issues on FortiGate firewalls usually trace back to... Full Story
-

Every time your laptop talks to your router, a... Full Story
-

If you've spent any time configuring NAT on a... Full Story
-

If you have spent any time configuring firewall policies... Full Story
-

High availability on FortiGate is one of those features... Full Story
-

If you've configured SD-WAN on a FortiGate, you've almost... Full Story
-

FortiLink is the management protocol that turns a FortiSwitch... Full Story
-

FortiSwitches are pretty rock solid from Mean Time Between... Full Story
-

This is a quicky tip. Have you ever gone... Full Story
-

DNS is one of those quiet pieces of internet... Full Story
-

This article is an updated version of the previous... Full Story
-

You will add ns2 as a secondary (slave) BIND9... Full Story
-

In the process of deploying my lab, I needed... Full Story
-

RFC 8805, used to be known as Self-Correcting IP... Full Story
-

Years back, I wrote an article about certificate pinning. ... Full Story
-

FortiGates have the ability to send alerts to Microsoft... Full Story
-

In this post, I am going to walk through... Full Story
-

Troubleshooting VoIP on a FortiGate can feel like trying... Full Story
-

Prior to FortiOS 7.0, there were three commands to... Full Story
-

In this post, I am going to go over... Full Story
-

What we are going to do: We are going... Full Story
-

Choosing between FGCP (FortiGate Clustering Protocol) and FGSP (FortiGate... Full Story
-

Creating a VLAN on macOS (The "Pro" Move) A... Full Story
-

This blog post explores the logic behind how macOS... Full Story
-

Pretty Fly for a Wi-Fi Tell My Wi-Fi Love... Full Story
-

Part of my daily gig is creating BoMs (Bill-of-Materials)... Full Story
-

ICMP introduces several security risks, but careful filtering, rate... Full Story
-

The command diag debug application dhcps -1 enables full... Full Story
-

In the world of FortiOS, execute tac report is... Full Story
-

LLDP; What is it The Link Layer Discovery Protocol... Full Story
-

What it actually does When you run diagnose fdsm... Full Story
-

Monkey Bites are bite-sized, high-impact security insights designed for... Full Story
-

I have run macOS in macOS with Parallels but... Full Story
-

Don't be confused with my other FortiNAC posts where... Full Story
-

This is the third session in a multi-part article... Full Story
-

Today I was configuring key-based authentication on a FortiGate... Full Story
-

Netcat, often called the "Swiss Army knife" of networking,... Full Story
-

At its core, IEEE 802.1X is a network layer... Full Story
-

In case you did not see the previous FortiNAC... Full Story
-

This is our 5th session where we are going... Full Story
-

Now that we have Wireshark installed and somewhat configured,... Full Story
-

The Philosophy of Packet Analysis Troubleshooting isn't about looking... Full Story
-

Have you ever wanted to do some testing on... Full Story
-

Ask ten engineers to define "a network" and you... Full Story
-

1. Executive Summary Objective: This guide turns a FortiAuthenticator... Full Story