If you've spent any time configuring user authentication on... Full Story
By Manny Fernandez
February 24, 2021

Quick-Tip : How To Run Sniffer on FortiGate CLI
Quick-Tips are short how to’s to help you out in day-to-day activities. Usually they are quick easy commands to make your day brighter and help you finish up quicker so you can enjoy family, friends, and libations.
In this “Not-So” Quick-Tip, I am going to cover diag sniffer packet . I have been in the networking and security industry for about 29 years as of this writing and I have always lived my a strict motto; and anyone that has worked with me in the past knows this well.
WHEN IN DOUBT….. SNIFF IT OUT!!!!!!
So to me, if you cannot do a packet capture, you are at a huge disadvantage. I will be 100% honest with you. Most of the time I spend “Troubleshooting” it is usually collecting packet captures, debug output, etc to send to the people blaming me for the problem. Once they get the information, I usually do not hear from them again and things just “start working”. Here are some examples.
ASIC Offloading
So the first thing to note is that since FortiGate is such and amazing platform (I know I am biased) and has the advent of ASICs, by default, we do not see the packets that are getting offloaded to the SOC and NOC ASICs. When you are running a capture and are not seeing what you are expecting to see, you may need to disable the offloading on that particular policy.
In my example, I will edit Policy ID 2
LAB-601E # config firewall policy
LAB-601E (policy) # edit 2

set auto-asic-offload
enable Enable auto ASIC offloading.
disable Disable ASIC offloading.
As you can see the options are enable or disable

The other option is to go through the GUI and choose the Policy you want to disable offload on. You can right click and choose Edit in CLI
Sniffer Command
Now we will cover the sniffer command.
diagnose sniffer packet <interface> "<options>" <verbosity level> <count> <timestamp format>
Lets break this down:
diagnose sniffer packet - this is the base command
interface - You can either choose the interface specifically or use the keyword any
options - here you can filter the capture by IP, protocol, etc.
verbosity level - how much information you are collecting (1-6 See below)
count - the number of packets you want to capture (0 = Unlimited)
timestamp - the format of the timestamps on the capture
Here are the verbosity level
1: print header of packets
2: print header and data from ip of packets
3: print header and data from ethernet of packets (if available)
4: print header of packets with interface name
5: print header and data from ip of packets with interface name
6: print header and data from ethernet of packets (if available) with intf name
Examples with Options
Now we are going to add some options so we can see how those command look.
ICMP (Identifying Ping)
diag sniffer packet any "icmp" 4 l 0
ICMP Specifying Host IP
In the above example, I am looking for ONLY ICMP traffic. In my lab, I have a lot of ICMP traffic so I will filter it further and only choose to capture packets destined to 3.210.115.14 (fortinet.com)
diag sniffer packet any "host 3.210.115.14 and icmp" 4 l 0
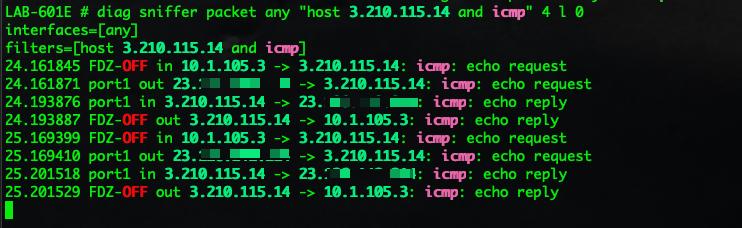
As you can see in the screenshot above, we can see the packet coming in from the FDZ-OFF which is my SSID at home. We then see if egress port1 which is my AT&T Gigapower circuit. You can also see pre and post NAT (Network Address Translation). So you see the packet coming in with a 10.1.105.3 IP address which is what DHCP gave my MacBook Pro. Then when it egresses through port1 we can see that it has NAT’d (source-NAT) the IP to a 23 address.
ICMP (Combining Hosts)
Another thing you can do is combine multiple host commands with an and
diag sniffer packet any "host 3.210.115.14 and host 10.1.105.3 and icmp" 4 l 0
This is helpful when you want to see traffic from a particular set of hosts. NOTE: Anything that matches this filter will be captures. So as an example, If I am pinging 3.210.115.14 from 10.1.105.3 but then from 10.1.105.3 I start to ping 4.2.2.2 that will also be picked up since I am capturing any ICMP from or to any of those two hosts.
Source or Destination
We described the limitations on the previous section. Now lets get laser focussed.
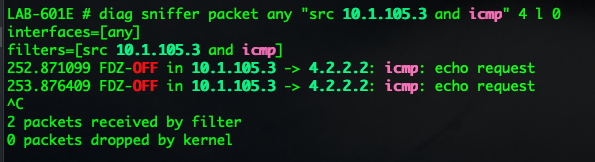
diag sniffer packet any "src 10.1.105.3 and icmp" 4 l 0
With the keyword src we are now saying that ONLY packets that are ICMP and are Sourced from 10.1.105.3 will be captured. This is much easier to troubleshoot because we do not need to collect unnecessary packets. Note: It will ONLY show the outbound traffic since you specified src and once it gets source NAT’d, it will no longer match the filter.
Lets try the same with the dst packet and we will use 8.8.8.8 since no one in my house uses Google for DNS.
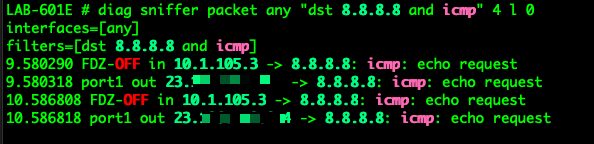
diag sniffer packet any "dst 8.8.8.8 and icmp" 4 l 0
Now in this output, you will see the that we are seeing the in and the out since the destination IP stays the same pre and post NAT.
Other Protocols
Although I am using ICMP as the protocol, you CAN choose to use TCP or UDP as well.
diag sniffer packet any "tcp" 4 l 0
Capturing Based on TCP Flags
A mnemonic sometimes used to remember the TCP Flags is
Unskilled Attackers Pester Real Security Folks
Unskilled - URG
Attackers - ACK
Pester - PSH
Real - RST
Security - SYN
Folks - FIN
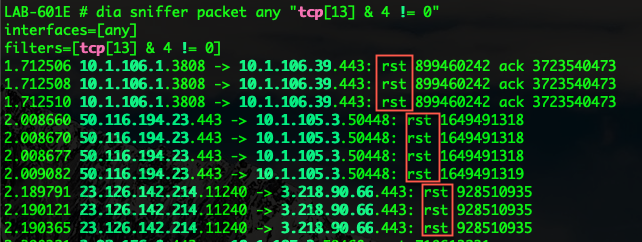
Here is an example of capturing packets that match the RST (Reset)
dia sniffer packet any "tcp[13] & 4 != 0"
Here is an example of capturing packets that match the SYN (SYNchronization)
dia sniffer packet any "tcp[13] & 2 != 0"

Here is an example of capturing packets that match the SYN/ACK (SYNchronization / ACKnowledgement)
dia sniffer packet any "tcp[13] = 18"
Understanding TCP Flags
The filters below find these various packets because tcp[13] looks at offset 13 in the TCP header, the number represents the location within the byte, and the !=0 means that the flag in question is set to 1, i.e. it’s on.
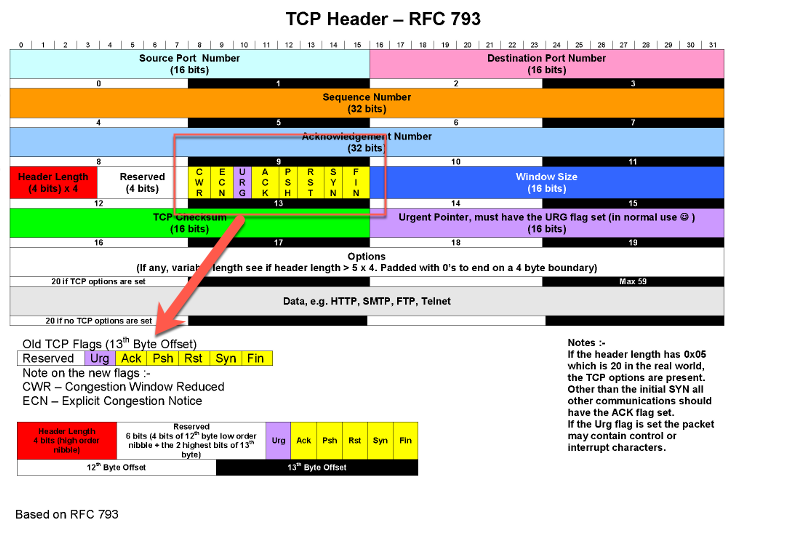

In the examples above, we can see that 4 is in the R column which corresponds to the RST or Reset Flag. The second example shows 2 which corresponds to S which is the SYN flag. Finally on the third we see 18 which is 16+2 giving us the SYN/ACK
Using AND & OR in Your Filters
Similar to mathematics, there is an order of operation. We can use the ( ) parentheses to combine and then use the AND to combine them. Lets look at an example.
dia sniff packet any "(src 10.1.105.3 or src 10.1.105.1) and icmp" 4 l 0
This will give you any ICMP packet that is sourced from 10.1.105.3 or sourced from 10.1.105.1
Negating
So this is probably one of my most used filters. When you are SSH’d to the Fortigate which I usually am when running these commands, you CAN be overwhelmed by the very connection you are using. For this we can use the ! (A.K.A. Bang)
dia sniffer packet any 'host 10.1.105.3 and !port 22' 4 l 0
This would capture any packet from host 10.1.105.3 except for port 22 A.K.A. SSH
You can combine the filters we learned here and mix and match them. Part of successfully troubleshooting is learning packet capture.
And always remember “When in doubt, sniff it out”
Hope this helps.
Recent posts
-

-

DNS is one of those technologies that quietly underpins... Full Story
-

BGP issues on FortiGate firewalls usually trace back to... Full Story
-

Every time your laptop talks to your router, a... Full Story
-

If you've spent any time configuring NAT on a... Full Story
-

If you have spent any time configuring firewall policies... Full Story
-

High availability on FortiGate is one of those features... Full Story
-

If you've configured SD-WAN on a FortiGate, you've almost... Full Story
-

FortiLink is the management protocol that turns a FortiSwitch... Full Story
-

FortiSwitches are pretty rock solid from Mean Time Between... Full Story
-

This is a quicky tip. Have you ever gone... Full Story
-

DNS is one of those quiet pieces of internet... Full Story
-

This article is an updated version of the previous... Full Story
-

You will add ns2 as a secondary (slave) BIND9... Full Story
-

In the process of deploying my lab, I needed... Full Story
-

RFC 8805, used to be known as Self-Correcting IP... Full Story
-

Years back, I wrote an article about certificate pinning. ... Full Story
-

FortiGates have the ability to send alerts to Microsoft... Full Story
-

In this post, I am going to walk through... Full Story
-

Troubleshooting VoIP on a FortiGate can feel like trying... Full Story
-

Prior to FortiOS 7.0, there were three commands to... Full Story
-

In this post, I am going to go over... Full Story
-

What we are going to do: We are going... Full Story
-

Choosing between FGCP (FortiGate Clustering Protocol) and FGSP (FortiGate... Full Story
-

Creating a VLAN on macOS (The "Pro" Move) A... Full Story
-

This blog post explores the logic behind how macOS... Full Story
-

Pretty Fly for a Wi-Fi Tell My Wi-Fi Love... Full Story
-

Part of my daily gig is creating BoMs (Bill-of-Materials)... Full Story
-

ICMP introduces several security risks, but careful filtering, rate... Full Story
-

The command diag debug application dhcps -1 enables full... Full Story
-

In the world of FortiOS, execute tac report is... Full Story
-

LLDP; What is it The Link Layer Discovery Protocol... Full Story
-

What it actually does When you run diagnose fdsm... Full Story
-

Monkey Bites are bite-sized, high-impact security insights designed for... Full Story
-

I have run macOS in macOS with Parallels but... Full Story
-

Don't be confused with my other FortiNAC posts where... Full Story
-

This is the third session in a multi-part article... Full Story
-

Today I was configuring key-based authentication on a FortiGate... Full Story
-

Netcat, often called the "Swiss Army knife" of networking,... Full Story
-

At its core, IEEE 802.1X is a network layer... Full Story
-

In case you did not see the previous FortiNAC... Full Story
-

This is our 5th session where we are going... Full Story
-

Now that we have Wireshark installed and somewhat configured,... Full Story
-

The Philosophy of Packet Analysis Troubleshooting isn't about looking... Full Story
-

Do you use Sequence Groups In your Firewall Policies? ... Full Story
-

The other day, I opened my Wireshark for macOS... Full Story
-

1. Executive Summary Objective This guide walks through the... Full Story