If you've spent any time configuring user authentication on... Full Story
By Manny Fernandez
March 13, 2019

Understanding Fortigate Logging
In this blog post, we are going to analyze some log files from my Fortigate to describe the different sections of the log, what they mean and how to interpret them. I will be referencing the FortiOS Log Reference Guide which is available via PDF from the Fortinet Site. For version 6, the link is here. Lets begin.
itime=2019-03-12 19:30:12 vd=root rcvdbyte=0 srccountry=Reserved craction=131072 devcategory=Windows Device date=2019-03-12 devtype=Windows PC dstip=1.1.16.43
crscore=30 srcintfrole=lan duration=0 sentbyte=0 logid=0000000013 crlevel=high srcmac=00:0c:29:5a:be:ef service=DNS proto=17 devid=FG3H0E5<REMOVED> policytype=policy poluuid=3ef8fc44-3850-51e9-7638-8b5bbf1c560a idseq=79516894796709890 dstport=53 type=traffic eventtime=1552444212 devname=LAB-FW-01 dstintfrole=wan dtime=2019-03-12 22:30:12 trandisp=noop osname=Windows 8.1 / 2012 sessionid=56774108 itime_t=1552444212 dstintf=port1 srcintf=Servers srcip=10.1.106.39 sentpkt=0 level=notice appcat=unscanned srcport=63117 srcserver=0 srcname=WIN-EC9R2A1AT61 subtype=forward dstcountry=China time=22:30:12 action=deny mastersrcmac=00:0c:29:5a:b6:a2 policyid=39
Above, we have a single raw log entry from my FortiAnalyzer. The FortiAnalyzer is an application from Fortinet that aids in displaying information about the logs generated by the Fortigates and other Fortinet solutions. It is a central logging facility with the added feature of beautiful reports that can be scheduled and sent out automatically. In this section, we are going to break down the pieces of the log.
itime=2019-03-12 19:30:12 – is generated by FAZ when it receives a log (with SQL enabled) i.e. FAZ local time.
vd=root – This is the VDOM the log was received from. If you are not using VDOMS, then it will alays be ‘root’
rcvdbyte=0 – Number of bytes received, in our example, that would be ‘0’.
srccountry=Reserved – A couple of things here, the first is the category of ‘srrcountry’ which defines the country of origin. The other is ‘Reserved’, reserved means RFC1918 or any other that remains reserved.
craction=131072 – Client Reputation Action
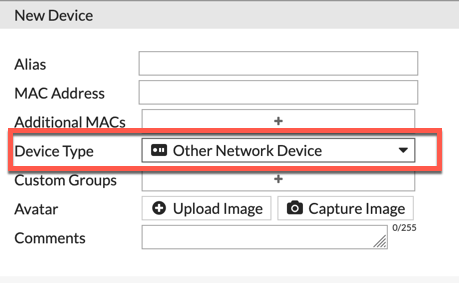
devcategory=Windows Device – Device Category is the pre-defined device category.
date=2019-03-12 – Date that the log was generated.
devtype=Windows PC – This field is the OS Fingerprint of the device
dstip=1.1.16.43 – Here is the destination IP address that the source was trying to connect to.
crscore=30 – This is the ‘Client Reputation Score’
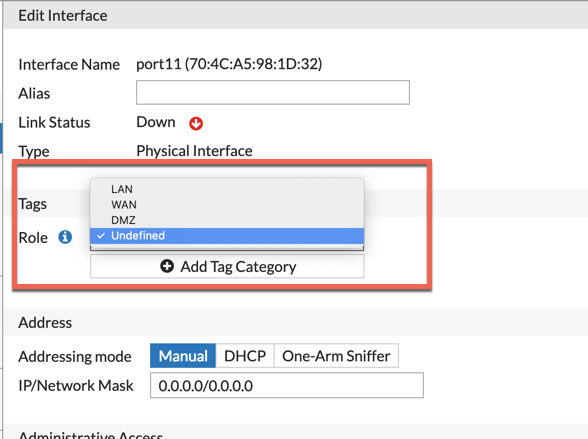
srcintfrole=lan – This is the role the interface is placed in under ‘Network’ ‘Interfaces’
duration=0 – Duration of the session, in this case, the session was never established so it is ‘0’.
sentbyte=0 – How many bytes we sent. In this case, again, ‘0’ was sent.
logid=0000000013 – Log ID
crlevel=high – Client Reputation Level
srcmac=00:0c:29:5a:be:ef – The Source MAC address. Beware though, this could be the next hop for the Fortigate if layer 3 boundaries are in play.
service=DNS – This is the matched service from the ‘Services’ section under ‘Policy & Objects’ then ‘Services’
proto=17 – This is the protocol number which defines if it is TCP, UDP, etc. For a full list, check out IANA’s Website
Some of the most common: TCP=6, UDP=17, ICMP=1, IGMP=2
devid=FG3H0E5<REMOVED> – This is the serial number of the reporting device.
policytype=policy poluuid=3ef8fc44-3850-51e9-7638-8b5bbf1c560a – This represents the UUID for the policy. Fortinet uses UUID to be able to identify the policy throughout its lefe-cycle regardless of the positioning.
dstport=53 – This is the destination port for the connection. As we can see, it is DNS traffic which is UDP 53
type=traffic – This is a main category of the log. ‘Traffic’ is the main category while it has sub-categories: Forward, Local, Multicast, Sniffer
eventtime=1552444212 – Epoch time the log was triggered by FortiGate. If you convert the epoch time to human readable time, it might not match the Date and Time in the header owing to a small delay between the time the log was triggered and recorded. The Log Time field is the same for the same log among all log devices, but the Date and Time might differ.
devname=LAB-FW-01 – While the ‘devid’ gave us the Serial Number, the ‘devname’ gives us the hostname for the Fortigate.
dstintfrole=wan – This is similar to ‘srcintfrole’ however this is the detination. (See screenshot above).
dtime=2019-03-12 22:30:12 – is calculated by FAZ in UTC using ‘data’ and ‘time’ fields received from the FortiGate.
trandisp=noop – This indicates that there was no NAT taking place. Had there been a Source NAT, you would have seen something like ‘transdisp=snat’
osname=Windows 8.1 / 2012 – OS Version of the source
sessionid=56774108 – Session ID
itime_t=1552444212 – is generated by FAZ when it receives a log (with SQL enabled) i.e. FAZ local time.
dstintf=port1 – The destination interface it is going to egress. In this case, port1. The 300E does not have a ‘WAN’ port so we just use port 1 and port 2.
srcintf=Servers – Same as above but Source. The interface name in this case is ‘Servers’
srcip=10.1.106.39 – This is the IP address of the source device.
sentpkt=0 – How many packets were sent?
level=notice – Security level rating (e.g. warning, informational, etc)
appcat=unscanned – Application Category
srcport=63117 – The port the source device started the connection from.
srcserver=0 – Server of the source
srcname=WIN-EC9R2A1AT61 – Source Device Name
subtype=forward – Sub-Type of type ‘Traffic’ Options are: Forward, Local, Multicast, Sniffer.
dstcountry=China – This is the destination country based on Fortiguard update. Similar to dig -x Y.Y.Y.Y
action=deny – The action here was ‘deny’.
mastersrcmac=00:0c:29:5a:be:be – The master MAC address for a host (mastersrcmac) that has multiple network interfaces
policyid=39 – The policy ID number.
Here are the six action items in the log:
close – for the end of TCP session closed with a FIN/FIN-ACK/RST.
deny – for traffic blocked by a firewall policy.
dns – for DNS that failed for the session.
ip-conn – for IP connection that failed for the session (host is not reachable).
start – for TCP session start log (special option to enable logging at start of a session). This means allowed by a firewall policy.
timeout – for the end of a TCP session which is closed because it was idle.
Recent posts
-

-

DNS is one of those technologies that quietly underpins... Full Story
-

BGP issues on FortiGate firewalls usually trace back to... Full Story
-

Every time your laptop talks to your router, a... Full Story
-

If you've spent any time configuring NAT on a... Full Story
-

If you have spent any time configuring firewall policies... Full Story
-

High availability on FortiGate is one of those features... Full Story
-

If you've configured SD-WAN on a FortiGate, you've almost... Full Story
-

FortiLink is the management protocol that turns a FortiSwitch... Full Story
-

FortiSwitches are pretty rock solid from Mean Time Between... Full Story
-

This is a quicky tip. Have you ever gone... Full Story
-

DNS is one of those quiet pieces of internet... Full Story
-

This article is an updated version of the previous... Full Story
-

You will add ns2 as a secondary (slave) BIND9... Full Story
-

In the process of deploying my lab, I needed... Full Story
-

RFC 8805, used to be known as Self-Correcting IP... Full Story
-

Years back, I wrote an article about certificate pinning. ... Full Story
-

FortiGates have the ability to send alerts to Microsoft... Full Story
-

In this post, I am going to walk through... Full Story
-

Troubleshooting VoIP on a FortiGate can feel like trying... Full Story
-

Prior to FortiOS 7.0, there were three commands to... Full Story
-

In this post, I am going to go over... Full Story
-

What we are going to do: We are going... Full Story
-

Choosing between FGCP (FortiGate Clustering Protocol) and FGSP (FortiGate... Full Story
-

Creating a VLAN on macOS (The "Pro" Move) A... Full Story
-

This blog post explores the logic behind how macOS... Full Story
-

Pretty Fly for a Wi-Fi Tell My Wi-Fi Love... Full Story
-

Part of my daily gig is creating BoMs (Bill-of-Materials)... Full Story
-

ICMP introduces several security risks, but careful filtering, rate... Full Story
-

The command diag debug application dhcps -1 enables full... Full Story
-

In the world of FortiOS, execute tac report is... Full Story
-

LLDP; What is it The Link Layer Discovery Protocol... Full Story
-

What it actually does When you run diagnose fdsm... Full Story
-

Monkey Bites are bite-sized, high-impact security insights designed for... Full Story
-

I have run macOS in macOS with Parallels but... Full Story
-

Don't be confused with my other FortiNAC posts where... Full Story
-

This is the third session in a multi-part article... Full Story
-

Today I was configuring key-based authentication on a FortiGate... Full Story
-

Netcat, often called the "Swiss Army knife" of networking,... Full Story
-

At its core, IEEE 802.1X is a network layer... Full Story
-

In case you did not see the previous FortiNAC... Full Story
-

This is our 5th session where we are going... Full Story
-

Now that we have Wireshark installed and somewhat configured,... Full Story
-

The Philosophy of Packet Analysis Troubleshooting isn't about looking... Full Story
-

Do you use Sequence Groups In your Firewall Policies? ... Full Story
-

The other day, I opened my Wireshark for macOS... Full Story
-

1. Executive Summary Objective This guide walks through the... Full Story