
If you've spent any time configuring user authentication on... Full Story
By Manny Fernandez
October 14, 2026

Graylog Open 7.1 on Ubuntu 24.04: Install and Configure a Core Cluster
Executive Summary
| Objective | Stand up a working Graylog Open 7.1 Core cluster (Graylog + MongoDB on one node, Data Node on a second), complete the preflight certificate workflow, and start ingesting, routing, and parsing FortiGate and Linux syslog. |
| Target Audience | Network and security engineers, SOC analysts, and homelabbers who are comfortable on the Linux CLI and want a free, self-hosted log management platform without the vendor fluff. |
Graylog Open is the free, self-managed edition of Graylog. It gives you centralized log collection, full-text search, streams, processing pipelines, dashboards, and basic event alerting at no license cost. The paid tiers (Enterprise and Security) add things like archiving, reporting, correlation, and Sigma content, but Open is more than enough to replace a pile of grep sessions across a dozen boxes.
Since Graylog 5.2 the search backend story changed. You no longer hand-build an OpenSearch cluster. Graylog ships Data Node, a package that embeds and manages OpenSearch for you, including the TLS certificates between Graylog and the search layer. That also changed the first-boot experience: the server now starts in a preflight mode with a one-time password, and you provision a CA before Graylog will fully start.
This guide walks the current 7.1 install on Ubuntu 24.04 LTS using the vendor-recommended Core layout, then takes it past “it runs” into something useful: a syslog input, a dedicated index set with retention, a FortiGate stream, and a pipeline rule that turns FortiOS key=value logs into searchable fields.
Prerequisites & Architecture
Assumed Knowledge
- Comfortable with
apt,systemctl,journalctl, and editing files withnanoorvim. - Basic syslog concepts (facility, severity, UDP vs. TCP transport).
- For the FortiGate section: FortiOS CLI access with permission to change log settings.
The Graylog Stack in 60 Seconds
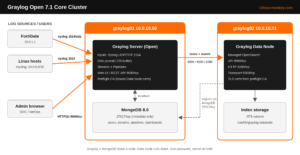
Three services make up a Graylog 7.x deployment. Know what each one owns before you start, because most install failures come from one of them not being able to reach another.
| Component | Role | Default Ports | Lab Host |
|---|---|---|---|
| Graylog Server | Web UI, REST API, inputs, processing, stream routing | 9000/tcp (UI/API), inputs you define | graylog01 |
| MongoDB 8.0 | Metadata only: users, streams, pipelines, dashboards, config | 27017/tcp | graylog01 |
| Graylog Data Node | Embedded, managed OpenSearch that stores and indexes the messages | 8999/tcp (API), 9200/tcp, 9300/tcp | graylog02 |
Note: MongoDB never stores log messages. If MongoDB dies you lose configuration, not logs. If the Data Node dies you lose search, and the Graylog journal buffers incoming messages on disk until it comes back.
Lab Environment
Graylog documents the Core architecture as one Graylog/MongoDB node plus one dedicated Data Node, and that is what we build here. You can collapse everything onto one VM for a throwaway lab, but OpenSearch and the Graylog JVM will fight over memory, so do not do it for anything you care about.
| Item | graylog01 (Graylog + MongoDB) | graylog02 (Data Node) |
|---|---|---|
| OS | Ubuntu Server 24.04 LTS | Ubuntu Server 24.04 LTS |
| IP address | 10.0.10.50/24 | 10.0.10.51/24 |
| vCPU / RAM | 4 vCPU / 8 GB | 4 vCPU / 8 GB minimum (16 GB better) |
| Disk | 50 GB (journal lives here) | 200 GB+ on XFS for index data |
| CPU flag | AVX required (MongoDB 8.0) | n/a |
| Log sources | FortiGate at 10.0.1.1, Linux hosts in 10.0.0.0/16 |
Warning: The official install guide assumes firewalls are open and does not configure security. This post adds host firewall rules in Step 6, but you still need TLS on the web UI and network segmentation before production data goes anywhere near it.
Step-by-Step Implementation Workflow
Step 1: Prepare Both Nodes
Goal: Consistent time, name resolution, and a patched OS on graylog01 and graylog02.
Action: Run the following on both nodes. Graylog stores timestamps in UTC internally, so setting the server clock to UTC removes an entire category of “why are my logs five hours off” tickets.
sudo apt-get update && sudo apt-get -y upgrade
sudo apt-get install -y gnupg curl wget apt-transport-https chrony
sudo timedatectl set-timezone UTC
sudo systemctl enable --now chrony

# Name resolution (skip if DNS already has these)
cat <<'EOF' | sudo tee -a /etc/hosts
10.0.10.50  graylog01
10.0.10.51  graylog02
EOF
Verification: timedatectl shows Time zone: Etc/UTC and System clock synchronized: yes. ping -c1 graylog02 resolves from graylog01 and vice versa.
Step 2: Install MongoDB 8.0 on graylog01
Goal: A running MongoDB instance reachable by both the Graylog server (locally) and the Data Node (over the network).
Action: First confirm the CPU exposes AVX. MongoDB 5.0 and later will not run without it, and this is the number one failure on Proxmox and ESXi VMs using a generic CPU model.
grep -c avx /proc/cpuinfo # >0 is good; 0 means fix the VM CPU typeAdd the MongoDB 8.0 repository, install, and pin the version so an unattended upgrade never jumps you to an unsupported release:
curl -fsSL https://www.mongodb.org/static/pgp/server-8.0.asc | \
  sudo gpg -o /usr/share/keyrings/mongodb-server-8.0.gpg --dearmor

echo "deb [ arch=amd64,arm64 \
signed-by=/usr/share/keyrings/mongodb-server-8.0.gpg ] \
https://repo.mongodb.org/apt/ubuntu noble/mongodb-org/8.0 multiverse" | \
  sudo tee /etc/apt/sources.list.d/mongodb-org-8.0.list

sudo apt-get update
sudo apt-get install -y mongodb-org
sudo apt-mark hold mongodb-org
MongoDB listens on loopback only by default. The Data Node on graylog02 needs to reach it, so bind to loopback plus the node’s LAN address. Edit /etc/mongod.conf:
/etc/mongod.conf (net section)
net:
  port: 27017
  bindIp: 127.0.0.1,10.0.10.50
sudo systemctl daemon-reload
sudo systemctl enable --now mongodVerification: sudo ss -tlnp | grep 27017 shows mongod on both 127.0.0.1:27017 and 10.0.10.50:27017.
Pro Tip: Binding to 0.0.0.0 (or bindIpAll: true) works too, but MongoDB here has no authentication. Pair it with the UFW rules in Step 6 so only graylog02 can reach 27017.
Step 3: Install and Configure the Data Node on graylog02
Goal: A Data Node that knows where MongoDB lives and shares a password_secret with the Graylog server.
Action: Install the Graylog 7.1 repository package, then the Data Node. Do not install OpenSearch yourself. Data Node bundles and manages it.
wget https://packages.graylog2.org/repo/packages/graylog-7.1-repository_latest.deb
sudo dpkg -i graylog-7.1-repository_latest.deb
sudo apt-get update
sudo apt-get install -y graylog-datanode
OpenSearch needs a higher memory map count than Ubuntu ships with. Set it persistently:
echo 'vm.max_map_count=262144' | sudo tee /etc/sysctl.d/99-graylog-datanode.conf
sudo sysctl --system
cat /proc/sys/vm/max_map_count   # expect 262144
Generate the shared secret. Copy the output somewhere safe, because the exact same value goes into the Graylog server config in Step 4:
openssl rand -hex 32Edit /etc/graylog/datanode/datanode.conf and set these three values. Note that opensearch_heap is not present in the default file; you must add the line yourself. Size it to half the node’s RAM, capped at 31 GB.
/etc/graylog/datanode/datanode.conf
password_secret = <PASTE_OPENSSL_OUTPUT_HERE>
mongodb_uri = mongodb://graylog01:27017/graylog

# Not in the default file. Half of RAM, max 31g. 8 GB VM = 4g
opensearch_heap = 4g
sudo systemctl daemon-reload
sudo systemctl enable --now graylog-datanodeVerification: systemctl status graylog-datanode is active (running) and sudo ss -tlnp | grep 8999 shows the Data Node API listening. It will sit waiting for certificates until the preflight in Step 5; that is expected.
Pro Tip: If you added a dedicated XFS disk for index data, mount it at /var/lib/graylog-datanode and chown -R graylog-datanode:graylog-datanode it before the first start, so OpenSearch never writes to the root volume.
Step 4: Install and Configure Graylog Server on graylog01
Goal: The Graylog Open server installed, sharing the Data Node secret, with an admin password hash and sane heap and journal settings.
Action: Add the same 7.1 repository on graylog01 and install the Open package. The package name is graylog-server; graylog-enterprise is the licensed build.
wget https://packages.graylog2.org/repo/packages/graylog-7.1-repository_latest.deb
sudo dpkg -i graylog-7.1-repository_latest.deb
sudo apt-get update
sudo apt-get install -y graylog-server
Create the SHA-256 hash of the password you want for the built-in admin account. Type the password, press Enter, and copy the hash:
echo -n "Enter Password: " && head -1 </dev/stdin | tr -d '\n' | \
  sha256sum | cut -d" " -f1
Edit /etc/graylog/server/server.conf. The journal values below assume roughly 10 GB of logs per day; size message_journal_max_size to about three days of your expected volume so a Data Node outage does not drop messages.
/etc/graylog/server/server.conf
password_secret = <SAME_VALUE_AS_DATANODE_CONF>
root_password_sha2 = <SHA256_HASH_FROM_ABOVE>
root_timezone = UTC

# Listen on all interfaces, port 9000 (commented out by default)
http_bind_address = 0.0.0.0:9000
# URL browsers and the API should use; set to your DNS name if you have one
http_external_uri = http://10.0.10.50:9000/

# MongoDB is local on this node (this is the default)
mongodb_uri = mongodb://localhost/graylog

# Disk journal: buffer ~72h of volume if the Data Node goes away
message_journal_max_age = 72h
message_journal_max_size = 30gb
Set the Graylog JVM heap in /etc/default/graylog-server. Use half of system RAM up to 16 GB, with min and max equal:
/etc/default/graylog-server
GRAYLOG_SERVER_JAVA_OPTS="-Xms2g -Xmx2g -server -XX:+UseG1GC \
-XX:-OmitStackTraceInFastThrow"
The default file carries extra JVM flags on that line. Keep them, and only change the -Xms and -Xmx values if you prefer a minimal edit. Then start the service:
sudo systemctl daemon-reload
sudo systemctl enable --now graylog-server
Verification: sudo tail -f /var/log/graylog-server/server.log shows the Graylog ASCII banner followed by a preflight notice. That is your cue for Step 5.
Step 5: Complete the Preflight and Provision Data Node Certificates
Goal: Graylog generates a CA, issues a certificate to the Data Node, and transitions out of preflight into normal operation.
Action: On first start, Graylog does not accept your admin password. It prints a one-time preflight credential into the server log. Pull it out:
sudo grep -A2 "Initial configuration is accessible" \
  /var/log/graylog-server/server.log
Expected output (password is random per install)
Initial configuration is accessible at 0.0.0.0:9000, with username 'admin'
and password 'Xk39pQzLm2'.
Browse to http://10.0.10.50:9000, log in with that one-time credential, and work through the wizard:
- Configure a CA: choose Create new CA (fine for a lab or internal use) or upload your own PKI’s intermediate. Give it an organization name.
- Renewal policy: pick automatic renewal and a certificate lifetime. Automatic is the right answer unless compliance requires otherwise.
- Provision certificates: graylog02 should be listed as a discovered Data Node. Click Provision certificate and continue. Graylog signs the Data Node certificate and pushes it down.
- Resume startup: once the Data Node shows as connected, finish the wizard. Graylog restarts its web interface into normal mode.
Log in again, this time as admin with the plaintext password you hashed into root_password_sha2 in Step 4.
Warning: No Data Node in the preflight list almost always means one of three things: different password_secret values on the two nodes, the Data Node cannot reach MongoDB on graylog01:27017, or a firewall between them. See Troubleshooting below.
GUI Verification: System > Data Nodes shows graylog02 as AVAILABLE, and System > Overview has no red notifications about the search backend.
Step 6: Lock Down the Host Firewalls
Goal: Only the ports each role actually needs, only from the sources that need them.
Action: On graylog01 (web UI, inputs, and MongoDB for the Data Node):
graylog01
sudo ufw allow OpenSSH
sudo ufw allow from 10.0.0.0/16 to any port 9000 proto tcp   # Web UI/API
sudo ufw allow from 10.0.0.0/16 to any port 1514 proto udp   # Syslog
sudo ufw allow from 10.0.0.0/16 to any port 1514 proto tcp   # Syslog
sudo ufw allow from 10.0.10.51 to any port 27017 proto tcp   # MongoDB
sudo ufw enable
On graylog02 (Data Node API and OpenSearch, reachable from the Graylog server only):
graylog02
sudo ufw allow OpenSSH
sudo ufw allow from 10.0.10.50 to any port 8999 proto tcp   # DN API
sudo ufw allow from 10.0.10.50 to any port 9200 proto tcp   # OS HTTP
sudo ufw allow from 10.0.10.50 to any port 9300 proto tcp   # OS transport
sudo ufw enable
Verification: sudo ufw status numbered on each node matches the lists above, and the web UI still loads.
Step 7: Create a Syslog Input
Goal: A listener that accepts syslog from network devices and Linux hosts.
Action: Go to System > Inputs, select Syslog UDP, click Launch new input, and set:
| Field | Value | Why |
|---|---|---|
| Node / Global | Global | Runs on every Graylog node, so the config survives scaling out |
| Title | Syslog UDP 1514 | Name it by transport and port so it is obvious in the list |
| Bind address | 0.0.0.0 | Listen on all interfaces; UFW restricts sources |
| Port | 1514 | Graylog runs as a non-root user and cannot bind below 1024 |
| Store full message | Enabled | Keeps the raw line in full_message for pipeline parsing |
| Allow overriding date | Enabled | Uses the device timestamp when present |
Repeat for Syslog TCP on 1514 if you have sources that prefer TCP. Then click Start input if it is not already running.
Pro Tip: Stuck with a device that can only send to 514? Redirect it at the host instead of running Graylog as root: sudo iptables -t nat -A PREROUTING -p udp --dport 514 -j REDIRECT --to-port 1514, then persist it with iptables-persistent (or add the equivalent to /etc/ufw/before.rules).
GUI Verification: The input shows a green RUNNING badge. Click Show received messages after sending a test in the Verification section.
Step 8: Build an Index Set with Retention
Goal: Keep firewall logs in their own index set so you can size retention independently of everything else.
Action: Go to System > Indices and click Create index set. Use these values as a starting point:
| Setting | Value |
|---|---|
| Title | FortiGate Logs |
| Index prefix | fortigate (immutable after creation, choose carefully) |
| Shards / Replicas | 1 / 0 (single Data Node, replicas have nowhere to go) |
| Rotation / Retention | Data tiering with a minimum of 30 days and a maximum of 90 days |
Note: Graylog 6.0 introduced data tiering, where you set minimum and maximum lifetimes in days and Graylog optimizes rotation for you. Graylog Open includes the hot tier; the warm tier is a licensed feature. Legacy rotation strategies (by size, count, or time) are still available if you prefer explicit control.
GUI Verification: The new index set appears under System > Indices with an active write index named fortigate_0.
Step 9: Route FortiGate Traffic into a Stream
Goal: FortiGate messages land in the FortiGate index set and stop duplicating into the Default Stream.
Action: Go to Streams > Create stream:
- Title:
FortiGate. Index set:FortiGate Logs. - Check Remove matches from ‘Default Stream’. Without it every message is stored twice.
- Add a stream rule: field
source, type match exactly, value set to the FortiGate hostname as it appears in received messages (or use fieldgl2_remote_ipequals10.0.1.1). - Start the stream.
GUI Verification: Use Manage Rules > Load a message with a real FortiGate message ID. The rule should turn green.
Step 10: Parse FortiOS key=value Logs with a Pipeline
Goal: Turn a flat FortiGate syslog line into first-class fields like srcip, dstport, action, and policyid that you can search, aggregate, and alert on.
Action: Go to System > Pipelines > Manage rules > Create rule and paste:
Pipeline rule: fortigate_kv_parse
rule "fortigate_kv_parse"
when
  has_field("message") &&
  contains(to_string($message.message), "devname=")
then
  let kv = key_value(
    value: to_string($message.message),
    delimiters: " ",
    kv_delimiters: "=",
    trim_key_chars: "\"",
    trim_value_chars: "\""
  );
  set_fields(kv);
  set_field("vendor", "fortinet");
end
Now wire it up. Manage pipelines > Add new pipeline, name it FortiGate Parsing, edit Stage 0, add fortigate_kv_parse, and under Pipeline connections connect it to the FortiGate stream.
One setting catches almost everyone. Go to System > Configurations > Message Processors and confirm the order puts Message Filter Chain before Pipeline Processor. Stream routing happens in the filter chain, so if the pipeline runs first, the message is not in the FortiGate stream yet and your rule never fires.
| Order | Processor | Status |
|---|---|---|
| 1 | AWS Instance Name Lookup | Disabled unless used |
| 2 | GeoIP Resolver | Optional |
| 3 | Message Filter Chain | Enabled |
| 4 | Pipeline Processor | Enabled |
GUI Verification: Open the pipeline and use Simulate processing with a pasted FortiGate log line. The output should list the parsed fields.
Step 11: Point Log Sources at Graylog
Goal: Real traffic flowing in from a FortiGate and a Linux host.
Action (FortiGate): On the FortiGate CLI, send logs to graylog01 on the custom port. source-ip pins the egress address so your stream rule on gl2_remote_ip stays stable.
FortiOS CLI
config log syslogd setting
    set status enable
    set server "10.0.10.50"
    set mode udp
    set port 1514
    set facility local7
    set source-ip 10.0.1.1
    set format default
end

config log syslogd filter
    set severity information
    set forward-traffic enable
    set local-traffic disable
end
Action (Linux): On any Ubuntu or Debian host, drop an rsyslog forwarder in place. A single @ means UDP; use @@ for TCP.
/etc/rsyslog.d/90-graylog.conf
*.* @10.0.10.50:1514;RSYSLOG_SyslogProtocol23Formatsudo systemctl restart rsyslogVerification & Validation
Run these after the preflight is complete. Each one should return the “success” output shown.
Services Are Up
graylog01
systemctl is-active mongod graylog-server
curl -s http://10.0.10.50:9000/api/system/lbstatus; echo
Expected
active
active
ALIVE
graylog02
systemctl is-active graylog-datanode
sudo ss -tlnp | grep -E ':(8999|9200|9300)\b'
Expected: active, plus three LISTEN lines owned by java for 8999, 9200, and 9300.
Messages Arrive
From any Linux box in 10.0.0.0/16, fire a test message straight at the input:
logger -n 10.0.10.50 -P 1514 -d "infosecmonkey graylog test $(date +%s)"In Graylog, go to Search, set the range to Last 5 minutes, and query "infosecmonkey graylog test". One hit means the input, journal, and Data Node path all work.
On the FortiGate, generate test log entries and confirm the parser:
FortiOS CLI
diagnose log testThen search streams:<FortiGate stream ID> AND _exists_:srcip or simply open the FortiGate stream and look for the srcip, dstip, action, and policyid fields in the field list on the left. If they are present, the pipeline is working.
Throughput Sanity Check
System > Nodes > graylog01 > Details shows the journal. A healthy system has uncommitted journal entries hovering near zero. A steadily growing number means the Data Node cannot keep up or is unreachable.
Troubleshooting & Gotchas
Gotcha 1: mongod Crashes Immediately with Illegal Instruction
Symptom: systemctl status mongod shows status=4/ILL or core-dump, and nothing is written to the MongoDB log.
sudo systemctl status mongod --no-pager | grep -E 'Main PID|status='
grep -c avx /proc/cpuinfo
Resolution: The VM CPU does not expose AVX. On Proxmox set the CPU type to host (or x86-64-v3); on ESXi, lower EVC restrictions or pass through the host CPU features; on Hyper-V make sure processor compatibility mode is off. Reboot the VM and re-check the grep count.
Gotcha 2: Data Node Never Shows Up in the Preflight
Symptom: The preflight wizard says no Data Nodes were found, or graylog02 appears and then disappears.
graylog02
sudo journalctl -u graylog-datanode -n 50 --no-pager
sudo tail -n 50 /var/log/graylog-datanode/datanode.log
nc -vz graylog01 27017
sudo grep -E '^(password_secret|mongodb_uri)' \
  /etc/graylog/datanode/datanode.conf
graylog01 (compare the secret)
sudo grep -E '^password_secret' /etc/graylog/server/server.confResolution: The Data Node registers itself through MongoDB, so if nc fails, fix bindIp in /etc/mongod.conf or the UFW rule for 27017. If the two password_secret lines differ by even one character, correct them and restart both graylog-datanode and graylog-server. A missing vm.max_map_count setting also stops OpenSearch from booting; it shows up clearly in datanode.log.
Gotcha 3: Input Is RUNNING but Nothing Arrives
Symptom: The input badge is green, the message counter stays at zero.
graylog01
sudo tcpdump -ni any udp port 1514 -c 5
sudo ss -ulnp | grep 1514
sudo ufw status | grep 1514
FortiGate
diagnose sniffer packet any 'host 10.0.10.50 and udp port 1514' 4 5Resolution: No packets in tcpdump means the problem is upstream: FortiGate source-ip routing, an intermediate firewall policy, or UFW. Packets arriving but no messages usually means the device is sending to 514 while the input listens on 1514, or the input is bound to the wrong address. Packets and messages present but the FortiGate stream is empty points at the stream rule value; load a real message into the rule tester and match what is actually in source.
Gotcha 4: Pipeline Fields Never Appear
Symptom: FortiGate messages are in the right stream, but srcip and friends are missing.
Resolution: Check the Message Processors order from Step 10 first; it is the cause far more often than the rule itself. Next, confirm the pipeline is connected to the FortiGate stream, not the Default Stream. Finally, paste a raw log line into Simulate processing. FortiOS quotes values that contain spaces (for example msg="..."), so if a field splits oddly, test with the simulator and adjust the delimiters before trusting the output in production.
InfoSecMonkey | No fluff. Just the config that works.
Recent posts
-

-

DNS is one of those technologies that quietly underpins... Full Story
-

BGP issues on FortiGate firewalls usually trace back to... Full Story
-

Every time your laptop talks to your router, a... Full Story
-

If you've spent any time configuring NAT on a... Full Story
-

If you have spent any time configuring firewall policies... Full Story
-

High availability on FortiGate is one of those features... Full Story
-

If you've configured SD-WAN on a FortiGate, you've almost... Full Story
-

FortiLink is the management protocol that turns a FortiSwitch... Full Story
-

FortiSwitches are pretty rock solid from Mean Time Between... Full Story
-

This is a quicky tip. Have you ever gone... Full Story
-

DNS is one of those quiet pieces of internet... Full Story
-

This article is an updated version of the previous... Full Story
-

You will add ns2 as a secondary (slave) BIND9... Full Story
-

In the process of deploying my lab, I needed... Full Story
-

RFC 8805, used to be known as Self-Correcting IP... Full Story
-

Years back, I wrote an article about certificate pinning. ... Full Story
-

FortiGates have the ability to send alerts to Microsoft... Full Story
-

In this post, I am going to walk through... Full Story
-

Troubleshooting VoIP on a FortiGate can feel like trying... Full Story
-

Prior to FortiOS 7.0, there were three commands to... Full Story
-

In this post, I am going to go over... Full Story
-

What we are going to do: We are going... Full Story
-

Choosing between FGCP (FortiGate Clustering Protocol) and FGSP (FortiGate... Full Story
-

Creating a VLAN on macOS (The "Pro" Move) A... Full Story
-

This blog post explores the logic behind how macOS... Full Story
-

Pretty Fly for a Wi-Fi Tell My Wi-Fi Love... Full Story
-

Part of my daily gig is creating BoMs (Bill-of-Materials)... Full Story
-

ICMP introduces several security risks, but careful filtering, rate... Full Story
-

The command diag debug application dhcps -1 enables full... Full Story
-

In the world of FortiOS, execute tac report is... Full Story
-

LLDP; What is it The Link Layer Discovery Protocol... Full Story
-

What it actually does When you run diagnose fdsm... Full Story
-

Monkey Bites are bite-sized, high-impact security insights designed for... Full Story
-

I have run macOS in macOS with Parallels but... Full Story
-

Don't be confused with my other FortiNAC posts where... Full Story
-

This is the third session in a multi-part article... Full Story
-

Today I was configuring key-based authentication on a FortiGate... Full Story
-

Netcat, often called the "Swiss Army knife" of networking,... Full Story
-

At its core, IEEE 802.1X is a network layer... Full Story
-

In case you did not see the previous FortiNAC... Full Story
-

This is our 5th session where we are going... Full Story
-

Now that we have Wireshark installed and somewhat configured,... Full Story
-

The Philosophy of Packet Analysis Troubleshooting isn't about looking... Full Story
-

The Tuesday Afternoon Call It is a quiet Tuesday... Full Story
-

A practitioner breakdown of every TLS version: handshakes, cipher... Full Story
-

A practitioner guide to executables, libraries, mapped files, handles,... Full Story