If you've spent any time configuring user authentication on... Full Story
By Manny Fernandez
May 15, 2026
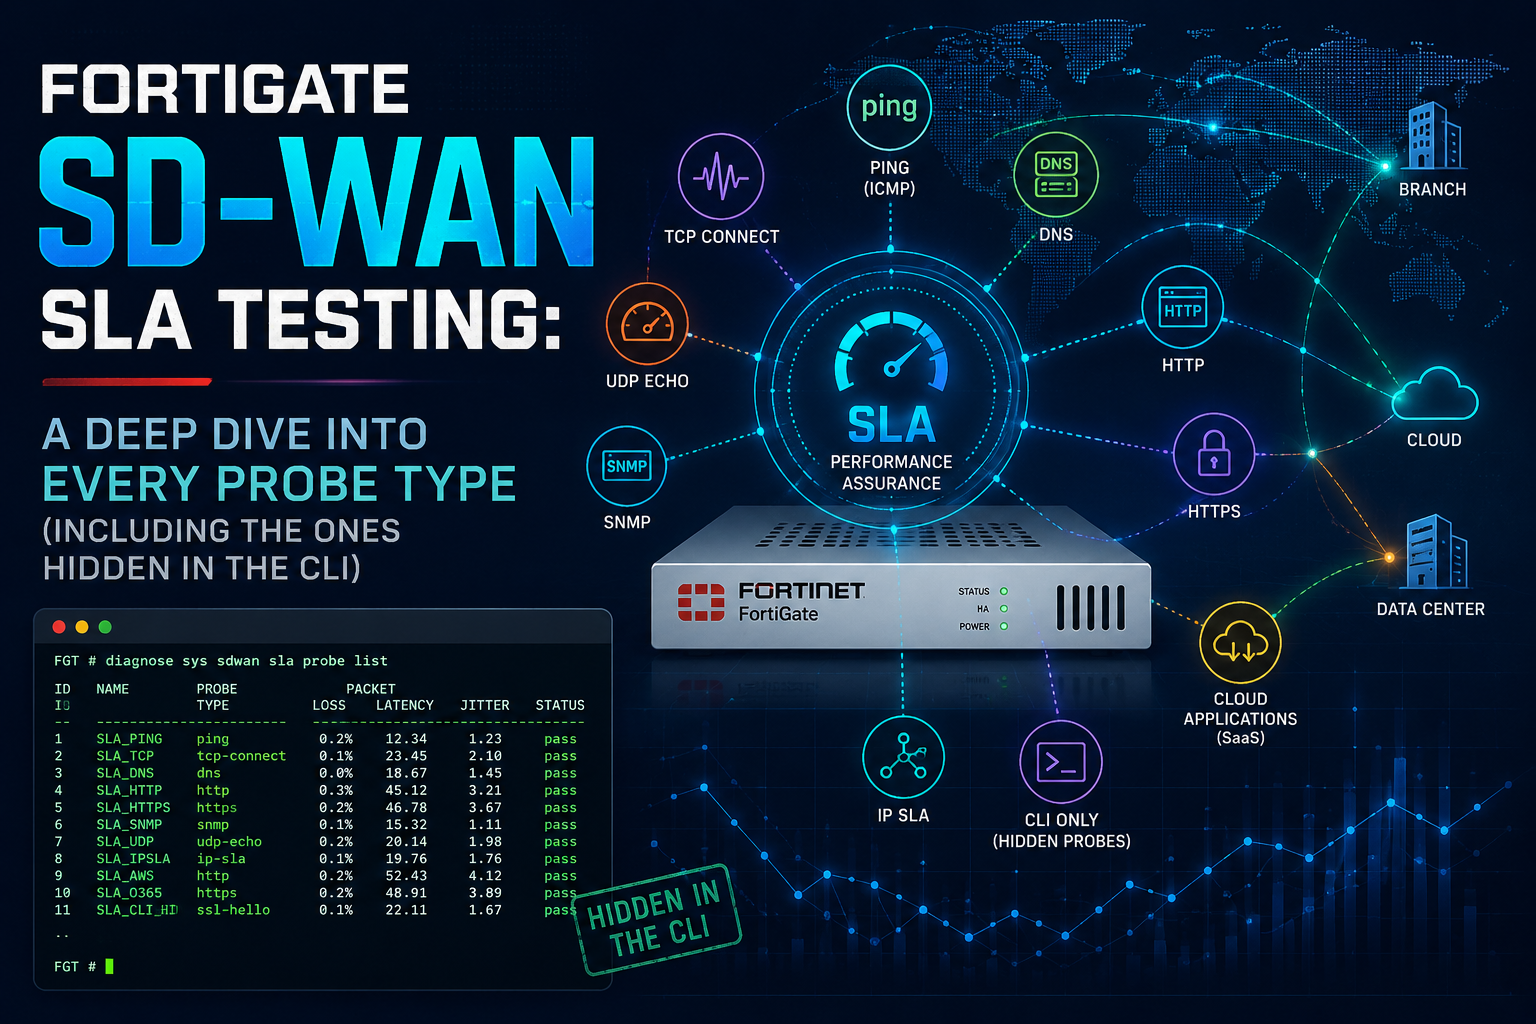
FortiGate SD-WAN SLA Testing: A Deep Dive Into Every Probe Type (Including the Ones Hidden in the CLI)
If you’ve configured SD-WAN on a FortiGate, you’ve almost certainly created a Performance SLA. Maybe you pointed it at 8.8.8.8 with ICMP, set a 200 ms latency threshold, and called it a day. That works, but it’s also leaving a lot on the table.
The Performance SLA engine is what gives SD-WAN its brains. It’s the difference between “load balance two ISPs” and “intelligently steer VoIP off the link that just developed 80 ms of jitter, while keeping bulk file transfers on the cheap circuit.” And the GUI only exposes three of the eight probe protocols available. The rest live in the CLI, and several of them are dramatically better tools for specific jobs than the defaults most engineers reach for.
This post walks through every probe type FortiOS supports, when each one earns its place in a design, and, just as important, when reaching for it is the wrong call.
The Foundation: What a Performance SLA Actually Does
Before we get into protocol selection, it’s worth being precise about what the SLA engine is measuring and how it uses those measurements.
A health check runs on each SD-WAN member interface independently. It sends probes to one or two configured servers and tracks three metrics: latency (round-trip time), jitter (variation in latency between probes), and packet loss. Those metrics are then evaluated against thresholds defined in config sla sub-blocks. The result of that evaluation, “in SLA” or “out of SLA” — is what SD-WAN rules use to make steering decisions.
Two things commonly trip people up here. First, the health check itself doesn’t steer traffic. It just produces a measurement. SD-WAN rules consume that measurement. Second, the server you probe needs to actually reflect the path you care about. Probing 8.8.8.8 tells you about the path to Google’s anycast network, which is fine if your traffic is going to the public internet, but it tells you almost nothing about whether your IPsec tunnel to the hub site is healthy.
That second point is the entire reason the CLI-only protocols exist.
The GUI Three: Ping, HTTP, and DNS
The GUI exposes Ping, HTTP, and DNS. These cover the majority of real-world deployments and are the right starting point for most designs.
Ping (ICMP) is the default for a reason. It’s lightweight, universally supported, and gives you clean latency and jitter measurements. The downside is that ICMP is often deprioritized or rate-limited on the public internet, which can produce phantom packet loss that has nothing to do with the actual quality of your data path. It’s also easy for any intermediate device or ISP to drop or deprioritize ICMP without affecting TCP/UDP traffic at all — meaning your SLA can scream “failure” while user traffic is running fine.
HTTP probes go further up the stack. They establish a TCP session, issue an HTTP GET, and wait for a response. This validates not just reachability but that something at the other end is actually serving traffic. Useful when you’re steering toward a SaaS endpoint and want to know the application layer is alive, not just that some router along the path will answer pings.
DNS probes send actual DNS queries (by default for example.com) to the configured server. They’re useful for validating recursive DNS reachability, which matters more than most people realize, because if your DNS path is broken, the user experience tanks regardless of whether the underlying transport is up.
Now for the ones the GUI doesn’t show you.
TCP-Echo and UDP-Echo
These probes use RFC 862 echo services. They’re not commonly enabled on internet-facing servers, so in practice you only use them when you control the responder, typically a FortiGate at the other end of an SD-WAN tunnel running as an echo responder, or a dedicated server in your DC.
config system sdwan
    config health-check
        edit "HUB_TCP_ECHO"
            set server "10.10.10.1"
            set detect-mode active
            set protocol tcp-echo
            set port 7
            set interval 500
            set probe-timeout 1000
            set failtime 5
            set recoverytime 10
            set members 1 2
            config sla
                edit 1
                    set link-cost-factor latency jitter packet-loss
                    set latency-threshold 100
                    set jitter-threshold 30
                    set packetloss-threshold 2
                next
            end
        next
    end
end
Use TCP-Echo when: You need to validate that a TCP path through a firewall, IPsec tunnel, or NAT device is genuinely healthy, not just that ICMP happens to be allowed. Stateful devices treat TCP very differently from ICMP, and a tunnel that passes pings perfectly can still have a broken TCP MSS configuration that breaks real traffic. TCP-Echo catches that.
Use UDP-Echo when: You’re measuring a path that will primarily carry UDP traffic, VoIP, video conferencing, gaming, DNS, and you want the probe to traverse the same QoS treatment as the real traffic. ISPs sometimes deprioritize UDP differently than TCP, and an ICMP probe won’t reveal that.
Don’t use either when: You don’t control the far end. Public servers almost never run echo services on port 7. If you try to probe 8.8.8.8 with TCP-Echo, you’ll get nothing back and the link will mark as down even though it’s perfectly fine.
TWAMP (Two-Way Active Measurement Protocol)
TWAMP is the heavyweight of the bunch. It’s an IETF standard (RFC 5357) specifically designed for measuring IP performance, with proper timestamping that produces far more accurate one-way and round-trip measurements than ICMP or TCP. It’s what carriers use internally to measure their own networks, and a number of MPLS and SD-WAN service providers expose TWAMP responders so customers can independently verify SLA compliance.
config system sdwan
    config health-check
        edit "CARRIER_TWAMP"
            set server "203.0.113.10"
            set detect-mode active
            set protocol twamp
            set port 862
            set security-mode none
            set password ENC <password_if_auth_mode>
            set interval 1000
            set probe-timeout 1000
            set probe-count 30
            set failtime 5
            set recoverytime 10
            set members 1
            config sla
                edit 1
                    set link-cost-factor latency jitter packet-loss
                    set latency-threshold 50
                    set jitter-threshold 10
                    set packetloss-threshold 1
                next
            end
        next
    end
end
The security-mode setting can be none or authentication; if your carrier requires authentication, set it accordingly and configure the shared password. Default port is 862.
Use TWAMP when: Your circuit provider supports a TWAMP responder and you want measurements that will actually hold up in an SLA dispute. Also use it when you need sub-millisecond accuracy, TWAMP’s protocol-level timestamping is significantly more precise than a userspace ping.
Don’t use TWAMP when: You don’t have a TWAMP responder to talk to. Unlike ping or HTTP, you can’t just point this at an arbitrary internet host. It also adds CPU overhead compared to ICMP, which matters on smaller FortiGates running many simultaneous health checks.
TCP-Connect
TCP-Connect is the quiet workhorse of the bunch. It opens a TCP connection to a specified port, measures how long that takes, and either tears the connection down cleanly (half-close) or drops it after the SYN-ACK (half-open). It works against any TCP service that’s listening, port 443 on a website, port 1433 on a SQL server, port 25 on a mail relay, without needing any cooperation from the far end beyond accepting the connection.
config system sdwan
    config health-check
        edit "SAAS_TCP_443"
            set server "salesforce.com"
            set detect-mode active
            set protocol tcp-connect
            set port 443
            set quality-measured-method half-close
            set interval 1000
            set probe-timeout 2000
            set failtime 5
            set recoverytime 10
            set members 1 2
            config sla
                edit 1
                    set link-cost-factor latency packet-loss
                    set latency-threshold 150
                    set packetloss-threshold 2
                next
            end
        next
    end
end
The quality-measured-method setting is worth understanding. half-open measures only the SYN/SYN-ACK exchange, fast, light, but more likely to look like a port scan to security devices in the middle. half-close completes the three-way handshake and then closes cleanly, which is friendlier to intermediate firewalls and IDS systems but produces slightly higher latency numbers.
Use TCP-Connect when: You’re steering traffic toward a specific TCP-based application (Office 365, Salesforce, an internal database, a SIP trunk on TCP). It measures the actual path TCP will take, including any middleboxes that handle TCP differently than ICMP.
Don’t use TCP-Connect when: The target application is UDP-based, you’ll be measuring the wrong path. Also avoid it for high-frequency probing against third-party endpoints; aggressive TCP-Connect probes can absolutely show up in someone else’s IDS as scanning activity. Keep the interval reasonable (1 second or longer) for anything you don’t own.
FTP
The FTP probe establishes a control connection on port 21 and validates that an FTP server is responding. It exists primarily for environments where FTP is still a critical business application and you need to ensure the path supports it end-to-end.
config system sdwan
    config health-check
        edit "PARTNER_FTP"
            set server "ftp.partner.example.com"
            set detect-mode active
            set protocol ftp
            set port 21
            set interval 5000
            set probe-timeout 3000
            set failtime 3
            set recoverytime 5
            set members 2
            config sla
                edit 1
                    set link-cost-factor latency packet-loss
                    set latency-threshold 200
                    set packetloss-threshold 5
                next
            end
        next
    end
end
Use FTP when: You have a legacy partner integration over FTP and the SD-WAN rule needs to steer traffic toward the link with a healthy FTP path. NAT and ALG handling for FTP is notoriously fragile, and probing it directly catches problems other probes miss.
Don’t use FTP when: You don’t actually have an FTP-dependent application. There’s no reason to use this probe for general internet reachability; you’re just generating noisy connections to someone’s FTP server.
Detect Modes: Active, Passive, and Prefer-Passive
Worth mentioning briefly because it’s another CLI-only knob that changes how the SLA engine behaves. The set detect-mode option controls whether the FortiGate is actively probing, passively observing real traffic, or doing both.
config system sdwan
    config health-check
        edit "PASSIVE_MONITOR"
            set detect-mode prefer-passive
            set protocol ping
            set server "10.1.1.1"
            set members 1 2
        next
    end
end
Active (the default) sends probes on a schedule regardless of traffic. Passive derives latency, jitter, and loss from observed TCP sessions traversing the link, no probes generated at all. Prefer-passive uses passive measurements when traffic is flowing and falls back to active probes when the link is idle.
Passive modes are useful on links where you want to minimize probe traffic (metered cellular, for instance), or where probing would skew real measurements. The trade-off is that without sufficient traffic, passive measurements are stale or unavailable, which is why prefer-passive often hits the sweet spot.
Putting It Together: A Practical Design Pattern
For most multi-circuit deployments, here’s a pattern that holds up well:
A lightweight ping health check against a reliable public anycast target (1.1.1.1, 8.8.8.8) serves as your link-up/link-down signal. It’s cheap and fast.
A TCP-Connect health check against the actual SaaS endpoints your users care about (Microsoft 365, your CRM, your VoIP provider) drives application-aware steering. This is what tells you whether the link is good for the traffic that matters, not whether ICMP happens to be passing.
If you control both ends, branch-to-hub, branch-to-DC, or a managed SD-WAN with TWAMP responders, layer in TWAMP or UDP-Echo for high-fidelity measurement of the overlay path itself, separate from the underlay.
Each of these can have its own SLA thresholds, and SD-WAN rules can reference whichever check is relevant to the traffic being steered. That’s the design unlock: stop treating the health check as a single “is the link up” question and start treating each probe as a specific measurement of a specific path for a specific kind of traffic.
A Few Operational Notes
When you’re testing and tuning, diagnose sys sdwan health-check shows you the current state of every health check including live latency, jitter, and loss values. diagnose sys sdwan service shows which SD-WAN rules are active and which member is selected. Those two commands answer 90% of “why isn’t traffic going where I expect” questions.
Be careful with probe intervals. The default of 500 ms is fine for one or two checks, but if you’re running ten health checks across four members at 500 ms intervals, that’s eighty probes per second leaving the box continuously. On smaller FortiGates or constrained links, that adds up. Tune intervals to match how quickly you actually need to detect a failure, for most applications, 1–2 second intervals with a failtime of 5 gives you sub-10-second failover without hammering the box.
And finally: every probe protocol is only as good as the server you point it at. The most common SD-WAN incident I’ve seen isn’t a failure of the SLA engine, it’s an SLA configured against a single server that itself went down, taking the link offline from FortiOS’s perspective when the link was perfectly fine. Always configure two health-check servers when the protocol allows it, and pick servers you trust to be more reliable than the circuits you’re monitoring.
The SD-WAN engine is genuinely impressive once you stop using it as a glorified failover and start using its measurement granularity. The CLI-only protocols are where most of that granularity lives.
Recent posts
-

-

DNS is one of those technologies that quietly underpins... Full Story
-

BGP issues on FortiGate firewalls usually trace back to... Full Story
-

Every time your laptop talks to your router, a... Full Story
-

If you've spent any time configuring NAT on a... Full Story
-

If you have spent any time configuring firewall policies... Full Story
-

High availability on FortiGate is one of those features... Full Story
-

If you've configured SD-WAN on a FortiGate, you've almost... Full Story
-

FortiLink is the management protocol that turns a FortiSwitch... Full Story
-

FortiSwitches are pretty rock solid from Mean Time Between... Full Story
-

This is a quicky tip. Have you ever gone... Full Story
-

DNS is one of those quiet pieces of internet... Full Story
-

This article is an updated version of the previous... Full Story
-

You will add ns2 as a secondary (slave) BIND9... Full Story
-

In the process of deploying my lab, I needed... Full Story
-

RFC 8805, used to be known as Self-Correcting IP... Full Story
-

Years back, I wrote an article about certificate pinning. ... Full Story
-

FortiGates have the ability to send alerts to Microsoft... Full Story
-

In this post, I am going to walk through... Full Story
-

Troubleshooting VoIP on a FortiGate can feel like trying... Full Story
-

Prior to FortiOS 7.0, there were three commands to... Full Story
-

In this post, I am going to go over... Full Story
-

What we are going to do: We are going... Full Story
-

Choosing between FGCP (FortiGate Clustering Protocol) and FGSP (FortiGate... Full Story
-

Creating a VLAN on macOS (The "Pro" Move) A... Full Story
-

This blog post explores the logic behind how macOS... Full Story
-

Pretty Fly for a Wi-Fi Tell My Wi-Fi Love... Full Story
-

Part of my daily gig is creating BoMs (Bill-of-Materials)... Full Story
-

ICMP introduces several security risks, but careful filtering, rate... Full Story
-

The command diag debug application dhcps -1 enables full... Full Story
-

In the world of FortiOS, execute tac report is... Full Story
-

LLDP; What is it The Link Layer Discovery Protocol... Full Story
-

What it actually does When you run diagnose fdsm... Full Story
-

Monkey Bites are bite-sized, high-impact security insights designed for... Full Story
-

I have run macOS in macOS with Parallels but... Full Story
-

Don't be confused with my other FortiNAC posts where... Full Story
-

This is the third session in a multi-part article... Full Story
-

Today I was configuring key-based authentication on a FortiGate... Full Story
-

Netcat, often called the "Swiss Army knife" of networking,... Full Story
-

At its core, IEEE 802.1X is a network layer... Full Story
-

In case you did not see the previous FortiNAC... Full Story
-

This is our 5th session where we are going... Full Story
-

Now that we have Wireshark installed and somewhat configured,... Full Story
-

The Philosophy of Packet Analysis Troubleshooting isn't about looking... Full Story
-

Do you use Sequence Groups In your Firewall Policies? ... Full Story
-

The other day, I opened my Wireshark for macOS... Full Story
-

1. Executive Summary Objective This guide walks through the... Full Story