
If you've spent any time configuring user authentication on... Full Story
By Manny Fernandez
September 3, 2026
FortiDebug Builder Preview
I created an app named FortiDebug Builder. The idea is to create cli commands for use with troubleshooting FortiGate firewalls. You can visually select the options you want and the tool will build the CLI commands you will need to run. You can either copy to clipboard to be pasted elsewhere, save to .txt to be sent, saved etc., and finally save for later where is stores it in the app.


Diagnose Sessions
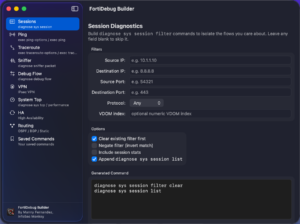
diagnose sys session – inspect live flows
Use this to find a live session matching source/destination/port/protocol/VDOM criteria. All filters combine with AND.
Fields
• Source IP / Destination IP — packet’s src/dst address.
• Source Port / Destination Port – L4 ports.
• Protocol – TCP (6), UDP (17), ICMP (1), GRE (47), ESP (50), or Any.
• VDOM index – numeric index (not name); check with diagnose sys vd list.
• Negate filter – inverts the match (show everything that does not match).
• Include session stats — appends diagnose sys session stat.
• Append session list – dump matching sessions after applying the filter.
Example output
diagnose sys session filter clear
diagnose sys session filter src 10.1.1.10
diagnose sys session filter dst 8.8.8.8
diagnose sys session filter proto 1
diagnose sys session list
Ping
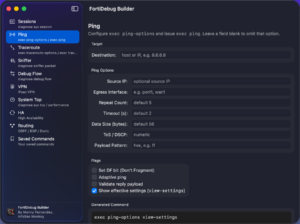
exec ping-options / exec ping
Configures ping parameters via exec ping-options, optionally shows the resulting configuration with view-settings, then runs exec ping.
Notable options
• Source IP – pick the source address (useful with policy-based routing or SD-WAN).
• Egress Interface – force the outgoing interface.
• DF bit – required for path-MTU testing.
• Data Size — set to 1472 for a classic 1500-byte MTU test.
• Adaptive ping – send as fast as possible; use carefully in production.
PMTU-discovery example
exec ping-options source 10.1.1.1
exec ping-options df-bit yes
exec ping-options data-size 1472
exec ping-options view-settings
exec ping 8.8.8.8
Traceroute
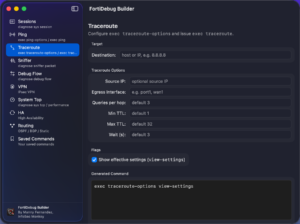
exec traceroute-options / exec traceroute
Same shape as Ping: configure with exec traceroute-options, optionally verify with view-settings then
run “exec traceroute“.
Notable options
• Egress Interface — force the outgoing interface (mostly useful in multi-WAN deployments).
• Queries per hop – number of probes at each TTL
• Max TTL – increase for long paths.
Sniffer
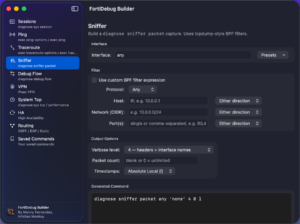
diagnose sniffer packet — with pcap-style filters
Runs a packet capture on one or more FortiGate interfaces using topdump/BPF filter syntax.
Interface
• Type any interface name – the field is free-text so port1.20, vlan100, guest-wifi, etc. all work.
• Presets menu offers common names, and lets you save your own via Add Custom Interface… – saved names persist across launches.
• Save Current as Custom… – pre-fills the sheet with whatever’s in the text field.
Verbose levels (0– 6“)
• 1 – headers only
• 2 – headers + IP data
• 3 – headers + Ethernet data
• 4 – headers + interface names (default)
• 5 – IP data + interface names
• 6 – Ethernet data + interface names (full pcap)
Filter – simple vs BPF mode
With Use custom BPF filter expression off, the app shows a simple builder with Host / Network / Port / Protocol and a src/dst/either selector for each.
Turn the toggle on to get the BPF Builder: presets for common expressions and a snippet builder for BPF-only primitives (MAC address, VLAN, TCP flags, ICMP types, ether/ip proto numbers). Snippets are combined with your chosen AND/OR operator, optionally wrapped in parens, and optionally negated.
BPF Builder controls
• Presets – one-click TCP SYN, TCP RST, New TCP (SYN without ACK), ICMP ping, ARP, VLAN, IPv6, Broadcast, Multicast.
• Snippet type – Host / Network / Port / Protocol / Ethernet host / VLAN / TCP flag / ICMP type / Ether
broadcast / Ether multicast / IP version / Ether protocol # / IP protocol #.
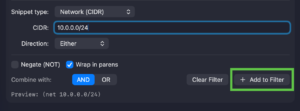
• Negate – wraps the fragment as not (…).
• Wrap in parens – protects operator precedence when combining.
• Combine with – AND / OR used when appending onto an existing expression.
• Add to Filter (s4) – appends the current snippet; Clear Filter empties the text field.
Example
diagnose sniffer packet any '(tcp) and (src host 10.0.0.1) and ((dst port 80 or dst port 443))' 401
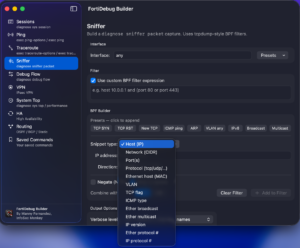
In the BPF builder, you can choose from many snippet, as you do, you can then add them to the filter
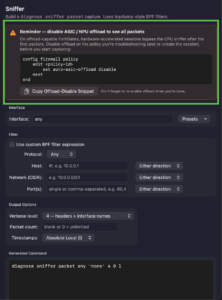
At the request of my coworker Rob Scherer, I added the disable the auto-offload disable to be able to capture packet normally offloaded to the ASIC.
Flows
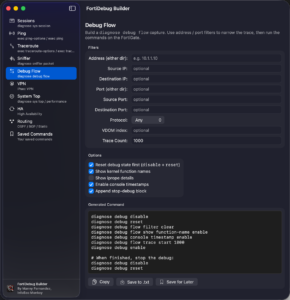
diagnose debug flow — trace packet path through kernel
Debug Flow shows exactly how the FortiGate handles a packet: routing lookup, policy match, session creation, NAT, UTM inspection, and forwarding decisions. It’s the go-to for “why is this traffic being denied?” investigations.
Recommended flow
• Enable Reset debug state first so old filters don’t leak in.
• Set narrow address / port / protocol filters – an unfiltered flow trace on a busy box floods the console.
• Set a Trace Count (default 1000) to bound output.
• Enable Console timestamps for correlating with pcaps.
• Keep Append stop-debug block on so you never leave debug running.
• Generate a triggering flow (e.g. a ping / TCP connect) from the client side while the debug is active.
VPN
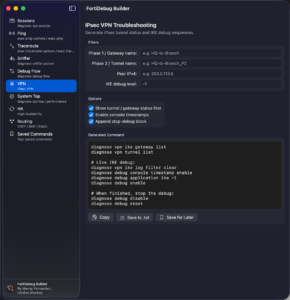
diagnose vpn ike / tunnel + IKE debug
Combines status-inspection (ike gateway list, tunnel list“) with a live IKE debug (diagnose debug application ike -1).
Use the filters to scope the debug to one peer so the output stays manageable.
Filters
• Phase 1/ Gateway name – appears in your VPN config (config vpn ipsec phase1-interface).
• Phase 2 / Tunnel name – usually <phase1>_P2 or your custom P2 name.
• Peer IPv4 — the remote gateway address; useful when Phase 1 uses a dynamic name.
• IKE debug level – -1 prints everything (default). Lower to reduce noise.
System Top
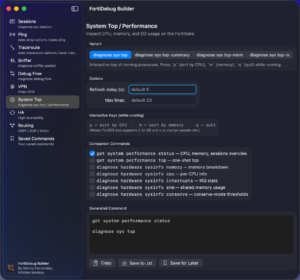
diagnose sys top – CPU, memory, and I/0 usage
Variants
• diagnose sys top – interactive process list. Press p to sort by CPU, m by memory, q to quit.
• diagnose sys top-summary – the same but also groups process counts by state.
• diagnose sys top-mem – one-shot snapshot sorted by memory (great for leak hunts).
• diagnose sys top-io – sorted by disk/flash I/O (newer FortiOS).
Options
• Refresh delay – seconds between updates (default 5). Ignored for top-mem.
• Max lines — number of processes shown (default 20).
Companion commands
Enable any of the toggles to prepend a snapshot of get system performance status, hardware CPU/memory/interrupt/shm info, or conserve-mode thresholds. Useful to capture context before diving into a live top”
System Top
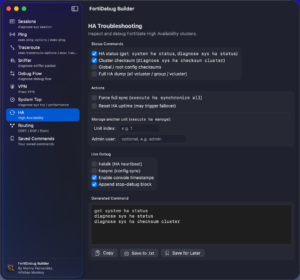
Cluster status, checksums, and live sync/talk debug
Status commands
• HA status – get system ha status + diagnose sys ha status.
• Cluster checksum — detect out-of-sync members with diagnose sys ha checksum cluster.
• Global / root checksums – narrow the mismatch to a config scope.
• Full HA dump – group / vcluster dumps for deep inspection.
Actions
• Force full sync – execute ha synchronize all (safe, triggers a re-sync).
• Reset HA uptime – may trigger a failover; only run when you intend to change the primary.
• Manage another unit – execute ha manage <index› [<admin>] to SSH-hop into another cluster member.
Live debug
• hatalk – heartbeat traffic between members.
• hasync — config synchronization between members.
Routing
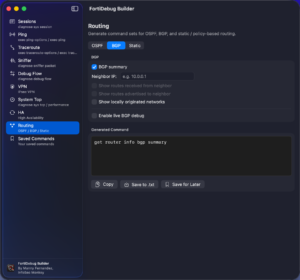
OSPF • BGP • Static
OSPF
• Show status / neighbors / interfaces / LSDB / OSPF routes.
• Live debug enables diagnose ip router ospf all enable + level info — very verbose; use short bursts.
BGP
• Summary for a health snapshot.
• Enter a Neighbor IP to enable routes and advertised-routes toggles for that peer.
• Locally originated networks – get router info bgp network.
• Live debug – pair with a specific neighbor to reduce output volume.
Static / RIB
• Static routes – configured static-route table.
• Full RIB – merged view across all protocols.
• RIB database – includes hidden/backup routes.
• Policy-based routes — diagnose firewall proute list (v4 + v6).
• Lookup destination – appends get router info routing-table details ‹ ip> for a forwarding decision on a specific IP.
Saved Commands
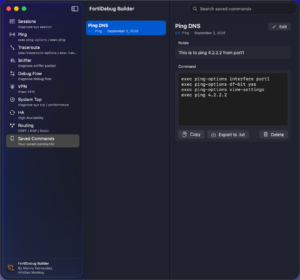
Store, edit, search, and export
Any command you save via Save for Later lands here. Entries are persisted in “UserDefaults” and survive relaunches.
What you can do
• Search – filters by title, category, notes, or the command text.
• Edit – rename an entry and edit its notes at any time.
• Copy / Export to txt – same actions as the generator panel.
• Delete – permanent; a confirmation dialog runs first.
• Context menu – right-click any list row for quick Copy / Export / Delete.
Be on the lookout for it in the Mac App Store . Should be published sometime next month.
Recent posts
-

-

DNS is one of those technologies that quietly underpins... Full Story
-

BGP issues on FortiGate firewalls usually trace back to... Full Story
-

Every time your laptop talks to your router, a... Full Story
-

If you've spent any time configuring NAT on a... Full Story
-

If you have spent any time configuring firewall policies... Full Story
-

High availability on FortiGate is one of those features... Full Story
-

If you've configured SD-WAN on a FortiGate, you've almost... Full Story
-

FortiLink is the management protocol that turns a FortiSwitch... Full Story
-

FortiSwitches are pretty rock solid from Mean Time Between... Full Story
-

This is a quicky tip. Have you ever gone... Full Story
-

DNS is one of those quiet pieces of internet... Full Story
-

This article is an updated version of the previous... Full Story
-

You will add ns2 as a secondary (slave) BIND9... Full Story
-

In the process of deploying my lab, I needed... Full Story
-

RFC 8805, used to be known as Self-Correcting IP... Full Story
-

Years back, I wrote an article about certificate pinning. ... Full Story
-

FortiGates have the ability to send alerts to Microsoft... Full Story
-

In this post, I am going to walk through... Full Story
-

Troubleshooting VoIP on a FortiGate can feel like trying... Full Story
-

Prior to FortiOS 7.0, there were three commands to... Full Story
-

In this post, I am going to go over... Full Story
-

What we are going to do: We are going... Full Story
-

Choosing between FGCP (FortiGate Clustering Protocol) and FGSP (FortiGate... Full Story
-

Creating a VLAN on macOS (The "Pro" Move) A... Full Story
-

This blog post explores the logic behind how macOS... Full Story
-

Pretty Fly for a Wi-Fi Tell My Wi-Fi Love... Full Story
-

Part of my daily gig is creating BoMs (Bill-of-Materials)... Full Story
-

ICMP introduces several security risks, but careful filtering, rate... Full Story
-

The command diag debug application dhcps -1 enables full... Full Story
-

In the world of FortiOS, execute tac report is... Full Story
-

LLDP; What is it The Link Layer Discovery Protocol... Full Story
-

What it actually does When you run diagnose fdsm... Full Story
-

Monkey Bites are bite-sized, high-impact security insights designed for... Full Story
-

I have run macOS in macOS with Parallels but... Full Story
-

Don't be confused with my other FortiNAC posts where... Full Story
-

This is the third session in a multi-part article... Full Story
-

Today I was configuring key-based authentication on a FortiGate... Full Story
-

Netcat, often called the "Swiss Army knife" of networking,... Full Story
-

At its core, IEEE 802.1X is a network layer... Full Story
-

In case you did not see the previous FortiNAC... Full Story
-

This is our 5th session where we are going... Full Story
-

Now that we have Wireshark installed and somewhat configured,... Full Story
-

The Philosophy of Packet Analysis Troubleshooting isn't about looking... Full Story
-

Nmap Scripting Engine (NSE): From One-Liners to Your First... Full Story
-

Stand up TRex on Ubuntu, wire it through a... Full Story
-

1. Executive Summary Objective: Get a working, persistent nftables... Full Story