
If you've spent any time configuring user authentication on... Full Story
By Manny Fernandez
September 14, 2026
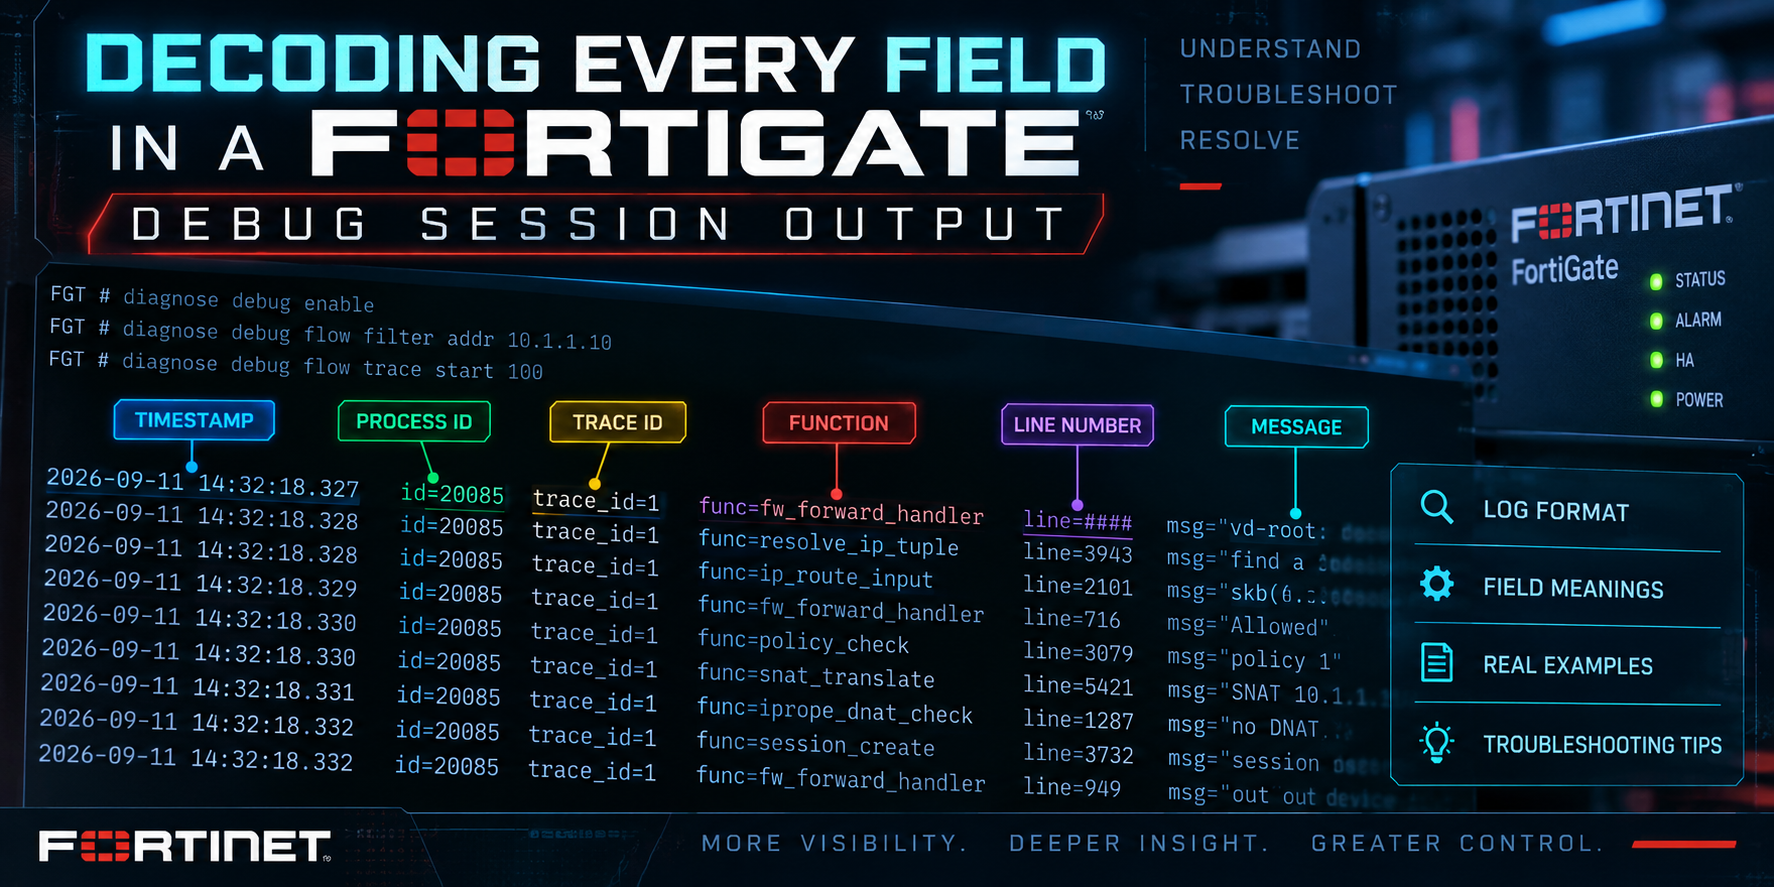
Decoding Every Field in a FortiGate Debug Session Output
When something is behaving strangely on a FortiGate, whether that is a session that will not offload, NAT that looks wrong, or traffic that mysteriously stops matching a policy after a config change, the session table is usually where the real answer lives. diagnose sys session list dumps every field FortiOS tracks for a session: protocol state, NAT translation, policy match, hardware offload status, and a dozen other things that never show up in a traffic log.
The problem is that the output is dense. It is one long wall of key=value pairs with almost no spacing to guide the eye, and several of the fields (state=, npu_state=, no_ofld_reason:) are themselves compressed codes for something bigger. This guide walks through every field in that output, group by group, so you can look at a session dump and actually reconstruct the story of what happened to that connection.
The command, and a baseline example
Before pulling a dump, filter it. An unfiltered diagnose sys session list on a busy FortiGate can return thousands of lines.
diagnose sys session filter clear
diagnose sys session filter src 10.20.30.100
diagnose sys session filter dst 198.18.5.10
diagnose sys session list
Useful filter keys include src, dst, sport, dport, proto, policy, vd, sintf, and dintf. Always run diagnose sys session filter clear first, and again when you are done, so a stale filter does not hide sessions on your next pass.
Here is a single session entry that this guide will keep coming back to. The addresses use the lab convention from this site’s other guides (198.18.0.0/15 for the public/transit side, 10.0.0.0/16 for the internal LAN):
diagnose sys session list
session info: proto=6 proto_state=01 duration=42 expire=3558 timeout=3600 flags=00000000 sockflag=00000000 sockport=0 av_idx=0 use=3
origin-shaper=
reply-shaper=
per_ip_shaper=
class_id=0 ha_id=0 policy_dir=0 tunnel=/ helper=none vlan_cos=0/255
state=may_dirty npu log
statistic(bytes/packets/allow_err): org=1240/9/0 reply=8460/11/0 tuples=2
speed(Bps/kbps): 210/1
orgin->sink: org pre->post, reply pre->post dev=5->6/6->5 gwy=198.18.1.1/0.0.0.0
hook=post dir=org act=snat 10.20.30.100:51322->198.18.5.10:443(198.18.1.1:51322)
hook=pre dir=reply act=dnat 198.18.5.10:443->198.18.1.1:51322(10.20.30.100:51322)
pos/(before,after) 0/(0,0), 0/(0,0)
src_mac=00:0c:29:5a:11:7b
misc=0 policy_id=4 pol_uuid_idx=2114 auth_info=0 chk_client_info=0 vd=0
serial=0000a7c2 tos=ff/ff app_list=0 app=0 url_cat=0
dd_type=0 dd_mode=0
npu_state=0x000c00
npu info: flag=0x81/0x81, offload=8/8, ips_offload=0/0, epid=140/138, ipid=138/140, vlan=0x0000/0x0000
This is an internal client browsing to an HTTPS server on the outside, fully hardware accelerated after the first few packets. Every field in it, and several that only appear in other scenarios, are covered below.
Line 1: proto_state, timers, and the flag words
session info: proto=6 proto_state=01 duration=42 expire=3558 timeout=3600 flags=00000000 sockflag=00000000 sockport=0 av_idx=0 use=3
proto: the IP protocol number. The ones you will see constantly are 6 (TCP), 17 (UDP), 1 (ICMP), and 132 (SCTP).
proto_state: a two digit code showing where the session sits in its protocol state machine. The first digit is the server side or inspection side state (it stays 0 unless the session is subject to flow or proxy based inspection); the second digit is the client side state. For TCP, the second digit maps to:
| Value | State | Default expire timer |
|---|---|---|
| 0 | NONE | 10s |
| 1 | ESTABLISHED | 3600s (session-ttl) |
| 2 | SYN_SENT | 10s (tcp-halfopen-timer) |
| 3 | SYN and SYN/ACK seen | 10s (tcp-halfopen-timer) |
| 4 | FIN_WAIT | 120s (tcp-halfclose-timer) |
| 5 | TIME_WAIT | 1s |
| 6 | CLOSE | 10s |
| 7 | CLOSE_WAIT | 120s (tcp-halfclose-timer) |
| 8 | LAST_ACK | 30s |
| 9 | LISTEN | 120s |
So proto_state=01 reads as “no inspection state applied, and the TCP handshake completed.” proto_state=11 on the same connection usually means proxy based inspection is in play and the client side of that proxied connection is also established.
UDP only tracks two states even though the protocol itself is stateless: 0 for “no reply seen yet” and 1 for “reply seen.” ICMP has no state machine at all, it is always proto_state=00. SCTP gets its own eight value state machine (SCTP_S_NONE through SCTP_S_SHUTDOWN_ACK_SENT), which mirrors the association setup and teardown handshake rather than TCP’s.
duration: seconds the session has existed.
expire: a countdown, in seconds, until the session is removed if nothing refreshes it. This resets on qualifying traffic.
timeout: the ceiling expire counts down from for the session’s current state, generally driven by the values above or by the service/policy timeout configuration.
flags: a session level bitmask. In the overwhelming majority of dumps this reads 00000000; a nonzero value signals an internal condition rather than something you configured directly, and it is rarely worth decoding bit by bit outside of a TAC escalation.
sockflag and sockport: socket level bitmask and the local port bound to a kernel socket. These stay at 0 for ordinary flow based sessions and only populate for sessions that terminate on a FortiGate process, proxy sessions, explicit proxy, SSL VPN, and similar.
av_idx: the internal AV/UTM database index applied to the session, 0 when no AV profile is scanning the traffic.
use: an internal reference count on the session object. Not something you act on; a nonzero, small number is normal.
Shapers, classification, and tunnel identity
origin-shaper=
reply-shaper=
per_ip_shaper=
class_id=0 ha_id=0 policy_dir=0 tunnel=/ helper=none vlan_cos=0/255
origin-shaper and reply-shaper: the name and live counters of any traffic shaper profile applied in each direction. Empty means no shaper is bound to this session. When one is active, this line expands to show the shaper’s priority, guaranteed and maximum bandwidth, current traffic rate, and drops, all inline.
per_ip_shaper: same idea, for a per IP shaper policy.
class_id: the traffic class ID assigned by a shaper, 0 when none applies.
ha_id: an internal HA session identifier, mostly relevant when correlating sessions across a cluster.
policy_dir: 0 for the original direction of the flow, 1 for the reply direction. You will see this again lower in the dump against the NAT hook lines.
tunnel: the VPN tunnel name this session is riding, formatted as <phase1 name> or /<phase1 name> depending on direction. An empty tunnel=/ means the session is not inside an IPsec tunnel at all.
helper: the name of a session helper handling this session, for protocols like FTP, RTSP, SIP, TFTP, and PPTP that need extra parsing beyond a simple 5-tuple match. Absent or unset for ordinary sessions.
vlan_cos: the ingress class of service value. Values 0 through 7 reflect what actually appeared on the wire; values 8 through 15 mean an administrative COS override is in play. 255 (or /255) on either side means no COS is set.
The state= line: reading the flag string
state=may_dirty npu log
This is the field that tells you the most about what is actually happening to a session, and it is just a space separated list of short flag words. Here is the full set you will encounter:
| Flag | Meaning |
|---|---|
| may-dirty | The session is allowed to be marked dirty and revalidated later. |
| dirty | A config change means this session must be revalidated by FortiOS before more offload can happen. |
| npu | The session is (or was) processed by the NP hardware offload chip. |
| npd | The session is explicitly denied hardware offload. |
| npr | The session is eligible for offload; check the npu info line for the current offload state. |
| rem | The session may be reset if the device hits a memory shortage. |
| eph | The session is ephemeral. |
| oe | This session is the IPsec tunnel’s originator side. |
| re | This session is the IPsec tunnel’s responder side. |
| local | The session terminates on the FortiGate’s own IP stack (management access, SSL VPN portal, explicit proxy, and similar). |
| br | The session is bridged; the VDOM is running in transparent mode. |
| redir | The session is redirected into an internal FortiGate proxy. |
| wccp | The session is intercepted by the WCCP process. |
| nlb | The session came in through a load balancing VIP. |
| log | The session is being logged. |
| log-start | The session logs both a start event and an end event, so expect two traffic log entries for this one connection. |
| os | Shaped in the original direction. |
| rs | Shaped in the reply direction. |
| ndr | Inspected by an IPS signature. |
| nds | Inspected by an IPS anomaly detector. |
| auth | Subject to authentication. |
| authed | Authentication for this session already succeeded. |
| block | Re-evaluated to a block outcome after a policy change. |
| ext | Handled by a session helper (deprecated flag, superseded by complex). |
| app_ntf | Matched a policy with block notification enabled. |
| f00 | Traffic logging is enabled on the matching policy. |
| pol_sniff | Packet capture is enabled on the matching policy. |
| rst_tcp | The matching policy has timeout-send-rst enabled. |
| synced | Synced to HA peers from a session pickup enabled primary. |
| syn_ses | Received via HA sync onto a session pickup enabled secondary. |
| need_sync | Queued for HA sync once it reaches roughly 30 seconds of lifetime. |
| complex | Handled by a session helper. |
| app_valid | Application control identified an app for this session (see the app= field). |
| intree | A child session created by a helper such as SCTP, RPC, SIP, or FTP; it shares its parent’s serial number. |
| hlife | Matches a policy with schedule-timeout enabled, so the session closes when the active schedule ends. |
| cap | Requested captive portal authentication. |
A session showing state=may_dirty npu log is a normal, healthy, hardware accelerated session that is also being logged and is allowed to be revalidated if the configuration changes underneath it. A session showing state=dirty right now, versus may_dirty, means a config change already happened and FortiOS has to walk this specific session through validation again before it can offload further traffic; that is the single most common reason a “should be offloaded” session is temporarily running through the CPU.
Traffic counters
statistic(bytes/packets/allow_err): org=1240/9/0 reply=8460/11/0 tuples=2
speed(Bps/kbps): 210/1
statistic: byte, packet, and allow/error counts for each direction. org= is the originating direction, reply= is the return direction. The third number in each triplet counts allowed versus errored packets, so 0 at the end is the healthy case.
tuples: the number of 5-tuple entries associated with this session. It is normally 2 (one for each direction); NAT64/NAT46 sessions and some helper driven sessions carry more.
speed: instantaneous throughput in bytes per second and kilobits per second. Some output shows one combined speed() line, other output splits it into tx speed() and rx speed().
Path, interfaces, and NAT translation
orgin->sink: org pre->post, reply pre->post dev=5->6/6->5 gwy=198.18.1.1/0.0.0.0
hook=post dir=org act=snat 10.20.30.100:51322->198.18.5.10:443(198.18.1.1:51322)
hook=pre dir=reply act=dnat 198.18.5.10:443->198.18.1.1:51322(10.20.30.100:51322)
pos/(before,after) 0/(0,0), 0/(0,0)
src_mac=00:0c:29:5a:11:7b
orgin->sink: shorthand for where in the packet processing pipeline each direction sits. Stages you will see include pre (before NAT), in (into the local stack), out (out of the local stack), post (after NAT), and nataf (used for NAT46/NAT64 handoff between address families). org pre->post, reply pre->post describes an ordinary through-traffic session; org pre->in, reply out->post is the signature of a local-in session terminating on the FortiGate itself.
dev: the interface index pair the session is riding, written <org-in>-><org-out>/<reply-in>-><reply-out>. Resolve the numbers with diagnose netlink interface list, which maps each index back to an interface name.
gwy: the next hop gateway for each direction, destination side first, then source side. A 0.0.0.0 on one side usually means that gateway has not been resolved yet, which is normal immediately after session creation.
hook / dir / act: these lines are the actual NAT translation. Format is <source>:<port>-><destination>:<port>(<translated-ip>:<translated-port>).
– hook=pre fires before NAT is applied; hook=post fires after.
– dir=org is the initiating direction, dir=reply is the return direction.
– act=noop means no translation happened on this leg, act=snat rewrites the source address, act=dnat rewrites the destination address.
In the baseline example, the hook=post dir=org act=snat line shows the internal client’s real address 10.20.30.100:51322 being source-NATted to 198.18.1.1:51322 as it leaves toward 198.18.5.10:443. The paired hook=pre dir=reply act=dnat line is the mirror image on the way back in. Whenever NAT looks wrong on the wire, these two lines are the fastest way to see exactly which address the FortiGate substituted and at which stage.
pos/(before,after): internal position counters used for reassembly and out-of-order handling. Rarely need direct interpretation.
src_mac: the source MAC address FortiOS learned for the session’s originating direction, useful for tracing a session back to a specific NIC or confirming which upstream device actually sent the traffic.
Identity, policy match, and VDOM
misc=0 policy_id=4 pol_uuid_idx=2114 auth_info=0 chk_client_info=0 vd=0
misc: an internal flag field, generally 0 and not something you interpret directly.
policy_id: the firewall policy ID that accepted this session. policy_id=0 on a session usually means it is a local-in/local-out session that was not matched against an ordinary firewall policy at all.
pol_uuid_idx (sometimes shown as id_policy_id): an internal index tied to the policy’s UUID, used for policy lookups distinct from the numeric policy ID shown in the GUI.
auth_info: 1 if the session is carrying authentication data (an authenticated user identity attached to it), 0 if not.
chk_client_info: whether client reputation/device information has been checked for this session.
vd: the VDOM index handling the session, resolvable with diagnose sys vd list. On a FortiGate using VRF, this can show as vd=0:20, where 0 is the VDOM index and 20 is the VRF ID.
Session bookkeeping and classification IDs
serial=0000a7c2 tos=ff/ff app_list=0 app=0 url_cat=0
dd_type=0 dd_mode=0
serial: the session’s unique identifier. Child sessions created by a helper inherit their parent’s serial, which is how you tie a helper-spawned data channel back to its control channel.
tos: the type of service/DSCP byte associated with the session. This shows up either because a policy is configured to override tos/dscp on the wire, or because a proxy based feature is caching the original packet’s tos/dscp so it can reapply it to packets the proxy itself generates.
ips_view: an internal flag for whether IPS is actively inspecting the session’s content.
app_list: the ID of the application control list/profile applied, 0 if none.
app: the application signature ID FortiOS identified for this session, 0 if nothing has been identified yet or application control is not enabled on the matching policy. Look it up with get application name status | grep "<id>" -B 1 -A 11.
url_cat: the FortiGuard web filter category ID matched for this session’s destination, 0 if unrated or not applicable. The category numbers span groups like Potentially Liable (drug abuse, hacking, explicit violence), Bandwidth Consuming (streaming, P2P, file sharing), and General Interest (business, education, social networking, shopping); the full current list lives in FortiGate’s FortiGuard web filter category documentation since Fortinet periodically adds categories.
dd_type / dd_mode: device detection type and mode, tied to FortiOS’s device identification engine rather than anything policy related.
Depending on the FortiOS version and feature set enabled, you may also see rpdb_link_id and rpdb_svc_id (policy routing / SD-WAN rule linkage), sdwan_mbr_seq and sdwan_service_id (which SD-WAN member and service rule steered this session), and ngfwid (an NGFW policy mode identifier, often n/a outside of policy-based NGFW mode).
Hardware offload: npu_state, npu info, and no_ofld_reason
This is the section that answers “is this session actually being hardware accelerated, and if not, why not.”
npu_state=0x000c00
npu info: flag=0x81/0x81, offload=8/8, ips_offload=0/0, epid=140/138, ipid=138/140, vlan=0x0000/0x0000
npu_state: an internal hex bitmask describing the session’s offload state machine. It is mostly useful as a quick “zero or not” check; the npu info and no_ofld_reason lines below give you the human readable version of the same information.
npu info: appears whenever a session has been through the NP6/NP7 offload evaluation. Each value is shown as <original-direction>/<reply-direction>:
– flag: 0x81 means ordinary traffic, 0x82 means IPsec traffic.
– offload: 8/8 shows the session is fully offloaded to the NP processor in both directions; a 0 on either side means that direction is not currently offloaded.
– ips_offload: whether IPS pattern matching itself has been offloaded (IPSA), separate from the base session offload.
– epid / ipid: internal endpoint and interface identifiers used by the NP chip to route the session in hardware.
– vlan: the VLAN tag, if any, attached at the NP level.
– vlifid / vtag_in, in_npu / out_npu, fwd_en, qid: on platforms with multiple NP chips or link aggregation, these show which physical NP chip and queue the original and reply direction packets are landing on. Mismatched in_npu/out_npu values are normal on some LAG topologies; wildly different values across many sessions can point at uneven NP distribution worth investigating separately.
no_ofld_reason: appears only when a session normally eligible for offload currently is not offloaded. More than one reason can be listed together.
| no_ofld_reason | What it means |
|---|---|
| dirty | A routing, policy, interface, or ARP change means the session must be revalidated before it can offload again; traffic still passes, just through the CPU in the meantime. |
| local | This is a local-in or local-out session (management access, SSL VPN portal, explicit proxy) that can never be offloaded. |
| disabled-by-policy | The matching firewall policy has auto-asic-offload disabled, or one of the session’s interfaces is a software switch member. |
| non-npu-intf | One of the session’s interfaces is not NP accelerated, is part of a software switch, or fastpath is disabled under config system npu. |
| npu-flag-off | Offload is blocked by a hardware or software limitation for this traffic type, for example an EMAC VLAN interface or a protocol that offload does not yet support on this platform/version. |
| redir-to-ips | The session should be offloaded via IPS but currently is not; if this appears unexpectedly, treat it as a signal to check for a bug on your running version. |
| denied-by-nturbo | An IPS-processed session that would normally offload is not supported by nTurbo. |
| block-by-ips | An IPS-processed session that would normally offload is currently blocked from offloading. |
| intf-dos | The session matched an interface policy or DoS policy, and sessions on those policy types are never offloaded. |
| redir-to-av | Flow based antivirus is actively preventing offload of this session. |
| sflow | sFlow sampling is enabled on one or both interfaces, and that sampling has to run on the CPU. |
| mac-host-check | Device identification has not finished identifying the endpoint yet; offload can resume once it has. |
| offload-denied | Usually appears when a session helper is handling the session and that helper’s sessions cannot be offloaded. |
| not-established | The TCP session has not reached proto_state=01 (ESTABLISHED) yet. |
Reading the whole story: three worked examples
Example 1: the baseline session above. proto_state=01 says the TCP handshake is complete. state=may_dirty npu log says it is a normal, loggable session eligible for offload. The npu info line confirms offload=8/8 in both directions, so this connection is fully hardware accelerated after its first few packets went through the CPU to establish the session. The SNAT/DNAT hook lines confirm the internal host is going out through the FortiGate’s own public address.
Example 2: a session that will never offload.
session info: proto=6 proto_state=01 duration=12 expire=3588 timeout=3600 flags=00000000 sockflag=00000000 sockport=0 av_idx=0 use=3
origin-shaper=
reply-shaper=
per_ip_shaper=
ha_id=0 policy_dir=0 tunnel=/ vlan_cos=8/8
state=local may_dirty
statistic(bytes/packets/allow_err): org=6210/14/1 reply=7940/12/1 tuples=2
speed(Bps/kbps): 512/4
orgin->sink: org pre->in, reply out->post dev=5->0/0->5 gwy=198.18.1.1/0.0.0.0
hook=pre dir=org act=noop 198.18.2.44:60712->198.18.1.1:443(0.0.0.0:0)
hook=post dir=reply act=noop 198.18.1.1:443->198.18.2.44:60712(0.0.0.0:0)
misc=0 policy_id=0 auth_info=0 chk_client_info=0 vd=0
serial=0000b410 tos=ff/ff app_list=0 app=0 url_cat=0
npu_state=00000000
no_ofld_reason: local
Two fields tell you everything here before you even reach the bottom line: state=local and the org pre->in, reply out->post path. This traffic is going into the FortiGate’s own IP stack, in this case an admin hitting the GUI on port 443, not through it. policy_id=0 confirms there is no firewall policy in play at all. The no_ofld_reason: local line at the end is not a problem to fix; local sessions are never offload candidates by design.
Example 3: a session inside an IPsec tunnel.
session info: proto=6 proto_state=01 duration=61 expire=3539 timeout=3600 flags=00000000 sockflag=00000000 sockport=0 av_idx=0 use=3
origin-shaper=
reply-shaper=
per_ip_shaper=
ha_id=0 policy_dir=0 tunnel=/branch-doral
state=re may_dirty npu
statistic(bytes/packets/allow_err): org=980/6/0 reply=980/6/0 tuples=2
orgin->sink: org pre->post, reply pre->post dev=9->7/7->9 gwy=10.20.1.1/10.20.30.5
hook=pre dir=org act=noop 10.20.30.100:56010->10.20.30.5:80(0.0.0.0:0)
hook=post dir=reply act=noop 10.20.30.5:80->10.20.30.100:56010(0.0.0.0:0)
misc=0 policy_id=12 pol_uuid_idx=8804 auth_info=0 chk_client_info=0 vd=0
serial=0000c119 tos=ff/ff app_list=0 app=0
npu_state=00000000
npu info: flag=0x81/0x82, offload=8/8, ips_offload=0/0, epid=1/3, ipid=3/1, vlan=32779/0
tunnel=/branch-doral immediately tells you this is site-to-site traffic riding a phase 1 named branch-doral. The re flag in state= says this FortiGate is the tunnel’s responder side for this session. Both hook= lines show act=noop because there is no NAT here, this is a route-based VPN passing traffic between two private subnets unchanged. The giveaway that this is specifically IPsec offload, not plain traffic offload, is flag=0x82 in the npu info line; a value of 0x81 there would mean regular, non-IPsec traffic even on a session inside a tunnel= field.
Quick reference
| Field | One-line meaning |
|---|---|
| proto | IP protocol number (6=TCP, 17=UDP, 1=ICMP, 132=SCTP) |
| proto_state | Two-digit state machine position; see the per-protocol tables above |
| duration / expire / timeout | Session age, countdown to removal, and the ceiling that countdown resets to |
| use | Internal reference count on the session object |
| tunnel | Phase 1 name if this session is inside an IPsec tunnel |
| helper | Session helper handling this connection, if any |
| state= | Space-separated flag list describing session behavior and offload eligibility |
| statistic | Bytes/packets/allow-err counters per direction |
| dev / gwy | Interface index pair and next-hop gateway per direction |
| hook/dir/act | The actual NAT translation applied at each pipeline stage |
| src_mac | Learned source MAC for the originating direction |
| policy_id | Firewall policy ID that matched (0 for local-in/out sessions) |
| vd | VDOM index (and VRF ID, if configured) |
| serial | Unique session identifier; shared by helper-spawned child sessions |
| app / url_cat | Application control and web filter category matches |
| npu_state / npu info | Hardware offload bitmask and human-readable offload detail |
| no_ofld_reason | Why an eligible session is not currently offloaded |
Common questions this output answers
Why isn’t this session hardware offloaded? Check no_ofld_reason first; it names the specific blocker. If it is absent but npu info shows offload=0/0, look for npd in state= (explicitly denied) versus npr (eligible, just not there yet).
Why does NAT look wrong for this connection? Read the two hook= lines directly. They show exactly which address got substituted, at which stage (pre or post), and in which direction. This is more reliable than trying to infer NAT behavior from a traffic log alone.
Why is this connection generating two log entries instead of one? Look for log-start in state=. That flag means the policy is configured to log both session start and session end, by design.
Why did a policy or routing change not seem to take effect on existing traffic? Existing sessions do not automatically re-evaluate against a changed policy or route. Look for dirty (already flagged for revalidation) versus may_dirty (allowed to be revalidated but not yet triggered) in state=. If a session needs to pick up a change immediately, diagnose sys session filter plus diagnose sys session clear forces it to rebuild against current policy.
Is this traffic actually inside the VPN, or just routed alongside it? The tunnel= field is the definitive answer; an empty tunnel=/ means no, regardless of what the routing table implies.
Recent posts
-

-

DNS is one of those technologies that quietly underpins... Full Story
-

BGP issues on FortiGate firewalls usually trace back to... Full Story
-

Every time your laptop talks to your router, a... Full Story
-

If you've spent any time configuring NAT on a... Full Story
-

If you have spent any time configuring firewall policies... Full Story
-

High availability on FortiGate is one of those features... Full Story
-

If you've configured SD-WAN on a FortiGate, you've almost... Full Story
-

FortiLink is the management protocol that turns a FortiSwitch... Full Story
-

FortiSwitches are pretty rock solid from Mean Time Between... Full Story
-

This is a quicky tip. Have you ever gone... Full Story
-

DNS is one of those quiet pieces of internet... Full Story
-

This article is an updated version of the previous... Full Story
-

You will add ns2 as a secondary (slave) BIND9... Full Story
-

In the process of deploying my lab, I needed... Full Story
-

RFC 8805, used to be known as Self-Correcting IP... Full Story
-

Years back, I wrote an article about certificate pinning. ... Full Story
-

FortiGates have the ability to send alerts to Microsoft... Full Story
-

In this post, I am going to walk through... Full Story
-

Troubleshooting VoIP on a FortiGate can feel like trying... Full Story
-

Prior to FortiOS 7.0, there were three commands to... Full Story
-

In this post, I am going to go over... Full Story
-

What we are going to do: We are going... Full Story
-

Choosing between FGCP (FortiGate Clustering Protocol) and FGSP (FortiGate... Full Story
-

Creating a VLAN on macOS (The "Pro" Move) A... Full Story
-

This blog post explores the logic behind how macOS... Full Story
-

Pretty Fly for a Wi-Fi Tell My Wi-Fi Love... Full Story
-

Part of my daily gig is creating BoMs (Bill-of-Materials)... Full Story
-

ICMP introduces several security risks, but careful filtering, rate... Full Story
-

The command diag debug application dhcps -1 enables full... Full Story
-

In the world of FortiOS, execute tac report is... Full Story
-

LLDP; What is it The Link Layer Discovery Protocol... Full Story
-

What it actually does When you run diagnose fdsm... Full Story
-

Monkey Bites are bite-sized, high-impact security insights designed for... Full Story
-

I have run macOS in macOS with Parallels but... Full Story
-

Don't be confused with my other FortiNAC posts where... Full Story
-

This is the third session in a multi-part article... Full Story
-

Today I was configuring key-based authentication on a FortiGate... Full Story
-

Netcat, often called the "Swiss Army knife" of networking,... Full Story
-

At its core, IEEE 802.1X is a network layer... Full Story
-

In case you did not see the previous FortiNAC... Full Story
-

This is our 5th session where we are going... Full Story
-

Now that we have Wireshark installed and somewhat configured,... Full Story
-

The Philosophy of Packet Analysis Troubleshooting isn't about looking... Full Story
-

macOS file management runs on BSD userland tools sitting... Full Story
-

Practitioners call FortiOS's onboard automation engine a lot of... Full Story
-

When something is behaving strangely on a FortiGate, whether... Full Story