
If you've spent any time configuring user authentication on... Full Story
By Manny Fernandez
October 8, 2026
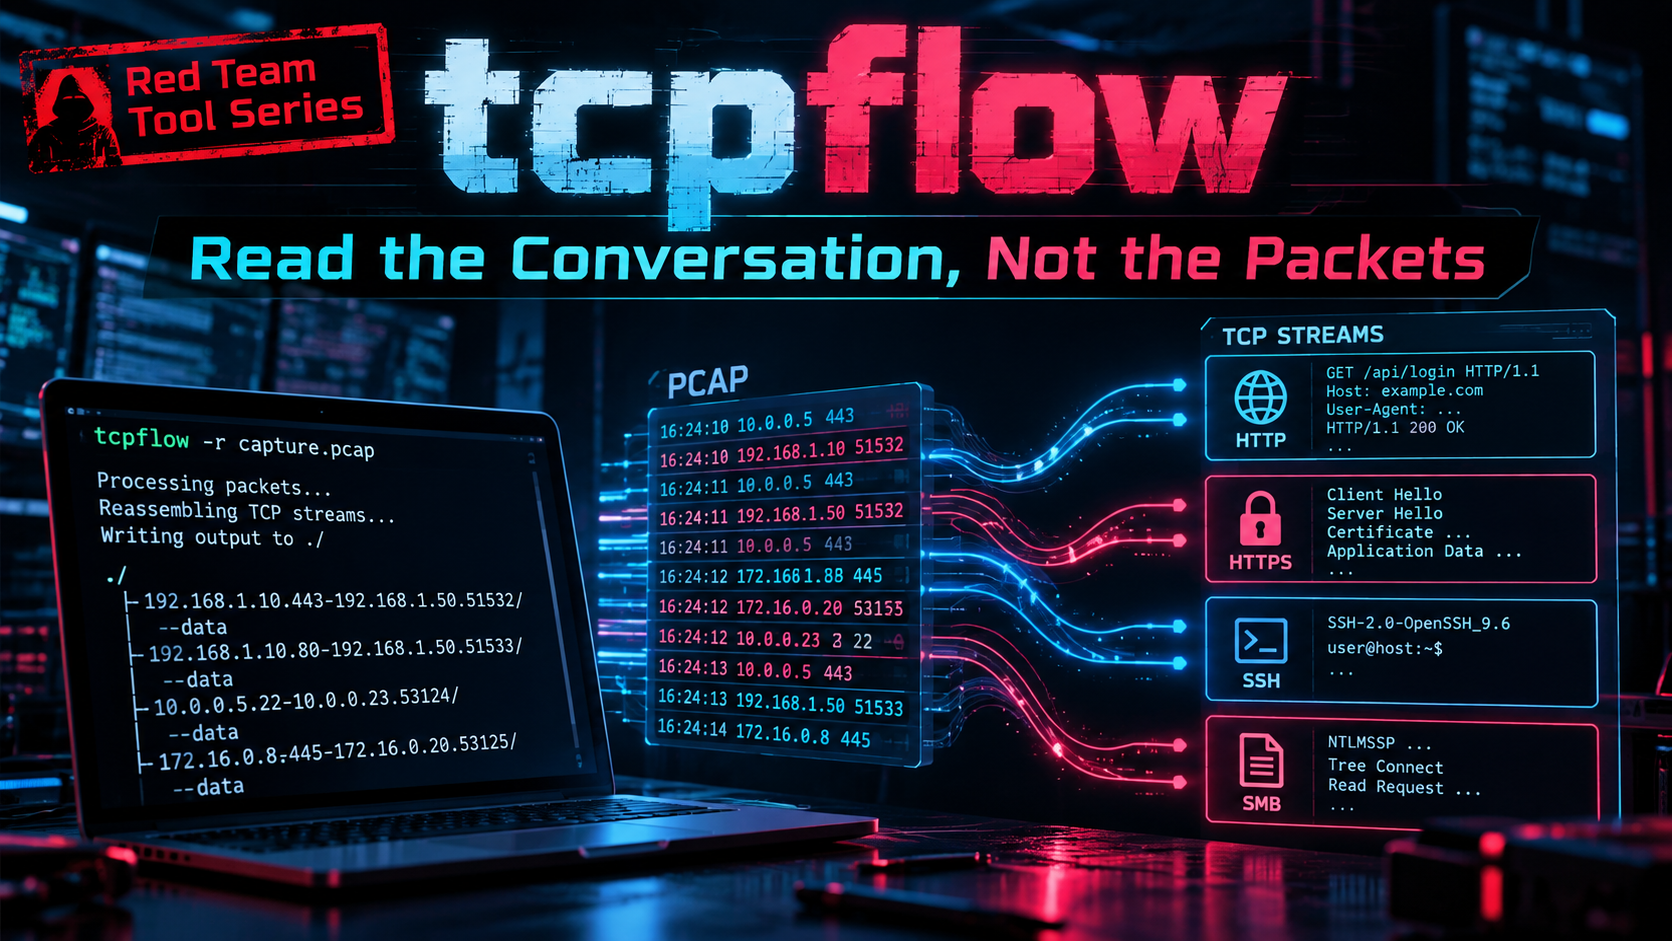
Red Team Tool Series: “tcpflow” Read the Conversation, Not the Packets
Executive Summary
tcpdump shows you packets. Most of the time, what you actually care about is what the two endpoints said to each other. tcpflow captures TCP traffic, puts every segment back in sequence-number order, and writes each direction of each connection to its own file. One connection, two files, readable with cat, grep, file, strings, or anything else already in your toolbox.
Originally written by Jeremy Elson and now maintained by Simson Garfinkel (of digital forensics fame), tcpflow has grown from a simple stream splitter into a small forensic engine: it carves HTTP bodies, produces a DFXML report of every flow, and can render traffic graphs. It is the tool you reach for when the question is “what was in the traffic” rather than “what did the headers look like.”
Objective: Install tcpflow, reassemble TCP sessions from live interfaces and pcap files, carve HTTP objects, read the DFXML report, and feed FortiGate sniffer captures into the same workflow.
Target audience: Network and security engineers, SOC analysts, and anyone who has clicked “Follow TCP Stream” in Wireshark forty times in one afternoon.
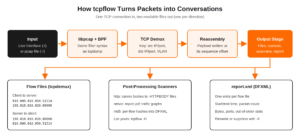
Figure 1. The tcpflow pipeline from packet input to per-direction flow files.
How tcpflow Works
Under the hood, tcpflow does five things in order:
- Captures packets through libpcap, either live from an interface (
-i) or from a saved capture (-r). Filtering uses the same BPF syntax astcpdump, so every filter you already know works unchanged. - Demultiplexes TCP segments into flows keyed on source IP, source port, destination IP, destination port, and VLAN ID.
- Reassembles each flow by writing the payload of every segment at its sequence-number offset in the output file. Retransmissions overwrite the same bytes and out-of-order segments land where they belong. Missing segments leave a hole.
- Writes one file per direction. A single HTTP request/response exchange produces two files: the client-to-server request and the server-to-client response.
- Post-processes the flows with optional scanners (HTTP carving, traffic graphs, hashing) and records every flow in a DFXML file named
report.xml.
Reading the Default Filenames
The default naming template is %A.%a-%B.%b%V%v%C%c: source IP, source port, destination IP, destination port, then optional VLAN and connection-counter suffixes. IPs are zero-padded to three digits per octet and ports to five digits, so a plain ls sorts them sensibly.
010.000.010.050.51514-198.018.010.020.00080   <- client 10.0.10.50:51514 to server
198.018.010.020.00080-010.000.010.050.51514   <- server response back to client
If the same 4-tuple is reused later in the capture, tcpflow appends a counter (c1, c2, and so on) instead of overwriting the first connection. If the traffic is tagged, the VLAN ID is appended with a -- separator.
Prerequisites and Architecture
Assumed Knowledge
- TCP fundamentals: the three-way handshake, sequence numbers, and FIN/RST teardown.
- BPF capture filter syntax (
host,net,port,and/or/not). - Comfortable Linux or macOS shell usage, including
sudo.
Lab Environment
The examples use the standard InfoSecMonkey lab addressing: 198.18.0.0/15 stands in for public and transit space and 10.0.0.0/16 for internal LANs. Substitute your own interface names and addresses.
| Component | Role | Address |
|---|---|---|
| Ubuntu 24.04 LTS analyst VM | Runs tcpflow and tcpdump, acts as lab client (interface ens18) |
10.0.10.50 |
| FortiGate | Lab gateway and secondary capture point via the built-in sniffer | LAN 10.0.10.1, WAN 198.18.0.1 |
| Lab web server (nginx) | Cleartext HTTP target for reassembly and carving tests | 198.18.10.20 |
| macOS workstation (optional) | Homebrew install path and en0 capture |
10.0.10.60 |
Privileges: Live capture needs root or the
CAP_NET_RAW capability. Reading a pcap file with -r needs no special privileges at all, which is one more reason to capture once and analyze offline.Authorization: Reassembled flows contain real payloads: credentials, cookies, documents. Only capture traffic you own or are explicitly authorized to inspect, and handle output directories like the sensitive evidence they are.
Step-by-Step Implementation Workflow
Step 1: Install tcpflow
Goal: Get a working tcpflow binary on the analyst box.
Action: Use your package manager. Every major distribution and Homebrew ship it.
# Ubuntu / Debian
sudo apt update && sudo apt install -y tcpflow

# RHEL / Rocky / Alma (package lives in EPEL)
sudo dnf install -y epel-release
sudo dnf install -y tcpflow

# macOS (Homebrew)
brew install tcpflow
If you need the newest code or want to confirm which scanners get compiled in, build from source:
sudo apt install -y git build-essential autoconf automake \
  libpcap-dev libboost-dev zlib1g-dev libssl-dev libcairo2-dev
git clone --recursive https://github.com/simsong/tcpflow.git
cd tcpflow
./bootstrap.sh
./configure
make -j"$(nproc)"
sudo make install
Gotcha:
libcairo2-dev is optional, but without it the netviz scanner (the one that draws report.pdf) is not built. The --recursive flag matters too: the repository pulls shared code in as git submodules, and a plain clone fails at bootstrap.sh.Verification: Confirm the version and see which scanners your build includes.
tcpflow -V
tcpflow -H | less
Step 2: Watch a Live Conversation on the Console
Goal: See a reassembled HTTP exchange scroll by in real time without writing any files.
Action: Start tcpflow in console mode (-c) with a BPF filter, then generate traffic from a second terminal.
# Terminal 1
sudo tcpflow -i ens18 -c 'host 198.18.10.20 and tcp port 80'

# Terminal 2
curl -s http://198.18.10.20/ -o /dev/null
Expected output: Each chunk is prefixed with the flow name, followed by the payload exactly as it crossed the wire.
010.000.010.050.51514-198.018.010.020.00080: GET / HTTP/1.1
Host: 198.18.10.20
User-Agent: curl/8.5.0
Accept: */*

198.018.010.020.00080-010.000.010.050.51514: HTTP/1.1 200 OK
Server: nginx/1.24.0 (Ubuntu)
Content-Type: text/html
Content-Length: 615
...
Useful console modifiers: -C drops the flow-name prefix for clean output, -g prints each direction in alternating colors, -D switches to a hex dump for binary protocols, and -s replaces non-printable bytes with dots so your terminal survives.
Step 3: Reassemble a pcap into Files
Goal: Capture once, then split every TCP conversation in the capture into its own pair of files.
Action: Capture with full snap length using tcpdump, then point tcpflow at the file with an output directory.
sudo tcpdump -i ens18 -s 0 -w lab.pcap 'host 198.18.10.20'
# ... generate traffic, then Ctrl+C

mkdir -p flows
tcpflow -r lab.pcap -o flows
ls -1 flows
Expected output: Two flow files per conversation plus the DFXML report. Depending on the scanners in your build, you may also see -HTTPBODY files and a report.pdf.
010.000.010.050.51514-198.018.010.020.00080
198.018.010.020.00080-010.000.010.050.51514
report.xml
From here the output is just files. cat them, grep -l across them, or feed them to file to see what kind of content each one holds.
cat flows/010.000.010.050.*-198.018.010.020.00080
grep -l 'HTTP/1.1 500' flows/*
file flows/* | grep -v ASCII
Step 4: Control Filenames for Long Captures
Goal: Make output sortable by time and keep busy captures from drowning a single directory.
Action: Use -F prefix/suffix flags for common cases or -T for a full custom template.
# Prepend Unix epoch time to every filename
tcpflow -r lab.pcap -o flows -Ft

# Prepend ISO 8601 timestamps and always append a connection counter
tcpflow -r lab.pcap -o flows -FT -Fc

# Bin output into subdirectories of 1,000 files each (busy links)
tcpflow -r big.pcap -o flows -Fk

# Fully custom template: timestamp, then the usual 4-tuple
tcpflow -r lab.pcap -o flows -T '%T_%A.%a-%B.%b%C%c'| Template variable | Expands to |
|---|---|
%A / %a |
Source IP / source port (zero-padded) |
%B / %b |
Destination IP / destination port (zero-padded) |
%T |
Flow start time in ISO 8601 format |
%t |
Flow start time as Unix epoch seconds |
%V / %v |
A -- separator if the flow is tagged / the VLAN ID |
%C / %c |
The letter c if the connection counter is above zero / the counter value |
%# |
The connection counter, always printed |
Step 5: Carve HTTP Objects
Goal: Pull downloaded files and page bodies out of cleartext HTTP sessions for hashing and inspection.
Action: Enable the http scanner explicitly. Many builds turn it on by default, but being explicit costs nothing.
tcpflow -r web.pcap -e http -o http_out
ls http_out | grep HTTPBODY
file http_out/*HTTPBODY*
sha256sum http_out/*HTTPBODY*
The scanner decompresses gzip-encoded bodies by default so the carved file is the real object. Add -Z if you want the compressed bytes exactly as transmitted, for example when you need to match a hash seen in a proxy log.
Scope: Carving works on cleartext HTTP/1.x. Anything inside TLS, and HTTP/2 or HTTP/3, will not carve. See the troubleshooting section for what to do about encrypted traffic.
Step 6: Audit Cleartext Protocol Exposure
Goal: Prove (on your own network) that legacy protocols are leaking credentials, which is often the fastest way to get FTP, Telnet, and cleartext mail retired.
Action: Reassemble only the legacy protocol ports and grep the stream for authentication verbs.
tcpflow -r branch.pcap -C \
  'port 21 or port 23 or port 25 or port 110 or port 143' \
  | grep -Ei '^(USER|PASS|AUTH|LOGIN) '
A single matching line in a customer QBR is worth ten slides about encryption policy. Redact before you screenshot.
Step 7: Inspect Binary Protocols in Hex
Goal: Read protocols that are not text, such as Modbus/TCP on an OT segment.
Action: Combine console mode with hex output.
tcpflow -r plant.pcap -c -D 'tcp port 502'Each direction prints as offset, hex bytes, and an ASCII column, so request and response function codes are easy to line up by eye.
Step 8: Feed FortiGate Sniffer Captures into tcpflow
Goal: Reassemble traffic captured on the FortiGate itself, which is often the only vantage point you have at a branch.
Action: Either download a pcap from the GUI packet capture tool (its menu location varies by FortiOS version), or capture from the CLI with verbosity 6 and convert the text output.
# On the FortiGate: verbosity 6 includes full Ethernet payload in hex.
# Log your SSH session to fgt-sniffer.txt while this runs.
diagnose sniffer packet port2 'host 198.18.10.20 and tcp port 80' 6 0 a
# On the analyst box: convert with fgt2eth.pl (needs text2pcap from
# the wireshark-common package), then reassemble as usual.
sudo apt install -y wireshark-common
perl fgt2eth.pl -in fgt-sniffer.txt -out fgt-sniffer.pcap
tcpflow -r fgt-sniffer.pcap -o fgt_flowsGotcha: Use verbosity 3 or 6. Levels 1, 2, 4, and 5 do not include the Ethernet-level hex payload that
fgt2eth.pl needs. Also sniff a specific port rather than any: on any, the same segment is seen on ingress and egress and tcpflow reassembles duplicates.Step 9: Read the DFXML Report
Goal: Get a machine-readable inventory of every flow for scripting and timelines.
Action: Every run writes report.xml into the output directory. It records the filename, size, timing, packet counts, and reassembly statistics for each flow.
# How many flow files did the run produce?
grep -c '<fileobject>' flows/report.xml

# List the flow filenames recorded in the report
grep -o '<filename>[^<]*' flows/report.xml | sed 's/<filename>//'

# Write the report somewhere specific, or suppress it entirely
tcpflow -r lab.pcap -o flows -X /tmp/lab-report.xml
tcpflow -r lab.pcap -c -X /dev/null
Option Reference
| Option | What it does | Reach for it when |
|---|---|---|
-i <iface> |
Capture live from an interface | Watching traffic as it happens |
-r <file> |
Read packets from a pcap (repeatable) | Offline analysis, no root needed |
-o <dir> |
Output directory (default is the current directory) | Always, to keep evidence organized |
-c |
Print to console instead of creating files | Quick looks and piping to grep |
-C |
Console output without the flow-name prefix | Clean output for scripts |
-g |
Alternate colors per direction in console mode | Reading chatty request/response protocols |
-D |
Hex dump output (pairs with -c or -C) |
Binary protocols |
-s |
Replace non-printable characters with dots | Mixed text/binary streams on a terminal |
-B |
Force binary output even with -c or -C |
Piping raw bytes to another tool |
-b <bytes> |
Maximum bytes saved per flow | Capping disk use on bulk transfers |
-e / -E / -x |
Enable a scanner / enable only that scanner / disable one | Tuning post-processing |
-a |
Enable all post-processing scanners | Forensic triage of an unknown capture |
-H |
Describe every scanner in this build | Checking what your binary can do |
-F<x> |
Filename prefix/suffix (t, T, c, k, m) |
Time-sorted or binned output |
-T <tmpl> |
Custom filename template | Matching your own evidence naming |
-X <file> |
DFXML report location | Moving or suppressing report.xml |
-Z |
Do not decompress gzip HTTP bodies | Hash-matching the on-wire object |
-p |
Do not put the interface in promiscuous mode | Only traffic to and from the host |
-w <file> |
Write packets tcpflow did not process to a pcap | Keeping the non-TCP remainder |
-f <n> |
Maximum file descriptors to use | Very busy links with many open flows |
-S name=value |
Set a scanner or engine parameter | Fine tuning (see tcpflow -hh) |
Verification and Validation
Test 1: The Carved Object Matches the Original
Download a known file while capturing, then compare hashes. curl without --compressed does not request gzip, so the carved body should be byte-identical.
curl -s http://198.18.10.20/index.html -o original.html
tcpflow -r lab.pcap -e http -o check
sha256sum original.html check/*HTTPBODY*
Success looks like: The two SHA-256 values are identical. A mismatch almost always means packet loss during capture (see Troubleshooting).
Test 2: Flow Count Matches the Conversation Count
tshark -r lab.pcap -q -z conv,tcp | grep -c '<->'
ls flows | grep -vc -e report -e HTTPBODY
Success looks like: The file count is roughly double the conversation count (two directions each). Conversations that never carried payload, such as a SYN answered by a RST, produce no files, so the file count can legitimately come in a little lower.
Troubleshooting and Gotchas
1. tcpflow Runs but Writes Nothing
Usual suspects: wrong interface, a filter that matches nothing, sessions with no payload, or missing capture privileges. Prove the filter with tcpdump first, since both tools share the BPF engine.
ip -br link
sudo tcpdump -i ens18 -nn -c 10 'host 198.18.10.20 and tcp port 80'

# Allow non-root live capture (Linux)
sudo setcap cap_net_raw,cap_net_admin=eip "$(command -v tcpflow)"
2. Output Is Unreadable Gibberish
It is almost always TLS. tcpflow reassembles bytes; it does not decrypt them. Check the first bytes of the client flow: a TLS handshake record starts with 16 03.
head -c 3 flows/010.000.010.050.*-198.018.010.020.00443 | xxd
# 00000000: 1603 01    ...
For your own lab clients, export SSLKEYLOGFILE from the browser or curl and decrypt in Wireshark instead. For production traffic, decryption belongs on the FortiGate with deep inspection, not on an analyst VM.
3. Flows Have Holes or Are Truncated
Because tcpflow writes each segment at its sequence offset, missing segments show up as gaps of null bytes and carved files fail their hash check. The capture dropped packets or cut them short.
capinfos lab.pcap | grep -i -e 'snapshot' -e 'packets'
# At the end of a tcpdump run, watch for: "N packets dropped by kernel"
sudo tcpdump -i ens18 -s 0 -B 8192 -w lab.pcap 'host 198.18.10.20'
Use full snap length (-s 0), a larger kernel buffer (-B, in KiB), and the tightest filter you can. Capturing to disk and reassembling afterward is far more reliable than live reassembly on a busy link.
4. FortiGate Captures Show Only Handshakes
If the session is offloaded to an NP processor, the sniffer sees the first packets and then nothing. For a controlled lab test, disable offload on the matching policy, capture, and turn it back on.
config firewall policy
    edit <policy-id>
        set auto-asic-offload disable
    next
end
Warning: Disabling offload moves that traffic onto the CPU. Scope the policy tightly, never do this on a high-throughput production policy, and re-enable it the moment the capture is done.
5. Thousands of Files or Descriptor Exhaustion
On busy captures, cap per-flow bytes with -b, bin output with -Fk or -Fm, raise the shell limit with ulimit -n, and filter to the hosts you actually care about. A precise BPF filter beats every other optimization.
Where tcpflow Fits
| Tool | Unit of analysis | Best at | Weak at |
|---|---|---|---|
| tcpdump | Packets | Fast capture and header triage | Reading application payloads |
| Wireshark Follow TCP Stream | One stream at a time in a GUI | Deep dissection and TLS decryption with keys | Bulk work across hundreds of flows |
tshark -z follow |
One stream per invocation | Scripting a single known stream | Extracting every stream at once |
| tcpflow | Every stream, written to files | Bulk reassembly, carving, grep-driven triage | Encrypted traffic and UDP |
| Zeek | Logs and protocol metadata | Long-term network security monitoring | Quick ad hoc payload reads |
Quick Reference
# Live, console, one host/port
sudo tcpflow -i ens18 -c 'host 198.18.10.20 and tcp port 80'

# Live, console, hex, no prefix
sudo tcpflow -i ens18 -C -D 'tcp port 502'

# pcap to files
tcpflow -r lab.pcap -o flows

# pcap to files with timestamps and counters
tcpflow -r lab.pcap -o flows -FT -Fc

# Carve HTTP objects and hash them
tcpflow -r web.pcap -e http -o http_out && sha256sum http_out/*HTTPBODY*

# Cleartext credential audit (authorized networks only)
tcpflow -r cap.pcap -C 'port 21 or port 23 or port 110' | grep -Ei '^(USER|PASS) '

# Cap each flow at 1 MB, bin into 1,000-file directories
tcpflow -r big.pcap -o flows -b 1048576 -Fk

# Console run without leaving report.xml behind
tcpflow -r lab.pcap -c -X /dev/null
Wrap-Up
tcpflow does one job and does it well: it turns packets back into the conversations they came from and hands you plain files. Capture with tcpdump or the FortiGate sniffer, reassemble with tcpflow, and let grep, file, and sha256sum do the rest. When the question is “what was actually said on the wire,” it gets you to the answer faster than any GUI.
Recent posts
-

-

DNS is one of those technologies that quietly underpins... Full Story
-

BGP issues on FortiGate firewalls usually trace back to... Full Story
-

Every time your laptop talks to your router, a... Full Story
-

If you've spent any time configuring NAT on a... Full Story
-

If you have spent any time configuring firewall policies... Full Story
-

High availability on FortiGate is one of those features... Full Story
-

If you've configured SD-WAN on a FortiGate, you've almost... Full Story
-

FortiLink is the management protocol that turns a FortiSwitch... Full Story
-

FortiSwitches are pretty rock solid from Mean Time Between... Full Story
-

This is a quicky tip. Have you ever gone... Full Story
-

DNS is one of those quiet pieces of internet... Full Story
-

This article is an updated version of the previous... Full Story
-

You will add ns2 as a secondary (slave) BIND9... Full Story
-

In the process of deploying my lab, I needed... Full Story
-

RFC 8805, used to be known as Self-Correcting IP... Full Story
-

Years back, I wrote an article about certificate pinning. ... Full Story
-

FortiGates have the ability to send alerts to Microsoft... Full Story
-

In this post, I am going to walk through... Full Story
-

Troubleshooting VoIP on a FortiGate can feel like trying... Full Story
-

Prior to FortiOS 7.0, there were three commands to... Full Story
-

In this post, I am going to go over... Full Story
-

What we are going to do: We are going... Full Story
-

Choosing between FGCP (FortiGate Clustering Protocol) and FGSP (FortiGate... Full Story
-

Creating a VLAN on macOS (The "Pro" Move) A... Full Story
-

This blog post explores the logic behind how macOS... Full Story
-

Pretty Fly for a Wi-Fi Tell My Wi-Fi Love... Full Story
-

Part of my daily gig is creating BoMs (Bill-of-Materials)... Full Story
-

ICMP introduces several security risks, but careful filtering, rate... Full Story
-

The command diag debug application dhcps -1 enables full... Full Story
-

In the world of FortiOS, execute tac report is... Full Story
-

LLDP; What is it The Link Layer Discovery Protocol... Full Story
-

What it actually does When you run diagnose fdsm... Full Story
-

Monkey Bites are bite-sized, high-impact security insights designed for... Full Story
-

I have run macOS in macOS with Parallels but... Full Story
-

Don't be confused with my other FortiNAC posts where... Full Story
-

This is the third session in a multi-part article... Full Story
-

Today I was configuring key-based authentication on a FortiGate... Full Story
-

Netcat, often called the "Swiss Army knife" of networking,... Full Story
-

At its core, IEEE 802.1X is a network layer... Full Story
-

In case you did not see the previous FortiNAC... Full Story
-

This is our 5th session where we are going... Full Story
-

Now that we have Wireshark installed and somewhat configured,... Full Story
-

The Philosophy of Packet Analysis Troubleshooting isn't about looking... Full Story
-

Executive Summary Objective: Give you a working command of... Full Story
-

You have configured it a dozen times. Server IP,... Full Story
-

Executive Summary Objective: Walk through every message a FortiGate... Full Story