
If you've spent any time configuring user authentication on... Full Story
By Manny Fernandez
October 8, 2026
Blue Team Tool Series: Logwatch Deep Dive: Turning /var/log Noise Into a Daily Security Briefing
1. Executive Summary
Every Linux box you own is writing a diary nobody reads. auth.log, syslog, secure, mail.log, the journal: thousands of lines a day, and the three that matter (the brute force from a hosting provider, the sudo you did not run, the disk that is 97 percent full) are buried under cron chatter. Logwatch fixes that with a boring, reliable idea: once a day, parse the logs, group what happened by service, and send you a digest.
Objective: deploy Logwatch as a daily log briefing, tune its signal to noise ratio, make it work on hosts that only log to the systemd journal, and extend it with a custom service that summarizes FortiGate deny traffic landing on a syslog collector.
Target audience: Linux admins, security engineers running small to mid-size fleets, homelabbers, and anyone who wants daily visibility on a handful of servers without standing up a SIEM.
2. What Logwatch Is (and What It Is Not)
Logwatch is a Perl-based, pluggable log analyzer maintained on SourceForge under the MIT license. It is a batch reporter, not a real-time monitor. It reads a time window of logs (yesterday by default), runs each service’s lines through a dedicated parser script, and assembles a single report delivered to stdout, email, or a file, in text or HTML.
Know where it fits before you deploy it. Logwatch answers “what happened on this box yesterday?” It does not correlate across hosts, it does not alert at 2 AM, and it does not retain anything. Pair it with real-time tooling, do not replace real-time tooling with it.
| Tool | Model | Best At | Weak At |
|---|---|---|---|
| Logwatch | Daily batch digest per host | Human-readable summaries grouped by service | Real-time alerting, cross-host correlation |
| Logcheck | Frequent batch, regex ignore lists | Surfacing unusual lines you have not whitelisted | Summaries; output is raw log lines |
| journalctl | Ad hoc query | Interactive investigation on one host | Scheduled reporting |
| Wazuh / SIEM | Real-time, centralized | Correlation, alerting, retention, compliance | Setup and care-and-feeding effort |
Note: Version check: distro builds lag upstream. LTS releases often ship a 7.7 to 7.10 build while upstream has moved further into the 7.x series. Run
logwatch --version and read the changelog before assuming a feature or service parser exists on your box.3. How Logwatch Works
Three building blocks drive everything, and once you see them the config layout stops being confusing:
- Logfile groups define which files (and rotated archives) to read, plus shared filters such as date-range trimming. Example: the
securegroup maps toauth.logon Debian/Ubuntu andsecureon RHEL. - Services bind a report section to one or more logfile groups and apply pre-filters such as
*OnlyService(keep only lines from a given program) and*RemoveHeaders(strip the syslog prefix). - Service scripts are the parsers. Logwatch pipes the filtered lines to the script on STDIN, exposes settings as environment variables such as
LOGWATCH_DETAIL_LEVEL, and prints whatever the script writes to STDOUT between the section’s Begin and End banners.
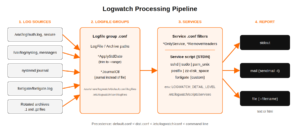
Configuration is layered. Logwatch reads the shipped defaults first, then distribution overrides, then your local files, and finally command-line options. The last one wins.
| Path | Purpose | Edit It? |
|---|---|---|
/usr/share/logwatch/default.conf/logwatch.conf |
Shipped global defaults | No |
/usr/share/logwatch/dist.conf/ |
Distribution-specific overrides | No |
/usr/share/logwatch/default.conf/services/ |
Stock service definitions | No |
/usr/share/logwatch/default.conf/logfiles/ |
Stock logfile groups | No |
/usr/share/logwatch/scripts/services/ |
Stock service parser scripts | No |
/usr/share/logwatch/scripts/shared/ |
Shared filters (onlyservice, journalctl, and so on) | No |
/etc/logwatch/conf/logwatch.conf |
Your global overrides | Yes |
/etc/logwatch/conf/services/ |
Per-service overrides and custom services | Yes |
/etc/logwatch/conf/logfiles/ |
Logfile group overrides and custom groups | Yes |
/etc/logwatch/scripts/services/ |
Custom parser scripts | Yes |
/etc/logwatch/conf/ignore.conf |
Regexes for lines to drop from the final report | Yes |
Note: Rule of thumb: never edit anything under
/usr/share/logwatch. Package upgrades overwrite it. Everything you change lives in /etc/logwatch.4. Prerequisites and Lab Architecture
Assumed knowledge: comfortable on the Linux CLI with sudo, basic understanding of syslog and systemd units, and a working idea of how outbound mail relaying works.
| Component | Role | Address / Detail |
|---|---|---|
| web01 | Ubuntu 24.04 LTS server being reported on | 10.0.10.50 |
| rhel01 | RHEL 9 family server (Rocky/Alma also fine) | 10.0.10.60 |
| FortiGate | Sends syslog to web01 (used in Step 8) | 10.0.0.1 |
| Admin workstation | Where you read the reports | 10.0.20.15 |
| Internet test source | Simulated attacker for SSH validation | 198.18.44.10 |
| Mail relay | Postfix on the host, or msmtp to your provider | SMTP 25 or submission 587 |
Lab addressing follows the house convention: 10.0.0.0/16 for internal LANs and 198.18.0.0/15 standing in for public and transit space.
5. Step-by-Step Implementation
Step 1: Install Logwatch
Goal: get the package, the date parsing library, and the cache directory in place.
Action (Ubuntu/Debian): install Logwatch and Date::Manip. Without Date::Manip, only the simple ranges (today, yesterday, all) work.
sudo apt update
sudo apt install -y logwatch libdate-manip-perl
sudo mkdir -p /var/cache/logwatch
logwatch --version
Action (RHEL 9 family): install from the distribution repos. If the package is not found on your release, enable EPEL and retry.
sudo dnf install -y logwatch perl-Date-Manip
sudo mkdir -p /var/cache/logwatch
logwatch --version
Note: On Debian/Ubuntu,
apt may pull in Postfix as the recommended mail transport and launch its configuration dialog. If you only want stdout or file output, add --no-install-recommends and install your own relay later.Verification: logwatch --version prints a version string and ls -ld /var/cache/logwatch shows the directory owned by root.
Step 2: Run Your First Report
Goal: see real output before touching any configuration.
# Everything from today, medium detail, to the terminal
sudo logwatch --output stdout --format text --range today --detail med

# Just one service, maximum detail
sudo logwatch --output stdout --range today --service sshd --detail high
Run it with sudo. Logwatch runs as whoever calls it, and an unprivileged user cannot read auth.log, secure, or the system journal, which produces a mostly empty report that looks like a quiet day.
Sample output (section layout varies by version and service):
 --------------------- SSHD Begin ------------------------

 Failed logins from:
    198.18.44.10: 3 times
       baduser/password: 3 times

 Illegal users from:
    198.18.44.10: 3 times
       baduser: 3 times

 Users logging in through sshd:
    manny:
       10.0.20.15: 2 times

 ---------------------- SSHD End -------------------------
Step 3: Build Your Override Configuration
Goal: set site-wide defaults in /etc/logwatch/conf/logwatch.conf so every scheduled run behaves the same way. Only keys you set here override the shipped defaults.
# /etc/logwatch/conf/logwatch.conf
LogDir = /var/log
TmpDir = /var/cache/logwatch
Output = mail
Format = html
Encode = none
MailTo = soc@example.com
MailFrom = logwatch@web01.example.com
Range = yesterday
Detail = Med
Archives = Yes
mailer = "/usr/sbin/sendmail -t"

# Report everything, then carve out the noise
Service = All
Service = "-zz-network"
Service = "-zz-sys"
Service = "-eximstats"| Directive | What It Controls | Practical Value |
|---|---|---|
Detail |
Verbosity: Low (0), Med (5), High (10), or any 0 to 10 |
Med for daily mail, High when investigating |
Range |
Time window to analyze | yesterday for daily cron runs |
Output |
stdout, mail, or file |
mail for scheduled runs |
Format |
text or html |
html reads better in mail clients |
Service |
Which sections run; a leading - excludes |
All plus exclusions |
Archives |
Also read rotated files | Yes so rotation at midnight does not hide yesterday |
MailTo / MailFrom |
Envelope and header addresses | Use a real mailbox or list, not root |
mailer |
Command used to send mail | Must exist; check with which sendmail |
Tuning tip: to suppress individual lines rather than whole services, add regexes to /etc/logwatch/conf/ignore.conf. Any report line that matches is dropped from the final output.
# /etc/logwatch/conf/ignore.conf
# Drop known-good monitoring noise from the final report
^\s+10\.0\.10\.5: \d+ times?$
nagios-plugin
Step 4: Configure Email Delivery
Goal: make sure the mailer command actually delivers. Logwatch hands the report to sendmail -t and walks away, so a broken MTA fails silently.
Action: either install Postfix as a satellite relaying to your mail gateway, or use msmtp-mta as a lightweight sendmail replacement that submits to your provider on port 587.
# Option A: Postfix (choose "Satellite system" and enter your relay host)
sudo apt install -y postfix

# Option B: msmtp as /usr/sbin/sendmail
sudo apt install -y msmtp-mta
sudoedit /etc/msmtprc
Test with an explicit recipient so you are not guessing where the report went:
sudo logwatch --output mail --format html --range today \
  --mailto you@example.com --detail med

# Postfix delivery log and queue
sudo tail -n 20 /var/log/mail.log
mailq
Verification: the mail log shows status=sent for the message, and the report lands in your inbox (check spam the first time and allowlist the sender).
Step 5: Confirm the Schedule
Goal: know exactly what runs daily and with which options. The package installs the schedule for you, but where it lives varies.
# Debian/Ubuntu ship /etc/cron.daily/00logwatch
# RHEL family ships /etc/cron.daily/0logwatch
ls /etc/cron.daily/ | grep -i logwatch
cat /etc/cron.daily/*logwatch

# Some builds use a systemd timer instead
systemctl list-timers --all | grep -i logwatch
Note: Gotcha: the Debian/Ubuntu cron script calls
logwatch --output mail. Command-line options beat the config file, so setting Output = file in logwatch.conf will not stop the daily email. Edit the cron script (or override the timer unit) if you want a different scheduled behavior.Want the digest at a specific time instead of whenever cron.daily fires? Remove the executable bit from the cron script and add your own entry:
sudo chmod -x /etc/cron.daily/00logwatch
echo '30 6 * * * root /usr/sbin/logwatch --output mail' | \
  sudo tee /etc/cron.d/logwatch-0630
Verification: run-parts --test /etc/cron.daily lists the script if it will run, and omits it if you disabled it.
Step 6: Save Reports to Disk
Goal: keep a local archive of reports for hosts that should not send mail, or to feed a web page or ticket.
sudo mkdir -p /var/log/logwatch-reports
sudo logwatch --output file --format html --range yesterday \
  --filename /var/log/logwatch-reports/$(hostname)-$(date +%F).html
Verification: the HTML file exists and opens in a browser with collapsible-looking service sections. Add a logrotate or find -mtime +30 -delete rule so the archive does not grow forever.
Step 7: Report on Journal-Only Hosts
Goal: get service sections back on systems where there is no auth.log or secure file, such as Debian 12 and later minimal installs, Fedora, and slim cloud images. Logwatch parses files by default, so a journal-only host produces an almost empty report.
Action (quickest fix): install rsyslog so classic files exist again.
sudo apt install -y rsyslog
sudo systemctl enable --now rsyslog
Action (journal-native): Logwatch ships a shared journalctl filter. Override a service so it reads the journal instead of a file. The empty LogFile = line clears the stock logfile group, and none tells Logwatch no file is needed.
# /etc/logwatch/conf/services/sshd.conf
LogFile =
LogFile = none
*JournalCtl = "--output=cat --unit=ssh.service"
Use ssh.service on Debian/Ubuntu and sshd.service on the RHEL family. Confirm the unit name with systemctl list-units | grep -i ssh. The filter translates the Logwatch range into journalctl --since and --until arguments for you.
Verification: sudo logwatch --service sshd --range today --detail high --output stdout shows an SSHD section with the logins you just made.
Step 8: Write a Custom Service (FortiGate Deny Summary)
Goal: extend Logwatch with your own parser. Here web01 doubles as a syslog collector for a FortiGate at 10.0.0.1, and we want a daily section summarizing denied sessions by source and destination port.
Action 1: land FortiGate syslog in its own file with traditional timestamps (the date filter expects them).
# /etc/rsyslog.d/30-fortigate.conf
module(load="imudp")
input(type="imudp" port="514")

if $fromhost-ip == '10.0.0.1' then {
    action(type="omfile" file="/var/log/fortigate/fortigate.log"
           template="RSYSLOG_TraditionalFileFormat")
    stop
}
sudo mkdir -p /var/log/fortigate
sudo systemctl restart rsyslog
# FortiGate side
config log syslogd setting
set status enable
set server "10.0.10.50"
set port 514
endAction 2: define a logfile group. Paths are relative to LogDir, and *ApplyStdDate trims lines to the requested range.
# /etc/logwatch/conf/logfiles/fortigate.conf
LogFile = fortigate/fortigate.log
Archive = fortigate/fortigate.log.1
Archive = fortigate/fortigate.log.*.gz
*ApplyStdDate
Action 3: define the service. The file name (minus .conf) must match the script name.
# /etc/logwatch/conf/services/fortigate.conf
Title = "FortiGate Denied Traffic"
LogFile = fortigate
Action 4: write the parser. It reads lines on STDIN, honors the detail level, and prints nothing on a quiet day so the section disappears from the report.
#!/usr/bin/perl
# /etc/logwatch/scripts/services/fortigate
use strict;
use warnings;

my $detail = $ENV{'LOGWATCH_DETAIL_LEVEL'} || 0;
my (%by_src, %by_port);
my $total = 0;

while (my $line = <STDIN>) {
    next unless $line =~ /\btype="?traffic"?/;
    next unless $line =~ /\baction="?deny"?/;
    my ($src)  = $line =~ /\bsrcip="?([0-9A-Fa-f:.]+)/;
    my ($port) = $line =~ /\bdstport="?(\d+)/;
    $by_src{ $src // 'unknown' }++;
    $by_port{ $port // 'n/a' }++;
    $total++;
}
exit 0 unless $total;

my $top = $detail >= 10 ? 50 : $detail >= 5 ? 20 : 10;
printf " Denied sessions: %d\n\n", $total;

sub top_n {
    my ($label, $h) = @_;
    print " $label:\n";
    my @k = sort { $h->{$b} <=> $h->{$a} } keys %$h;
    splice(@k, $top) if @k > $top;
    printf "    %-40s %8d\n", $_, $h->{$_} for @k;
    print "\n";
}

top_n('Top denied sources', \%by_src);
top_n('Top denied destination ports', \%by_port);
sudo chmod 755 /etc/logwatch/scripts/services/fortigate
sudo logwatch --service fortigate --range today --detail high \
--output stdoutSample output:
 ------------------ FortiGate Denied Traffic Begin ------------------

 Denied sessions: 1482

 Top denied sources:
    198.18.44.10                                  611
    198.18.97.3                                   402
    10.0.30.44                                     57

 Top denied destination ports:
    23                                            688
    3389                                          420
    445                                           301

 ------------------- FortiGate Denied Traffic End -------------------
Note: An internal host like
10.0.30.44 showing up in a deny summary is often the most interesting line in the whole report. Misconfigured app, stale DNS, or something that should not be scanning. Either way, you would never have noticed it in raw syslog.6. Command-Line Reference
| Option | Purpose | Example |
|---|---|---|
--detail |
Verbosity level | --detail high |
--range |
Time window (see next table) | --range yesterday |
--service |
Run one service; repeat for more | --service sshd --service sudo |
--logfile |
Process one logfile group only | --logfile secure |
--output |
stdout, mail, or file |
--output file |
--format |
text or html |
--format html |
--filename |
Destination for --output file |
--filename /tmp/lw.html |
--mailto / --mailfrom |
Override recipients and sender | --mailto soc@example.com |
--subject |
Custom mail subject | --subject "web01 daily" |
--archives |
Include rotated logs | --archives |
--hostname |
Report under a different host name | --hostname web01 |
--numeric |
Skip reverse DNS lookups | --numeric |
--debug |
Show internal processing | --debug high |
--usage |
Print option summary | --usage |
Range Expressions
| Expression | Meaning | Needs Date::Manip |
|---|---|---|
yesterday |
Previous calendar day (the default) | No |
today |
Midnight until now | No |
all |
Everything in the files read | No |
"since 2 hours ago" |
Rolling window ending now | Yes |
"between -7 days and -1 days" |
The last week, excluding today | Yes |
"between 2026-09-01 and 2026-09-15" |
Fixed calendar window | Yes |
7. Verification and Validation
Run this checklist once after deployment and again after any distro upgrade.
# 1. Binary and version
logwatch --version

# 2. Generate a known event from the test source (198.18.44.10)
ssh baduser@web01.example.com   # fail the password 3 times

# 3. Confirm the event appears
sudo logwatch --service sshd --range today --detail high --output stdout

# 4. Confirm mail delivery end to end
sudo logwatch --output mail --range today --mailto you@example.com
sudo grep -i 'status=sent' /var/log/mail.log | tail -n 3

# 5. Confirm the daily schedule will fire
run-parts --test /etc/cron.daily | grep -i logwatch
Expected success state: the SSHD section lists 198.18.44.10 under failed logins with the baduser attempts, the mail log shows status=sent, and run-parts --test returns the Logwatch cron script.
8. Troubleshooting and Gotchas
Error: /var/cache/logwatch: No such file or directory
Cause: the temp directory named by TmpDir does not exist. Some packages never create it.
Resolution: sudo mkdir -p /var/cache/logwatch, or point TmpDir at an existing directory in logwatch.conf.
Report Is Empty or Missing SSHD and Sudo
Cause: you ran without sudo, or the host logs only to the journal, or the range does not include the events.
ls -l /var/log/auth.log /var/log/secure 2>&1
systemctl is-active rsyslog
sudo logwatch --service sshd --range all --detail high --debug high \
  --output stdout 2>&1 | less
Resolution: run as root, install rsyslog or add *JournalCtl overrides (Step 7), and widen the range to all to prove the parser works before narrowing it again.
Mail Never Arrives
Cause: no working sendmail binary, a relay rejecting the sender, or the recipient’s spam filter.
which sendmail
mailq
sudo tail -n 50 /var/log/mail.log
echo test | mail -s 'relay test' you@example.com
Resolution: fix the MTA first and prove it with a plain mail test. Use a MailFrom address on a domain your relay is allowed to send for, and remember the cron script’s --output mail wins over the config file.
Custom Service Produces No Section
Cause: the script is not executable, the service and script names do not match, or the date filter discards every line because the timestamp format is not what Logwatch expects.
Resolution: chmod 755 the script, keep fortigate.conf and scripts/services/fortigate named identically, and pin RSYSLOG_TraditionalFileFormat on files Logwatch reads. If your rsyslog writes RFC 3339 timestamps, older Logwatch builds may not match them. Test the parser in isolation with cat /var/log/fortigate/fortigate.log | LOGWATCH_DETAIL_LEVEL=10 /etc/logwatch/scripts/services/fortigate.
9. Quick Reference Cheat Sheet
# Today, everything, to screen
sudo logwatch --range today --output stdout

# Yesterday, high detail, HTML mail to a list
sudo logwatch --range yesterday --detail high --format html \
  --output mail --mailto soc@example.com

# Last 7 days of SSH activity
sudo logwatch --service sshd --range "between -7 days and -1 days" \
  --archives --output stdout

# Save an HTML report to disk
sudo logwatch --output file --format html --filename /tmp/lw.html

# Debug a service that is not showing up
sudo logwatch --service fortigate --range all --debug high --output stdout

# Where things live
/etc/logwatch/conf/logwatch.conf          # your global settings
/etc/logwatch/conf/services/              # service overrides and customs
/etc/logwatch/scripts/services/           # custom parsers
/usr/share/logwatch/                      # stock files, do not edit
10. Wrap-Up
Logwatch is not glamorous, and that is the point. Fifteen minutes of setup buys you a daily briefing that reliably surfaces the brute-force source, the unexpected sudo, the full disk, and, with one small Perl script, the internal host your FortiGate keeps denying. Deploy it on every standalone box, tune it until you actually read it, and let your SIEM handle the real-time work.
InfoSecMonkey | No fluff. Just the config that works.
Recent posts
-

-

DNS is one of those technologies that quietly underpins... Full Story
-

BGP issues on FortiGate firewalls usually trace back to... Full Story
-

Every time your laptop talks to your router, a... Full Story
-

If you've spent any time configuring NAT on a... Full Story
-

If you have spent any time configuring firewall policies... Full Story
-

High availability on FortiGate is one of those features... Full Story
-

If you've configured SD-WAN on a FortiGate, you've almost... Full Story
-

FortiLink is the management protocol that turns a FortiSwitch... Full Story
-

FortiSwitches are pretty rock solid from Mean Time Between... Full Story
-

This is a quicky tip. Have you ever gone... Full Story
-

DNS is one of those quiet pieces of internet... Full Story
-

This article is an updated version of the previous... Full Story
-

You will add ns2 as a secondary (slave) BIND9... Full Story
-

In the process of deploying my lab, I needed... Full Story
-

RFC 8805, used to be known as Self-Correcting IP... Full Story
-

Years back, I wrote an article about certificate pinning. ... Full Story
-

FortiGates have the ability to send alerts to Microsoft... Full Story
-

In this post, I am going to walk through... Full Story
-

Troubleshooting VoIP on a FortiGate can feel like trying... Full Story
-

Prior to FortiOS 7.0, there were three commands to... Full Story
-

In this post, I am going to go over... Full Story
-

What we are going to do: We are going... Full Story
-

Choosing between FGCP (FortiGate Clustering Protocol) and FGSP (FortiGate... Full Story
-

Creating a VLAN on macOS (The "Pro" Move) A... Full Story
-

This blog post explores the logic behind how macOS... Full Story
-

Pretty Fly for a Wi-Fi Tell My Wi-Fi Love... Full Story
-

Part of my daily gig is creating BoMs (Bill-of-Materials)... Full Story
-

ICMP introduces several security risks, but careful filtering, rate... Full Story
-

The command diag debug application dhcps -1 enables full... Full Story
-

In the world of FortiOS, execute tac report is... Full Story
-

LLDP; What is it The Link Layer Discovery Protocol... Full Story
-

What it actually does When you run diagnose fdsm... Full Story
-

Monkey Bites are bite-sized, high-impact security insights designed for... Full Story
-

I have run macOS in macOS with Parallels but... Full Story
-

Don't be confused with my other FortiNAC posts where... Full Story
-

This is the third session in a multi-part article... Full Story
-

Today I was configuring key-based authentication on a FortiGate... Full Story
-

Netcat, often called the "Swiss Army knife" of networking,... Full Story
-

At its core, IEEE 802.1X is a network layer... Full Story
-

In case you did not see the previous FortiNAC... Full Story
-

This is our 5th session where we are going... Full Story
-

Now that we have Wireshark installed and somewhat configured,... Full Story
-

The Philosophy of Packet Analysis Troubleshooting isn't about looking... Full Story
-

Executive Summary Objective: Give you a working command of... Full Story
-

You have configured it a dozen times. Server IP,... Full Story
-

Executive Summary Objective: Walk through every message a FortiGate... Full Story