
If you've spent any time configuring user authentication on... Full Story
By Manny Fernandez
October 11, 2026
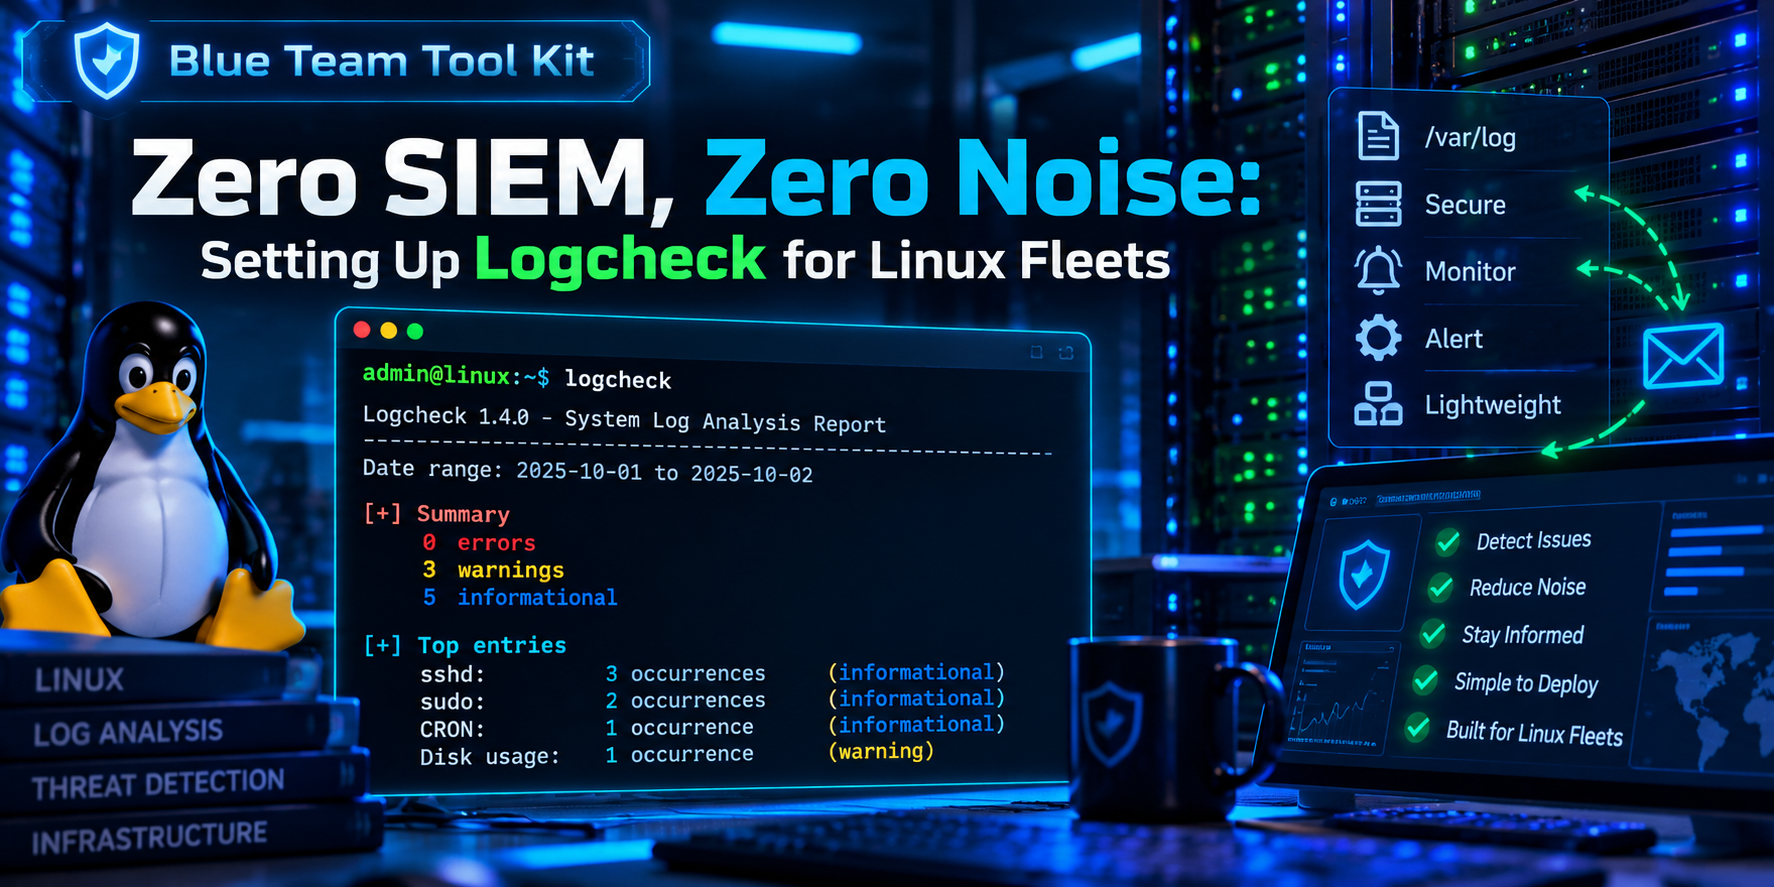
Logcheck on Linux: How to Install It, Configure It, and Run It
Executive Summary
Objective: Deploy logcheck on a Debian or Ubuntu server so that every hour it reads the new log lines, throws away the ones you have declared boring, and emails you whatever is left.
Target audience: Linux admins and security practitioners who want log review on a single host or a small fleet without standing up a SIEM.
Logcheck works backwards from most log tools. It does not hunt for known bad strings and stay quiet otherwise. It assumes every line is interesting until a rule says it is not. That makes it noisy on day one and very useful by week two, because anything new on the box shows up in your inbox by default.
How Logcheck Thinks
Each run pulls only the lines written since the last run (tracked with logtail2 offsets in /var/lib/logcheck), then sorts them through three layers in order.
| Layer | Match directory | Filter directory | Mail subject |
|---|---|---|---|
| 1. Attack alerts | cracking.d |
cracking.ignore.d (off by default) |
Security Alerts |
| 2. Security events | violations.d |
violations.ignore.d |
Security Events |
| 3. Everything else | (all remaining lines) | ignore.d.<level> |
System Events |
The report level decides which ignore.d directories apply to layer 3. Levels are cumulative.
| Level | Ignore directories applied | Result |
|---|---|---|
paranoid |
ignore.d.paranoid |
Most mail. For hosts running very few services. |
server |
paranoid + ignore.d.server |
The default. Right for most servers. |
workstation |
paranoid + server + ignore.d.workstation |
Least mail. For desktops and laptops. |
Prerequisites and Architecture
Assumed knowledge
- Comfortable with
sudo,apt, and editing files under/etc. - Basic extended regular expressions (the
grep -Eflavor). - A working idea of where your distribution writes logs: rsyslog files, the systemd journal, or both.
Lab environment
| Component | Value used in this guide | Notes |
|---|---|---|
| Host | log01 (10.0.10.20) |
Debian 12/13 or Ubuntu 22.04/24.04. On Ubuntu the package is in universe. |
| logcheck | 1.4.x | Check yours with logcheck -v. Journal support needs 1.4 or later. |
| Mail relay | [mail.example.com]:587 |
Placeholder. Any MTA that can deliver local mail off the box works. |
| Report recipient | secops@example.com |
Placeholder. Use a mailbox someone reads. |
| Scheduler | /etc/cron.d/logcheck |
Shipped by the Debian package. Runs as user logcheck. |
Note: This guide targets the Debian family, where logcheck is maintained. RHEL family distributions generally do not package it in the base repos, so check your repos before planning around it there.
Step-by-Step Implementation
Step 1: Install logcheck
Goal: Get the engine, the stock rule database, and the log tail helper on the box.
Action: Install the three packages. logcheck-database carries the stock rules and logtail provides logtail2.
sudo apt update
sudo apt install -y logcheck logcheck-database logtail
Verify: Confirm the version, the service account, and its group membership. The logcheck user must be in adm to read /var/log and the journal.
logcheck -v
id logcheck
ls -ld /etc/logcheck /var/lib/logcheck
Step 2: Make sure the host can send mail
Goal: Logcheck hands its report to the local mail command. No MTA means no reports, and it fails quietly.
Action: If the host has no MTA yet, install Postfix as a loopback-only relay client and a mail binary. Replace the relay with your own. If your relay needs authentication, add the usual SASL settings.
sudo apt install -y postfix bsd-mailx
sudo postconf -e 'relayhost = [mail.example.com]:587'
sudo postconf -e 'inet_interfaces = loopback-only'
sudo systemctl restart postfix
Verify: Send a test message and watch it leave the queue.
echo "mail path test from log01" | mail -s "log01 test" secops@example.com
mailq
sudo journalctl -u postfix --since -5min --no-pager | tail
Step 3: Set the core options in logcheck.conf
Goal: Pick the report level and tell logcheck where to send mail.
Action: Edit /etc/logcheck/logcheck.conf. These are the settings that matter on day one.
sudo nano /etc/logcheck/logcheck.conf
# paranoid | server | workstation
REPORTLEVEL="server"

# Where reports go. Default is the local "logcheck" user.
SENDMAILTO="secops@example.com"

# 1 = send the report as an attachment instead of inline
MAILASATTACH=0

# 1 = use the fully qualified hostname in the subject
FQDN=1

# 1 = collapse identical lines (sort -u) to shrink reports
SORTUNIQ=0

# 1 = let cracking.ignore.d filter the Security Alerts layer
SUPPORT_CRACKING_IGNORE=0

# Optional tag added to every subject line, handy for mail filters
ADDTAG="no"
| Setting | What it does | Recommendation |
|---|---|---|
REPORTLEVEL |
Selects which ignore.d directories apply. |
Start at server. |
SENDMAILTO |
Report recipient. Local user or full address. | A shared mailbox, not one person. |
MAILASATTACH |
Inline body versus attachment. | Leave at 0 so you can skim on a phone. |
FQDN |
Short or full hostname in the subject. | 1 if you run more than a few hosts. |
SORTUNIQ |
Deduplicates identical lines. | 0 at first. You lose ordering and counts at 1. |
SUPPORT_CRACKING_IGNORE |
Allows ignoring attack alerts. | Leave at 0 unless a stock rule misfires. |
Verify: List the active (uncommented) settings.
sudo grep -Ev '^\s*(#|$)' /etc/logcheck/logcheck.conf
Step 4: Tell logcheck which logs to read
Goal: Point logcheck at the right sources. This is where most silent failures come from.
Action: Sources are listed one per line in /etc/logcheck/logcheck.logfiles and in any *.logfiles file under /etc/logcheck/logcheck.logfiles.d/. Version 1.4 ships two drop-ins.
ls -l /etc/logcheck/logcheck.logfiles.d/
cat /etc/logcheck/logcheck.logfiles.d/journal.logfiles
cat /etc/logcheck/logcheck.logfiles.d/syslog.logfiles
| File | Contents | When it matters |
|---|---|---|
journal.logfiles |
The keyword journal |
Hosts with no rsyslog, such as a default Debian 12 or later install. |
syslog.logfiles |
/var/log/syslog and /var/log/auth.log |
Hosts running rsyslog, such as Ubuntu Server. |
If the host runs both the journal and rsyslog, you will see every event twice. Pick one source and comment out the other. Then add any application logs you care about in your own drop-in.
# Example: rsyslog host, so stop reading the journal too
sudo sed -i 's/^journal/#journal/' \
  /etc/logcheck/logcheck.logfiles.d/journal.logfiles

# Example: add application logs
sudo tee /etc/logcheck/logcheck.logfiles.d/local.logfiles <<'EOF'
/var/log/nginx/error.log
/var/log/fail2ban.log
EOF
sudo chown root:logcheck /etc/logcheck/logcheck.logfiles.d/local.logfiles
sudo chmod 640 /etc/logcheck/logcheck.logfiles.d/local.logfiles
Verify: Confirm the logcheck user can actually read each file you listed.
sudo -u logcheck head -n 1 /var/log/nginx/error.log
sudo -u logcheck journalctl -n 1 --no-pager
Step 5: Run it by hand
Goal: See a report on screen before any mail is sent, and without moving the log offsets.
Action: Always run as the logcheck user, never as root. -o prints to stdout instead of mailing. -t is test mode, so offsets are not updated and you can rerun against the same lines.
sudo -u logcheck logcheck -o -t
Expect a large first report. Logcheck has never run, so everything in the current logs is new. When you are ready, do one real run to send the first mail and set the offsets.
sudo -u logcheck logcheck
Verify: Offsets now exist in the state directory.
sudo ls -l /var/lib/logcheck/
Step 6: Tune it with local ignore rules
Goal: Turn the report from a wall of text into a short list of things worth reading. This step is the real work and it never fully ends.
Action: Rules are extended regular expressions, one per line, matched against the whole log line. Put your own rules in a new file under the directory for your level. Never edit the stock files, because package upgrades replace them.
Stock rules start with a prefix that matches the timestamp and hostname. The 1.4 form handles both the classic syslog timestamp and the ISO timestamp:
^(\w{3} [ :[:digit:]]{11}|[0-9T:.+-]{32}) [._[:alnum:]-]+
Generate a test event, confirm logcheck reports it, then write a rule to silence it.
logger -t mtest "probe 001"
sudo -u logcheck logcheck -o -t | grep mtest
sudo nano /etc/logcheck/ignore.d.server/local-mtest
^(\w{3} [ :[:digit:]]{11}|[0-9T:.+-]{32}) [._[:alnum:]-]+ mtest: probe [0-9]+$
sudo chown root:logcheck /etc/logcheck/ignore.d.server/local-mtest
sudo chmod 640 /etc/logcheck/ignore.d.server/local-mtest
Three rules for rule files, all of which fail silently if you break them:
- No dots in the filename. Logcheck loads rule files the way
run-partsdoes, solocal-mtestloads andlocal-mtest.rulesis skipped. - Readable by the logcheck group. A root-only file is skipped.
- Be specific. Anchor with
^and$and match variable parts with tight classes like[0-9]+. A lazy.*rule will one day hide the line you needed to see.
To silence a line that shows up under Security Events, the rule goes in violations.ignore.d instead. An ignore.d rule has no effect on that layer.
Verify: Rerun in test mode. The count should be 0.
sudo -u logcheck logcheck -o -t | grep -c mtest
Note: On rsyslog hosts you can also test a rule file directly against a log with grep -E -f <rulefile> /var/log/syslog. Any line it prints is a line the rule would suppress.
Step 7: Schedule it
Goal: Hands-off hourly reports.
Action: On Debian and Ubuntu the package already did this. Review the cron file and adjust the interval if hourly is not what you want.
cat /etc/cron.d/logcheck
@reboot    logcheck  if [ -x /usr/sbin/logcheck ]; then \
                       nice -n10 /usr/sbin/logcheck -R; fi
2 * * * *  logcheck  if [ -x /usr/sbin/logcheck ]; then \
                       nice -n10 /usr/sbin/logcheck; fi
The first entry sends a report after every reboot (-R marks the subject as a reboot run). The second runs at minute 2 of every hour. Your file may be formatted slightly differently, and each entry is a single line in the real file. For a quieter cadence, change 2 * * * * to something like 2 */4 * * *.
Verify: Confirm cron is firing the job.
sudo journalctl -u cron --since -2h --no-pager | grep -i logcheck
Verification and Validation
Run this end-to-end test once the tuning rule from Step 6 is in place. It proves the full path: log source, rule engine, mail.
# 1. A line that no rule ignores
logger -t monkeycheck "unrecognized event $(date +%s)"

# 2. A real run (updates offsets, sends mail)
sudo -u logcheck logcheck

# 3. Confirm the MTA accepted and relayed it
sudo journalctl -u postfix --since -5min --no-pager | grep status=
Success looks like this:
- Postfix logs
status=sentfor a message to your report address. - A mail arrives with a subject like
log01 2026-10-01 14:02 System Events. - The body lists the
monkeycheckline under System Events and does not list themtestline. - A second run with no new log lines sends nothing. No mail is the normal healthy state.
Troubleshooting and Gotchas
1. No mail ever arrives
Work the path from the left. Does logcheck produce a report, and does the MTA deliver it?
sudo -u logcheck logcheck -o -t | head -n 40
sudo -u logcheck logcheck -d 2>&1 | tail -n 40
mailq
sudo journalctl -u postfix --since -1h --no-pager | tail -n 20
Resolution: If -o -t prints a report but nothing is delivered, the problem is mail: missing mail binary, no MTA, or the relay is rejecting you. If SENDMAILTO is still the default logcheck, the report is going to a local alias (usually root), so check /etc/aliases or set a real address.
2. Reports are empty or logcheck complains it cannot read a file
Either the source list does not match how this host logs, or the logcheck user lacks read access.
systemctl is-active rsyslog
ls -l /var/log/syslog /var/log/auth.log
id logcheck
sudo -u logcheck journalctl -n 3 --no-pager
Resolution: No rsyslog means the files in syslog.logfiles do not exist, so make sure the journal line is active. For permission errors, add the user back to the group with sudo usermod -aG adm logcheck. Also remember that running logcheck as root is refused by design.
3. A custom rule does nothing
In order of likelihood: the filename has a dot, the file is not group readable, the rule is in the wrong directory for the layer, or the regex does not match the whole line (trailing whitespace is a classic).
ls -l /etc/logcheck/ignore.d.server/ | grep local
sudo -u logcheck cat /etc/logcheck/ignore.d.server/local-mtest
grep -n ' $' /etc/logcheck/ignore.d.server/local-mtest
Resolution: Rename without dots, set root:logcheck and mode 640, and copy the exact line from the report when building the regex. If the line is reported under Security Events, move the rule to violations.ignore.d.
4. Every event appears twice
Resolution: The host logs to both the journal and rsyslog and both sources are active. Comment out one of them as shown in Step 4.
Quick Reference
| Flag | Meaning |
|---|---|
-o |
Print the report to stdout instead of mailing it. |
-t |
Test mode. Do not update log offsets. |
-d |
Debug output. |
-p / -s / -w |
Force report level paranoid, server, or workstation for this run. |
-m <addr> |
Override the mail recipient for this run. |
-l <file> |
Check one extra log file. |
-L <file> |
Use an alternate logfiles list. |
-c <file> |
Use an alternate config file. |
-r <dir> |
Use an alternate rule directory. |
-u |
Unique sort the output for this run. |
-R |
Reboot run. Tags the mail subject accordingly. |
-v |
Print the version. |
| Path | Purpose |
|---|---|
/etc/logcheck/logcheck.conf |
Main configuration. |
/etc/logcheck/logcheck.logfiles.d/ |
Log sources to read. |
/etc/logcheck/ignore.d.<level>/ |
Rules that drop lines from System Events. |
/etc/logcheck/violations.d/ and violations.ignore.d/ |
Security Events matches and their filters. |
/etc/logcheck/cracking.d/ |
Security Alerts matches. |
/var/lib/logcheck/ |
Offsets (state). Delete a file here to reprocess that log. |
/etc/cron.d/logcheck |
Schedule. |
That is the whole tool. Install it, expect a noisy first week, write a few tight ignore rules each morning, and you end up with an inbox that only speaks when something on the box has changed.
Recent posts
-

-

DNS is one of those technologies that quietly underpins... Full Story
-

BGP issues on FortiGate firewalls usually trace back to... Full Story
-

Every time your laptop talks to your router, a... Full Story
-

If you've spent any time configuring NAT on a... Full Story
-

If you have spent any time configuring firewall policies... Full Story
-

High availability on FortiGate is one of those features... Full Story
-

If you've configured SD-WAN on a FortiGate, you've almost... Full Story
-

FortiLink is the management protocol that turns a FortiSwitch... Full Story
-

FortiSwitches are pretty rock solid from Mean Time Between... Full Story
-

This is a quicky tip. Have you ever gone... Full Story
-

DNS is one of those quiet pieces of internet... Full Story
-

This article is an updated version of the previous... Full Story
-

You will add ns2 as a secondary (slave) BIND9... Full Story
-

In the process of deploying my lab, I needed... Full Story
-

RFC 8805, used to be known as Self-Correcting IP... Full Story
-

Years back, I wrote an article about certificate pinning. ... Full Story
-

FortiGates have the ability to send alerts to Microsoft... Full Story
-

In this post, I am going to walk through... Full Story
-

Troubleshooting VoIP on a FortiGate can feel like trying... Full Story
-

Prior to FortiOS 7.0, there were three commands to... Full Story
-

In this post, I am going to go over... Full Story
-

What we are going to do: We are going... Full Story
-

Choosing between FGCP (FortiGate Clustering Protocol) and FGSP (FortiGate... Full Story
-

Creating a VLAN on macOS (The "Pro" Move) A... Full Story
-

This blog post explores the logic behind how macOS... Full Story
-

Pretty Fly for a Wi-Fi Tell My Wi-Fi Love... Full Story
-

Part of my daily gig is creating BoMs (Bill-of-Materials)... Full Story
-

ICMP introduces several security risks, but careful filtering, rate... Full Story
-

The command diag debug application dhcps -1 enables full... Full Story
-

In the world of FortiOS, execute tac report is... Full Story
-

LLDP; What is it The Link Layer Discovery Protocol... Full Story
-

What it actually does When you run diagnose fdsm... Full Story
-

Monkey Bites are bite-sized, high-impact security insights designed for... Full Story
-

I have run macOS in macOS with Parallels but... Full Story
-

Don't be confused with my other FortiNAC posts where... Full Story
-

This is the third session in a multi-part article... Full Story
-

Today I was configuring key-based authentication on a FortiGate... Full Story
-

Netcat, often called the "Swiss Army knife" of networking,... Full Story
-

At its core, IEEE 802.1X is a network layer... Full Story
-

In case you did not see the previous FortiNAC... Full Story
-

This is our 5th session where we are going... Full Story
-

Now that we have Wireshark installed and somewhat configured,... Full Story
-

The Philosophy of Packet Analysis Troubleshooting isn't about looking... Full Story
-

For those that may not know, Fortinet has a... Full Story
-

Executive Summary Objective: Deploy logcheck on a Debian or... Full Story
-

Ettercap in 2026: ARP Poisoning, DNS Spoofing, and Content... Full Story