
If you've spent any time configuring user authentication on... Full Story
By Manny Fernandez
October 17, 2026

Deploying Cisco TRex: A Line-Rate Traffic Generator for Your Firewall Lab
Stand up TRex on Ubuntu, wire it through a FortiGate, and get real throughput numbers without a six-figure test chassis
Executive Summary
| Item | Detail |
|---|---|
| Objective | Deploy Cisco TRex v3.x on Ubuntu 22.04 LTS, place a FortiGate between its two test ports, and run stateless (packet rate) and advanced stateful (real TCP session) tests, then automate a run with the Python API. |
| Target audience | Network and security engineers, SEs running PoCs, and anyone who needs repeatable throughput, session-rate, and latency numbers from a lab without renting an Ixia or Spirent chassis. |
| Time to complete | About 60 minutes for a VM build, longer for bare metal with BIOS and IOMMU changes. |
| Version used | TRex v3.08 (the version in the trex-core repository at time of writing). Commands use <version> wherever the folder name matters. |
TRex is Cisco’s open source traffic generator built on DPDK. It skips the Linux network stack, talks to the NIC directly, and can push tens of gigabits per second from a commodity x86 server. For a firewall engineer that means you can answer the questions that actually matter in a PoC: what does this box do with IPS turned on, how many new sessions per second can it build, and where does latency start to climb.
Why TRex, and Which Mode
TRex runs in three modes. Pick the one that matches the question you are asking the DUT.
| Mode | What it generates | Use it for |
|---|---|---|
| STL (stateless) | Raw packet streams built with Scapy, with a field engine that rewrites IPs, ports, and sizes on the fly | Packets per second, RFC 2544 style throughput, routing and switching tests, malformed packet tests |
| ASTF (advanced stateful) | Real TCP and UDP sessions with a full TCP stack on both client and server side, driven from pcap templates | Connections per second, concurrent sessions, firewall and IPS throughput with realistic application mixes |
| STF (legacy stateful) | Smart replay of pcap templates without a real TCP stack | Older test plans and NAT learning; new work should use ASTF |
Tip: A firewall with inspection enabled does not care about packets, it cares about sessions. Use STL to prove the plumbing and find raw packet limits, then switch to ASTF for anything you plan to put in front of a customer.
Prerequisites and Architecture
Assumed knowledge
- Comfortable on the Linux CLI with sudo, apt, and a text editor.
- Basic IPv4 routing: static routes, next hops, ARP.
- FortiOS CLI for interfaces, static routes, and firewall policy.
Lab requirements
| Component | Spec | Notes |
|---|---|---|
| TRex host | Ubuntu 22.04 LTS Server, 64-bit, 4+ vCPU or cores, 8 GB+ RAM, 20 GB disk | Bare metal for anything above a few Gbps. A VM is fine for functional testing and lower rates. |
| Management NIC | 10.0.0.50/24 | SSH and trex-console. Never handed to DPDK. |
| Test NIC 0 (client side) | 10.0.10.10/24, gateway 10.0.10.1 | Owned by DPDK once TRex starts. |
| Test NIC 1 (server side) | 10.0.20.10/24, gateway 10.0.20.1 | Owned by DPDK once TRex starts. |
| DUT | FortiGate, port2 10.0.10.1/24 and port3 10.0.20.1/24 | Any FortiOS 7.x build. Swap in your own interface names. |
Supported NICs include Intel I350, 82599/X520, X710, XL710 and XXV710, Mellanox ConnectX-4 and ConnectX-5, Cisco VIC, and the virtual NICs VMXNET3, virtio, and E1000. Both test NICs must be the same type. Do not mix drivers in one config file.
Addressing plan
| Pool | Range | Where it lives |
|---|---|---|
| Emulated clients | 10.0.110.0/24 | Behind TRex port 0. The FortiGate routes to it via 10.0.10.10. |
| Emulated servers | 198.18.10.0/24 | Behind TRex port 1. Stands in for the internet. The FortiGate routes to it via 10.0.20.10. |
| Client transit | 10.0.10.0/24 | TRex port 0 to FortiGate port2 |
| Server transit | 10.0.20.0/24 | TRex port 1 to FortiGate port3 |
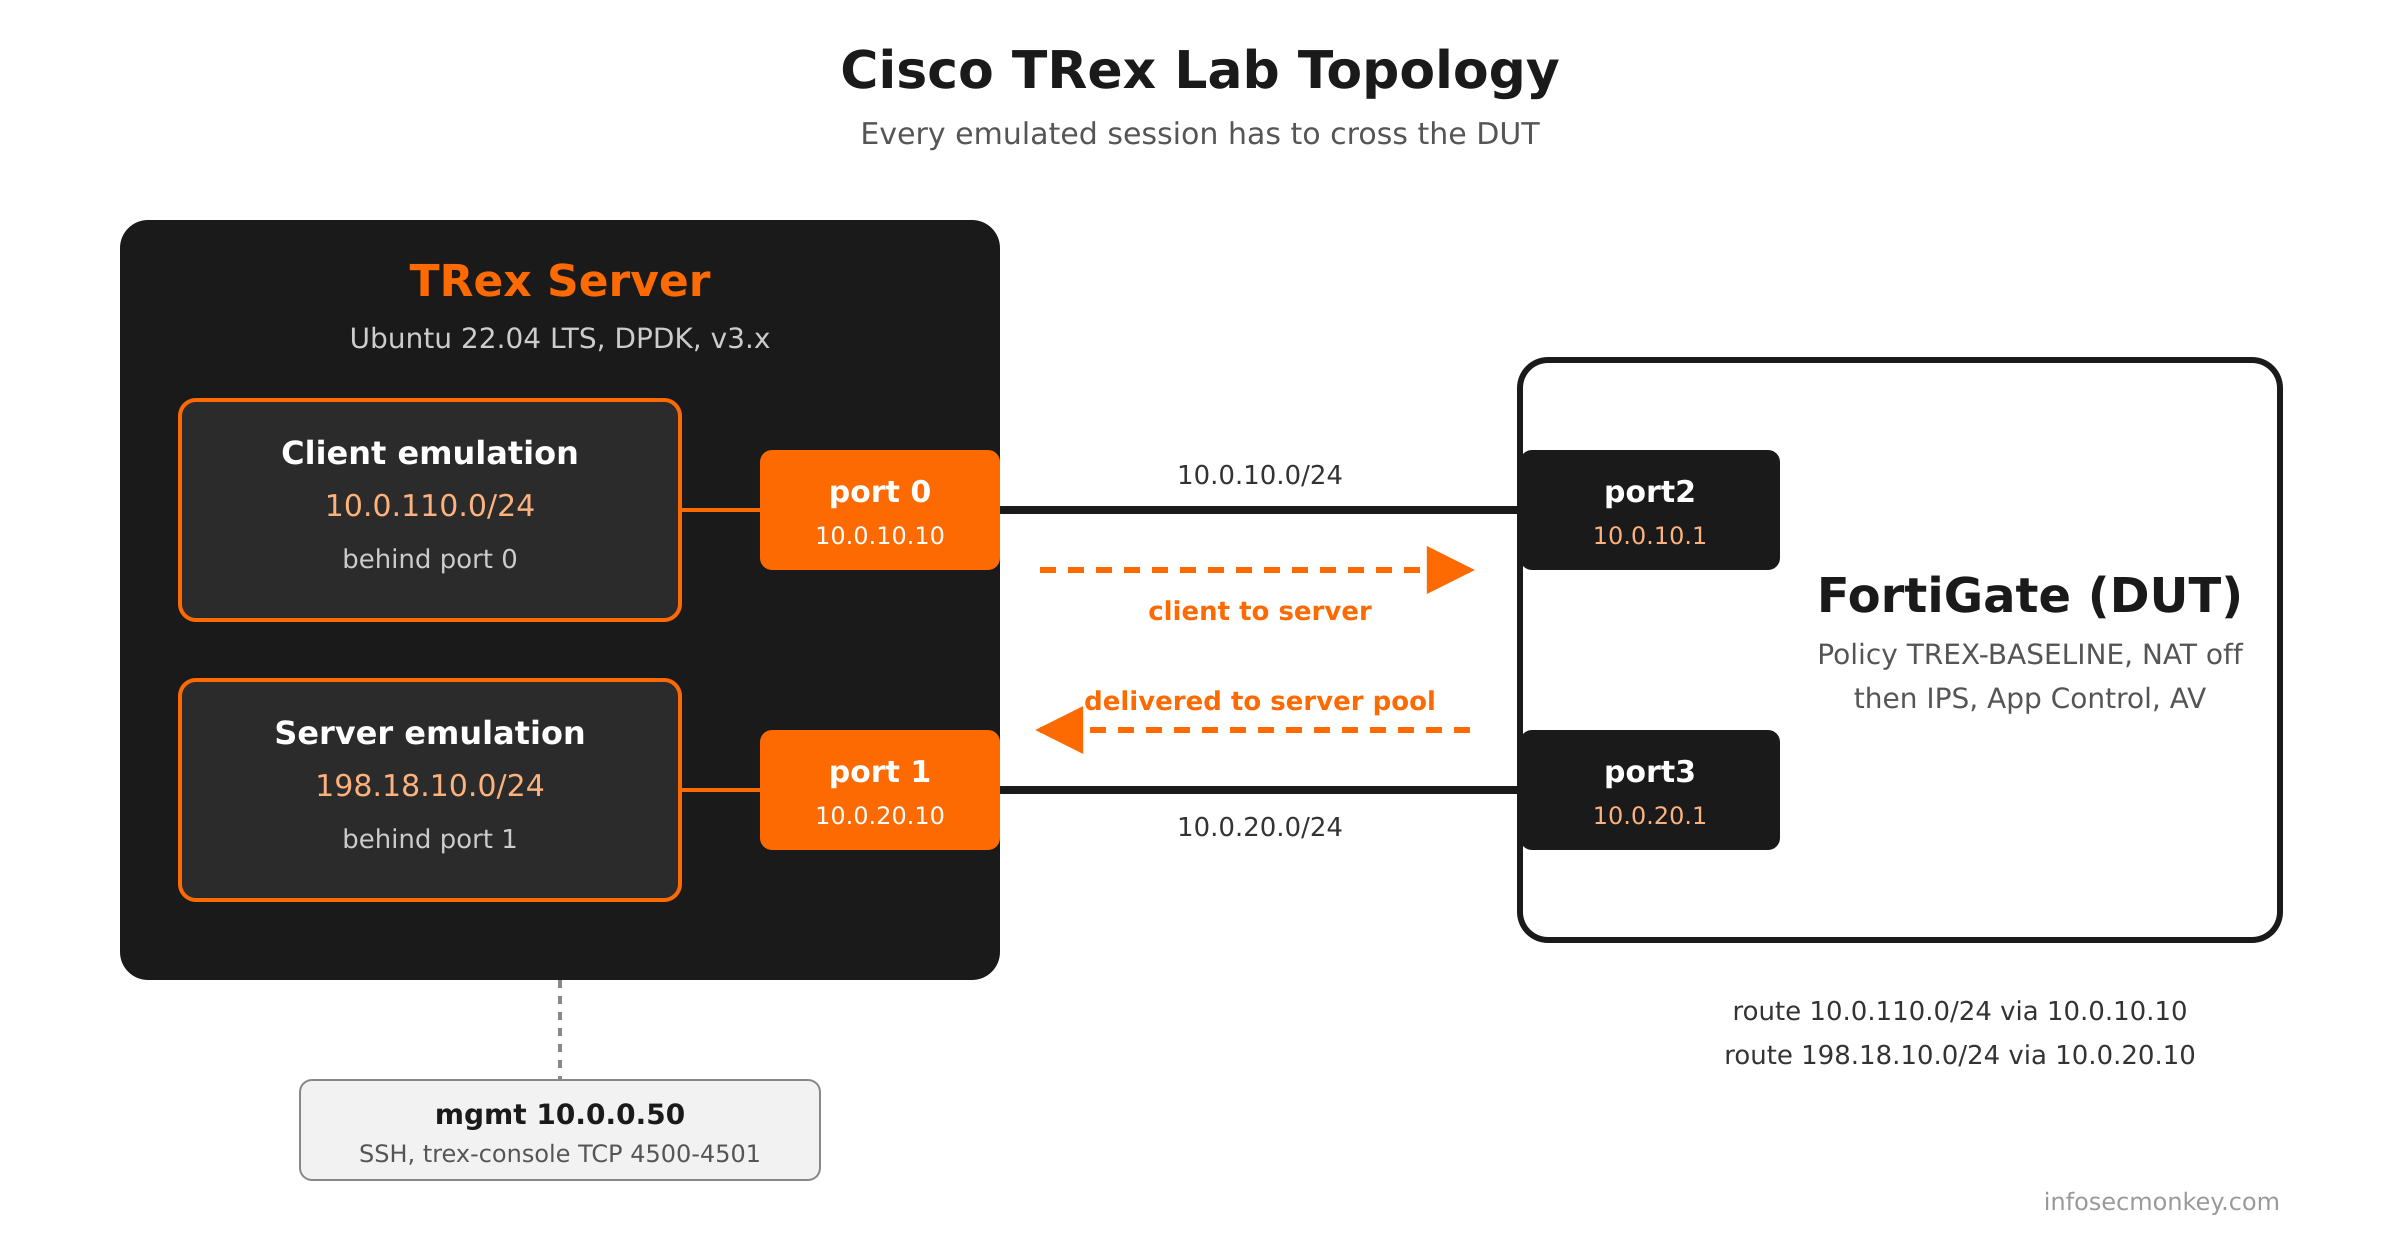
Warning: TRex will happily fill a 100G link. Never patch test ports into a production switch or VLAN. Keep the test segments isolated to the TRex host and the DUT.
Step-by-Step Implementation
Step 1: Prepare the Ubuntu host
Goal: Get a stable kernel, the build tools TRex needs for its kernel module, and IOMMU on for bare metal.
Action: Install packages, stop automatic kernel updates, and enable IOMMU in GRUB if you are on physical hardware.
sudo apt update
sudo apt install -y python3 python3-distutils pciutils wget tmux \
  build-essential linux-headers-$(uname -r)

# A kernel update breaks the compiled igb_uio module. Turn it off.
sudo apt remove -y unattended-upgrades
Bare metal only: enable the IOMMU so the vfio-pci driver can take the NICs. Use amd_iommu=on instead of intel_iommu=on on AMD.
sudo sed -i 's/^GRUB_CMDLINE_LINUX_DEFAULT="/&intel_iommu=on iommu=pt /' \
  /etc/default/grub
sudo update-grub
sudo reboot

# After reboot
dmesg | grep -i -e DMAR -e IOMMU | head
Verify: uname -m returns x86_64, python3 --version returns 3.10.x on 22.04, and on bare metal dmesg shows DMAR: IOMMU enabled or the AMD equivalent.
Step 2: Download and extract TRex
Goal: Get the TRex package onto the host under /opt/trex.
Action: Pull the latest stable release from the TRex release server and extract it.
sudo mkdir -p /opt/trex && cd /opt/trex
sudo wget --no-cache https://trex-tgn.cisco.com/trex/release/latest
sudo tar -xzf latest
ls -d v*
cd /opt/trex/<version>
Everything from here runs from inside /opt/trex/<version>. The folder holds the server binary t-rex-64, the console trex-console, the port setup script dpdk_setup_ports.py, and sample profiles under stl/, astf/, cap2/, and avl/.
Verify: ls shows t-rex-64, trex-console, dpdk_setup_ports.py, stl, and astf.
Step 3: Identify the test ports
Goal: Find the PCI addresses of the two test NICs and confirm which port carries your SSH session.
Action: Run the port setup script in status mode.
sudo ./dpdk_setup_ports.py -sSample output from a VM with three VMXNET3 adapters:
Network devices using DPDK-compatible driver
============================================
<none>

Network devices using kernel driver
===================================
0000:03:00.0 'VMXNET3 Ethernet Controller' if=ens160 drv=vmxnet3 *Active*
0000:0b:00.0 'VMXNET3 Ethernet Controller' if=ens192 drv=vmxnet3
0000:13:00.0 'VMXNET3 Ethernet Controller' if=ens224 drv=vmxnet3
The port marked *Active* is your management interface. It must never appear in the TRex config. Here the test ports are 0b:00.0 (port 0) and 13:00.0 (port 1). Run sudo ./dpdk_setup_ports.py -t for a table that adds MAC addresses and NUMA node, which matters on dual-socket servers.
Verify: You have two PCI addresses written down, neither of them marked Active, both the same NIC type.
Step 4: Build /etc/trex_cfg.yaml
Goal: Tell TRex which NICs to use, what IP each port owns, and which gateway to ARP for.
Action: Either run the interactive wizard with sudo ./dpdk_setup_ports.py -i, or write the file by hand as below.
sudo tee /etc/trex_cfg.yaml > /dev/null <<'EOF'
- version: 2
  port_limit: 2
  interfaces: ["0b:00.0", "13:00.0"]
  port_bandwidth_gb: 10
  c: 2
  port_info:
    - ip: 10.0.10.10
      default_gw: 10.0.10.1
    - ip: 10.0.20.10
      default_gw: 10.0.20.1
  platform:
    master_thread_id: 0
    latency_thread_id: 1
    dual_if:
      - socket: 0
        threads: [2, 3]
EOF| Key | What it does |
|---|---|
| interfaces | PCI addresses in port order. The first entry is port 0 (client side), the second is port 1 (server side). |
| port_info.ip | The IP TRex owns on that port. It answers ARP for it and sends gratuitous ARP. |
| port_info.default_gw | The DUT interface IP. TRex ARPs for it and uses the reply as the destination MAC. If ARP fails, TRex exits. |
| c | Data plane threads per port pair. Must match the length of the threads list. |
| platform | Pins the master, latency, and data plane threads to specific cores. With 4 vCPU: core 0 master, core 1 latency, cores 2 and 3 for traffic. |
| port_bandwidth_gb | Sizes memory pools. Use 10 for 10G NICs and VMXNET3, 40 or 100 for faster cards. |
Tip: On a 2 vCPU laptop VM, drop the platform block and c, and add low_end: true. TRex then runs every thread on core 0 with a smaller memory footprint. Expect roughly 100 kpps of usable rate, which is plenty to validate a lab.
Verify: python3 -c "import yaml,sys; yaml.safe_load(open('/etc/trex_cfg.yaml'))" returns nothing (valid YAML). If PyYAML is missing, install python3-yaml or just let TRex parse it in Step 6.
Step 5: Configure the FortiGate DUT
Goal: Give the FortiGate an interface in each transit subnet, routes back to the emulated pools, and a policy that lets client traffic reach the servers.
Action: Paste the CLI below. Rename port2 and port3 to match your hardware.
config system interface
    edit "port2"
        set alias "TREX-CLIENT"
        set ip 10.0.10.1 255.255.255.0
        set allowaccess ping
    next
    edit "port3"
        set alias "TREX-SERVER"
        set ip 10.0.20.1 255.255.255.0
        set allowaccess ping
    next
end
config router static
    edit 0
        set dst 10.0.110.0 255.255.255.0
        set gateway 10.0.10.10
        set device "port2"
        set comment "TRex emulated clients"
    next
    edit 0
        set dst 198.18.10.0 255.255.255.0
        set gateway 10.0.20.10
        set device "port3"
        set comment "TRex emulated servers"
    next
end
config firewall address
    edit "TREX-CLIENTS"
        set subnet 10.0.110.0 255.255.255.0
    next
    edit "TREX-SERVERS"
        set subnet 198.18.10.0 255.255.255.0
    next
end
config firewall policy
    edit 0
        set name "TREX-BASELINE"
        set srcintf "port2"
        set dstintf "port3"
        set action accept
        set srcaddr "TREX-CLIENTS"
        set dstaddr "TREX-SERVERS"
        set schedule "always"
        set service "ALL"
        set nat disable
        set logtraffic disable
    next
end
Two choices here are deliberate. nat disable keeps the server side seeing real client IPs, which ASTF needs because it does not learn NAT translations. logtraffic disable keeps a million-session test from flooding your FortiAnalyzer and skewing the result. Turn logging back on later as its own test case if log rate is part of the evaluation.
Verify: GUI: Network > Interfaces shows port2 and port3 up with the right IPs. Network > Static Routes lists both pools. Policy & Objects > Firewall Policy shows TREX-BASELINE with NAT off.
Step 6: Start the TRex server and connect the console
Goal: Bring the TRex server up in interactive stateless mode and confirm it resolved the FortiGate MACs.
Action: Run the server inside tmux so it survives an SSH drop, then open the console in a second window.
tmux new -s trex
cd /opt/trex/<version>
sudo ./t-rex-64 -i -c 2
Detach with Control+b then d. The server binds the test NICs to DPDK, reserves hugepages, ARPs for both gateways, and starts listening on TCP 4500 and 4501. Open the console:
cd /opt/trex/<version>
./trex-console

trex> portattr
trex> ping -p 0 -d 10.0.10.1
trex> ping -p 1 -d 10.0.20.1
To drive TRex from your laptop instead, run the console from the client package with ./trex-console -s 10.0.0.50 and allow TCP 4500 to 4501 from your management subnet only.
Verify: portattr shows both ports Link UP, Src IPv4 10.0.10.10 and 10.0.20.10, and a resolved destination MAC for each gateway. Both pings get replies.
Step 7: Run a stateless UDP test
Goal: Push UDP from the client pool to the server pool through the FortiGate and confirm every packet arrives.
Action: Save a small STL profile that rotates the source IP across the /24, then start it at a low rate and step up.
sudo tee /opt/trex/<version>/stl/ism_udp.py > /dev/null <<'EOF'
from trex.stl.api import *

class STLS1(object):
    def create_stream(self, size=64):
        base = (Ether() /
                IP(src="10.0.110.1", dst="198.18.10.1") /
                UDP(sport=1025, dport=5001))
        pad = max(0, size - len(base)) * "x"
        vm = STLScVmRaw([
            STLVmFlowVar(name="src", min_value="10.0.110.1",
                         max_value="10.0.110.254", size=4, op="inc"),
            STLVmWrFlowVar(fv_name="src", pkt_offset="IP.src"),
            STLVmFixIpv4(offset="IP"),
        ])
        pkt = STLPktBuilder(pkt=base / pad, vm=vm)
        return STLStream(packet=pkt, mode=STLTXCont())

    def get_streams(self, direction=0, **kwargs):
        return [self.create_stream(size=512)]

def register():
    return STLS1()
EOF
Why rotate the source: a single 5-tuple hashes to a single FortiGate CPU core or NP queue, so a one-flow test measures one core, not the box. Spreading the source across 254 hosts gives the DUT enough flows to load balance internally.
trex> start -f stl/ism_udp.py -m 100mbps --port 0 -d 30
trex> stats
trex> start -f stl/ism_udp.py -m 50% --port 0 -d 60 --force
trex> tui
Rates accept pps, kpps, mbps, gbps, or a percentage of link speed. Use stop -a to halt everything and clear to zero counters between runs.
Verify: Port 0 opackets equals port 1 ipackets at the end of the run, oerrors and ierrors stay at 0, and the FortiGate shows sessions from 10.0.110.x.
Step 8: Run an advanced stateful HTTP test
Goal: Build real TCP sessions with HTTP payloads so the FortiGate does full session setup, inspection, and teardown.
Action: Restart the server in ASTF mode, save an ASTF profile that uses the bundled HTTP browsing capture with the lab address pools, and run it.
# In the tmux window: Control+c to stop the STL server, then
sudo ./t-rex-64 -i --astf -c 2
sudo tee /opt/trex/<version>/astf/ism_http.py > /dev/null <<'EOF'
from trex.astf.api import *
class Prof1():
def get_profile(self, **kwargs):
c = ASTFIPGenDist(ip_range=["10.0.110.1", "10.0.110.254"],
distribution="seq")
s = ASTFIPGenDist(ip_range=["198.18.10.1", "198.18.10.254"],
distribution="seq")
ip_gen = ASTFIPGen(glob=ASTFIPGenGlobal(ip_offset="1.0.0.0"),
dist_client=c, dist_server=s)
cap = ASTFCapInfo(file="../avl/delay_10_http_browsing_0.pcap",
cps=100)
return ASTFProfile(default_ip_gen=ip_gen, cap_list=[cap])
def register():
return Prof1()
EOF./trex-console
trex> start -f astf/ism_http.py -m 10 -d 120
trex> tuiIn ASTF, -m multiplies the connections per second in the profile, so cps=100 with -m 10 targets 1,000 new HTTP sessions per second. Inside the TUI, press t for the ASTF client and server counters and l for latency.
Verify: Client tcps_connattempt and tcps_connects track each other, server tcps_accepts matches client tcps_connects, and no red error counters appear. On the FortiGate, diagnose sys session stat shows the session count and setup rate climbing.
Step 9: Automate a run with the Python API
Goal: Turn a manual console run into a script you can rerun after every config change.
Action: Use the STL client library that ships with TRex. Start the server in STL mode (-i) first.
cat > ~/ism_run.py <<'EOF'
import sys
sys.path.insert(0, "/opt/trex/<version>/automation/"
                   "trex_control_plane/interactive")
from trex.stl.api import *

PROFILE = "/opt/trex/<version>/stl/ism_udp.py"

c = STLClient(server="127.0.0.1")
c.connect()
try:
    c.reset(ports=[0, 1])
    c.add_streams(STLProfile.load_py(PROFILE).get_streams(), ports=[0])
    c.clear_stats()
    c.start(ports=[0], mult="1gbps", duration=30)
    c.wait_on_traffic(ports=[0])
    st = c.get_stats()
    tx, rx = st[0]["opackets"], st[1]["ipackets"]
    loss = 100.0 * (tx - rx) / tx if tx else 0
    print(f"tx={tx} rx={rx} loss={loss:.4f}%")
finally:
    c.disconnect()
EOF
python3 ~/ism_run.py
Verify: The script prints one line, for example tx=7324210 rx=7324210 loss=0.0000%. Wrap it in a loop that steps mult to binary search the no drop rate (NDR).
Verification and Validation
Build a repeatable test matrix
The point of a test platform is the delta. Run the same TRex profile against the same FortiGate with one change at a time, and record the highest rate with zero loss.
| Run | FortiGate change | TRex profile | Record |
|---|---|---|---|
| 1. Baseline | TREX-BASELINE as configured | ism_udp.py, then ism_http.py | NDR in Gbps, CPS |
| 2. IPS | Add an IPS sensor to the policy | ism_http.py | CPS and throughput vs run 1 |
| 3. App Control | Add an application list | ism_http.py | CPS and throughput vs run 1 |
| 4. Threat protection | IPS + App Control + AV in flow mode | ism_http.py | Throughput vs the datasheet figure |
| 5. Logging | logtraffic all, FortiAnalyzer attached | ism_http.py | CPS impact and log rate |
config firewall policy
    edit <policy-id>
        set utm-status enable
        set ssl-ssh-profile "certificate-inspection"
        set ips-sensor "default"
        set application-list "default"
    next
end
TRex side: what success looks like
trex> stats
Port Statistics
   port    |         0         |         1         |       total
-----------+-------------------+-------------------+------------------
owner      |              root |              root |
link       |                UP |                UP |
state      |      TRANSMITTING |              IDLE |
---        |                   |                   |
Tx bps L2  |       999.87 Mbps |            0 bps  |       999.87 Mbps
Rx bps     |            0 bps  |       999.85 Mbps |       999.85 Mbps
---        |                   |                   |
opackets   |           7324210 |                 0 |           7324210
ipackets   |                 0 |           7324210 |           7324210
oerrors    |                 0 |                 0 |                 0
ierrors    |                 0 |                 0 |                 0
Sample output, trimmed. The two numbers that matter are port 0 opackets and port 1 ipackets. Equal means zero loss through the DUT.
FortiGate side: confirm the traffic is really crossing the box
get router info routing-table static
diagnose sys session stat
diagnose sys session filter src 10.0.110.1
diagnose sys session list
diagnose sniffer packet port3 'net 198.18.10.0/24' 4 10 l
get system performance status
S 10.0.110.0/24 [10/0] via 10.0.10.10, port2, [1/0]
S 198.18.10.0/24 [10/0] via 10.0.20.10, port3, [1/0]The session list should show policy_id matching TREX-BASELINE, and get system performance status shows CPU and session setup rate while the test runs. If the FortiGate has NP offload, compare diagnose npu np6 session-stats or the NP7 equivalent to see how much traffic left the CPU path.
Troubleshooting and Gotchas
1. TRex exits with an ARP or destination MAC error
Symptom: the server stops at startup complaining it could not resolve default_gw, or portattr shows the destination as unresolved. Causes: wrong gateway IP in /etc/trex_cfg.yaml, the test cable or port group lands on the wrong FortiGate interface, or a VLAN mismatch.
# On the FortiGate
get system arp
diagnose sniffer packet port2 'arp' 4 10 l

# In trex-console
trex> portattr
trex> ping -p 0 -d 10.0.10.1
Fix: if the sniffer shows no ARP from 10.0.10.10, the wiring or port group is wrong. If ARP arrives but the FortiGate never replies, the interface IP or subnet does not match. On ESXi, put each test vNIC on its own port group and confirm the FortiGate VM vNIC sits on the same one.
2. Tx is fine but Rx is short
Symptom: port 0 opackets is far higher than port 1 ipackets even at low rate. At high rate this is the DUT hitting its limit, which is the answer you came for. At 100 Mbps it is a config problem, usually a missing route back to the client pool, so the FortiGate fails its reverse path check.
diagnose debug reset
diagnose debug flow filter addr 198.18.10.1
diagnose debug flow show function-name enable
diagnose debug flow trace start 10
diagnose debug enable
# reproduce, then
diagnose debug disable
Fix: a reverse path check fail, drop line means the static route for 10.0.110.0/24 or 198.18.10.0/24 is missing or points at the wrong interface. A Denied by forward policy check line means the policy addresses do not cover the pools.
3. Server will not start: memory, hugepages, or driver bind
Symptom: EAL errors such as Cannot allocate memory or No probed ethernet devices, or the igb_uio module fails to build.
grep -i huge /proc/meminfo
free -h
sudo ./dpdk_setup_ports.py -s
lsmod | grep -e vfio -e igb_uio
dpkg -l | grep linux-headers-$(uname -r)
Fix: give the VM more RAM or add limit_memory: 1024 to the config. Hugepages fragment over time, so a reboot clears a stubborn allocation failure. If igb_uio will not compile, install the headers for the running kernel; a kernel that updated underneath you is the usual cause. In a VM without a virtual IOMMU, vfio-pci needs no-IOMMU mode: echo 1 | sudo tee /sys/module/vfio/parameters/enable_unsafe_noiommu_mode. Lab use only.
Warning: TRex numbers are lab numbers. They are excellent for comparing configs, versions, and features on the same hardware. They are not a certified RFC 9411 or NetSecOPEN result, so present them to customers as relative deltas, not as a datasheet replacement.
References
- TRex documentation index
- TRex manual: installation and platform YAML
- TRex ASTF guide
- trex-core on GitHub
Recent posts
-

-

DNS is one of those technologies that quietly underpins... Full Story
-

BGP issues on FortiGate firewalls usually trace back to... Full Story
-

Every time your laptop talks to your router, a... Full Story
-

If you've spent any time configuring NAT on a... Full Story
-

If you have spent any time configuring firewall policies... Full Story
-

High availability on FortiGate is one of those features... Full Story
-

If you've configured SD-WAN on a FortiGate, you've almost... Full Story
-

FortiLink is the management protocol that turns a FortiSwitch... Full Story
-

FortiSwitches are pretty rock solid from Mean Time Between... Full Story
-

This is a quicky tip. Have you ever gone... Full Story
-

DNS is one of those quiet pieces of internet... Full Story
-

This article is an updated version of the previous... Full Story
-

You will add ns2 as a secondary (slave) BIND9... Full Story
-

In the process of deploying my lab, I needed... Full Story
-

RFC 8805, used to be known as Self-Correcting IP... Full Story
-

Years back, I wrote an article about certificate pinning. ... Full Story
-

FortiGates have the ability to send alerts to Microsoft... Full Story
-

In this post, I am going to walk through... Full Story
-

Troubleshooting VoIP on a FortiGate can feel like trying... Full Story
-

Prior to FortiOS 7.0, there were three commands to... Full Story
-

In this post, I am going to go over... Full Story
-

What we are going to do: We are going... Full Story
-

Choosing between FGCP (FortiGate Clustering Protocol) and FGSP (FortiGate... Full Story
-

Creating a VLAN on macOS (The "Pro" Move) A... Full Story
-

This blog post explores the logic behind how macOS... Full Story
-

Pretty Fly for a Wi-Fi Tell My Wi-Fi Love... Full Story
-

Part of my daily gig is creating BoMs (Bill-of-Materials)... Full Story
-

ICMP introduces several security risks, but careful filtering, rate... Full Story
-

The command diag debug application dhcps -1 enables full... Full Story
-

In the world of FortiOS, execute tac report is... Full Story
-

LLDP; What is it The Link Layer Discovery Protocol... Full Story
-

What it actually does When you run diagnose fdsm... Full Story
-

Monkey Bites are bite-sized, high-impact security insights designed for... Full Story
-

I have run macOS in macOS with Parallels but... Full Story
-

Don't be confused with my other FortiNAC posts where... Full Story
-

This is the third session in a multi-part article... Full Story
-

Today I was configuring key-based authentication on a FortiGate... Full Story
-

Netcat, often called the "Swiss Army knife" of networking,... Full Story
-

At its core, IEEE 802.1X is a network layer... Full Story
-

In case you did not see the previous FortiNAC... Full Story
-

This is our 5th session where we are going... Full Story
-

Now that we have Wireshark installed and somewhat configured,... Full Story
-

The Philosophy of Packet Analysis Troubleshooting isn't about looking... Full Story
-

Stand up TRex on Ubuntu, wire it through a... Full Story
-

1. Executive Summary Objective: Get a working, persistent nftables... Full Story
-

Executive Summary Objective: Identify every cleartext and unauthenticated legacy... Full Story