
If you've spent any time configuring user authentication on... Full Story
By Manny Fernandez
July 16, 2026
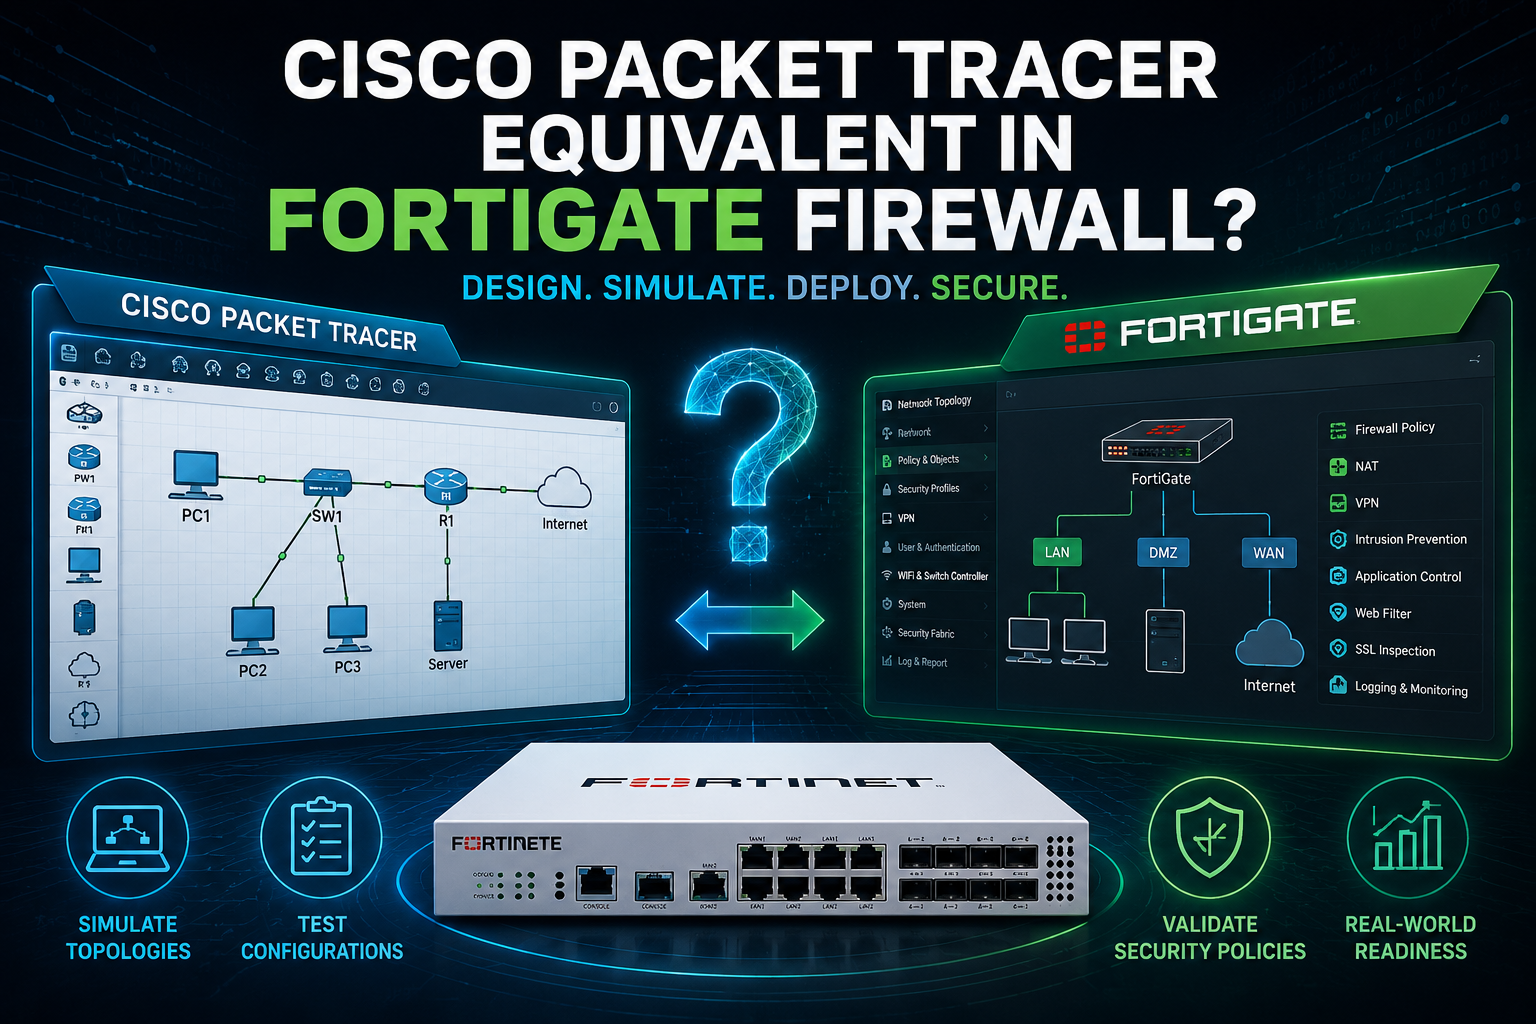
Cisco Packet Tracer equivalent in FortiGate Firewall?
I deployed thousands of ASA firewalls when I was with the different partners. One of my favorite features on the ASA was packet tracer. I miss this feature. FortiGate has two direct equivalents depending on what exactly packet tracer does:
1. The “Config Validation” Equivalent: Policy Lookup (GUI)
If you love ASA’s packet-tracer because it lets you mock up a fake packet (Source IP/Port, Destination IP/Port, Interface) to see if the firewall would allow it without sending real traffic, the FortiGate equivalent is Policy Lookup.
* Where it is: In the GUI, navigate to Policy & Objects > Firewall Policy.
* How to use it: Click the Policy Lookup button in the top menu bar.
* What it does: You input the protocol, source/destination interfaces, IPs, and ports. The FortiGate will instantly highlight the exact firewall policy it matches, or tell you if it hits the implicit deny.
* CLI alternative: You can also run this via the CLI using diagnose firewall iprope lookup <src_ip> <src_port> <dst_ip> <dst_port> <protocol> <ingress_interface>.
2. The “Deep Troubleshooting” Equivalent: Debug Flow (CLI)
If you are using packet-tracer to see exactly why a packet is dropping mid-flight (e.g., asymmetric routing, RPF check failures, IPS drops, or NAT translations), the FortiGate equivalent is diagnose debug flow.
Unlike the ASA, this requires real live traffic to traverse the box. It is incredibly powerful and shows you a step-by-step internal log of the FortiGate’s packet-processing engine.
Here is the standard playbook to run it:
# 1. Clear any old filters and disable active traces
diagnose debug disable
diagnose debug flow trace stop
diagnose debug flow filter clear
# 2. Set your target filter (can filter by addr, port, proto, etc.)
diagnose debug flow filter addr 192.168.1.50
diagnose debug flow filter port 443
# 3. Enable console display and show internal rule/policy matching (iprope)
diagnose debug flow show console enable
diagnose debug flow show iprope enable
diagnose debug flow show function-name enable
# 4. Start the trace for a specific packet count (e.g., 20 packets) so it doesn’t flood the CLI
diagnose debug flow trace start 20
diagnose debug enable
What the output looks like:
When a live packet hits the firewall, it will spit out a step-by-step trace showing the ingress interface, session creation, routing table lookups, NAT transformations, and the specific security policy ID it hits:
vd-root received a packet(proto=6, 192.168.1.50:51234->8.8.8.8:443) from port1.
allocate a new session-000a12cd
find a route: gw-172.16.1.1 via wan1
Allowed by Policy-5: SNAT blk
⚠️ Pro-Tip for FortiGate Hardware: If the traffic you are troubleshooting is already an established stream, it might be getting offloaded to the Network Processor (NP6/NP7 ASIC) chips. When traffic is hardware-accelerated, it bypasses the main CPU, meaning diagnose debug flow won’t see it. If you aren’t seeing output, you’ll need to temporarily disable ASIC offloading on the firewall policy you are testing.
Recent posts
-

-

DNS is one of those technologies that quietly underpins... Full Story
-

BGP issues on FortiGate firewalls usually trace back to... Full Story
-

Every time your laptop talks to your router, a... Full Story
-

If you've spent any time configuring NAT on a... Full Story
-

If you have spent any time configuring firewall policies... Full Story
-

High availability on FortiGate is one of those features... Full Story
-

If you've configured SD-WAN on a FortiGate, you've almost... Full Story
-

FortiLink is the management protocol that turns a FortiSwitch... Full Story
-

FortiSwitches are pretty rock solid from Mean Time Between... Full Story
-

This is a quicky tip. Have you ever gone... Full Story
-

DNS is one of those quiet pieces of internet... Full Story
-

This article is an updated version of the previous... Full Story
-

You will add ns2 as a secondary (slave) BIND9... Full Story
-

In the process of deploying my lab, I needed... Full Story
-

RFC 8805, used to be known as Self-Correcting IP... Full Story
-

Years back, I wrote an article about certificate pinning. ... Full Story
-

FortiGates have the ability to send alerts to Microsoft... Full Story
-

In this post, I am going to walk through... Full Story
-

Troubleshooting VoIP on a FortiGate can feel like trying... Full Story
-

Prior to FortiOS 7.0, there were three commands to... Full Story
-

In this post, I am going to go over... Full Story
-

What we are going to do: We are going... Full Story
-

Choosing between FGCP (FortiGate Clustering Protocol) and FGSP (FortiGate... Full Story
-

Creating a VLAN on macOS (The "Pro" Move) A... Full Story
-

This blog post explores the logic behind how macOS... Full Story
-

Pretty Fly for a Wi-Fi Tell My Wi-Fi Love... Full Story
-

Part of my daily gig is creating BoMs (Bill-of-Materials)... Full Story
-

ICMP introduces several security risks, but careful filtering, rate... Full Story
-

The command diag debug application dhcps -1 enables full... Full Story
-

In the world of FortiOS, execute tac report is... Full Story
-

LLDP; What is it The Link Layer Discovery Protocol... Full Story
-

What it actually does When you run diagnose fdsm... Full Story
-

Monkey Bites are bite-sized, high-impact security insights designed for... Full Story
-

I have run macOS in macOS with Parallels but... Full Story
-

Don't be confused with my other FortiNAC posts where... Full Story
-

This is the third session in a multi-part article... Full Story
-

Today I was configuring key-based authentication on a FortiGate... Full Story
-

Netcat, often called the "Swiss Army knife" of networking,... Full Story
-

At its core, IEEE 802.1X is a network layer... Full Story
-

In case you did not see the previous FortiNAC... Full Story
-

This is our 5th session where we are going... Full Story
-

Now that we have Wireshark installed and somewhat configured,... Full Story
-

The Philosophy of Packet Analysis Troubleshooting isn't about looking... Full Story
-

InfoSecMonkey Threat Response October 24, 2026 | No fluff.... Full Story
-

InfoSecMonkey Threat Response October 24, 2026 | No fluff.... Full Story
-

Plus what you actually get with FortiCare Essential, Premium... Full Story