If you've spent any time configuring user authentication on... Full Story
By Manny Fernandez
February 23, 2026
Basics of Wireshark – Session 2 – Ring Buffers, Color Schemes and CLI Tools
Ring Buffers
A Wireshark ring buffer is a specific capture configuration used for long-term monitoring or catching intermittent network issues without crashing your computer or filling up your hard drive.
Think of it as a “looping” recording system, similar to how a dashcam or a security camera operates.
This is a session 2 of a series of Wirshark. To read Session 1, click here.
How a Ring Buffer Works
When you perform a standard capture, Wireshark streams data into one ever-growing file. If you leave this running on a busy network, the file will eventually consume all available RAM or disk space. A Ring Buffer solves this by breaking the capture into multiple smaller files and “cycling” through them. The primary goal of a ring buffer is sustained visibility with a finite footprint.
This can be used to capture intermitent issues and you want to leave the capture running. You may also not want to crash your machine and having it run out of disk space and RAM trying to keep a 30GB .pcap file going.
Setting it Up
To set this up, you head to Capture, Options, Output or you can choose the Capture Option button on the tools bar.

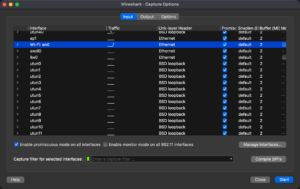
You will choose the interface you want to capture on, then choose Output on the top.
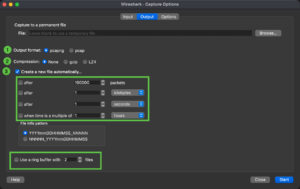
There you can choose the format you want to save in .pcap or .pcapng (I will explain below). The compression if any to use for the files it collects, and if you want to create multiple files, you can select the criterial, the naming convention it will use for the files it creates, and finally, the number of files you want to store (e.g. 10 files that are 500MB a piece)
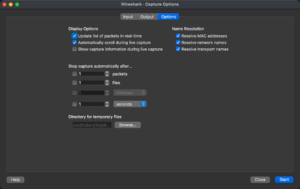
And finally some other options around resolution of MAC address and names.
Note: You have to give the file an initial name.
Pro-Tip: If you are using a ring buffer for a very high-speed link (10Gbps+), ensure your disk write speed can keep up with the “wrap-around” rate, or you’ll start dropping packets during the file-switch transition.
PCAP vs PCAPNG
If you’ve ever used Wireshark or tcpdump, you’ve likely encountered these two file extensions. While they both store packet data, pcapng (PCAP Next Generation) is a modern, flexible upgrade to the classic pcap format.
Think of it like moving from a plain text file (.txt) to a rich document format (.docx)—one gets the job done, but the other holds much more “metadata” about the environment.
Quick Comparison Table
Key Differences Explained
1. Support for Multiple Interfaces
In a standard pcap file, you can only record traffic from one network interface (e.g., just your Wi-Fi card). If you try to merge captures from two different sources, the format struggles to distinguish which packet came from where. pcapng uses “Interface Description Blocks,” allowing you to capture from multiple ports simultaneously and keep them organized within a single file.
2. Metadata and Annotations
This is the “killer feature” for security analysts.
-
pcap: Only stores the packet data and a basic timestamp.
-
pcapng: Allows you to add comments to specific packets. You can also store system information, such as the OS version, the capture filter used, and even the hardware name where the capture took place.
3. Resolution and Precision
While both can handle high-speed traffic, pcapng was built with (nanosecond) precision in mind. It uses a flexible timestamp format that allows it to scale as network speeds increase and hardware timers become more accurate.
4. File Structure
The internal architecture of the two formats is fundamentally different:
-
pcap is a simple linear format: a global header followed by a series of packets.
-
pcapng is block-based. It uses a hierarchy of blocks (Section Header, Interface Description, Enhanced Packet, etc.). This modularity means that if a new type of network data is invented tomorrow, pcapng can incorporate it without breaking the whole file format.
Which one should you use?
-
Use pcapng for almost everything. It is the default in modern Wireshark versions. If you need to document your findings (e.g., “Packet 402 is where the SQL injection starts”), pcapng is a requirement.
-
Use pcap only if you are using very old legacy tools, specific embedded hardware, or certain command-line utilities that haven’t been updated in a decade.
Color Schemes
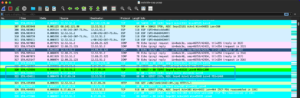
Wireshark uses Coloring Rules to help you quickly identify different types of network traffic without having to dig into the packet details of every single line. It’s essentially a visual shorthand for protocol analysis.
There are two main types of coloring in Wireshark: Permanent Coloring Rules and Conversation Coloring.
1. Permanent Coloring Rules
These are the default background and foreground colors you see when you first open a capture file. They are based on specific display filters.
-
Logic: Wireshark processes these rules from top to bottom. The first rule that matches the packet is the one that gets applied.
-
Default Meaning: While these can be customized, the standard set usually follows this logic:
-
Black Background: Typically indicates “Bad” traffic (TCP Retransmissions, Checksum errors, or RST packets).
-
Light Blue: UDP traffic.
-
Light Purple: TCP traffic.
-
Light Green: HTTP or HTTPS traffic.
-
Yellow: SMB or NetBIOS traffic.
-
2. Conversation Coloring
If you are troubleshooting a specific connection between two devices and the screen is cluttered with other traffic, you can apply Conversation Colors.
-
How it works: You right-click a packet and select “Colorize Conversation.”
-
The Result: Wireshark assigns a unique color to every packet belonging to that specific “stream” (IP to IP, or Port to Port). This makes it incredibly easy to track a single handshake or data transfer as you scroll through thousands of packets.
3. The Coloring Rule Editor
You can find this under View > Coloring Rules. This interface allows you to:
-
Create new rules: For example, you could make all traffic from your server’s IP address turn bright orange.
-
Reorder rules: Move critical alerts (like ICMP Errors) to the top so they aren’t “hidden” by more general rules.
-
Disable rules: Toggle specific colors off if the screen feels too “busy.”
Pro Tip: If the colors are distracting, you can quickly toggle all coloring on or off using the Colorize Packet List icon in the main toolbar (it looks like a small highlighter).
I like to be able to identify SYN, SYN/ACK and ACK (3-Way Handshake) so I have them in different colors.
Some of these are defaults.
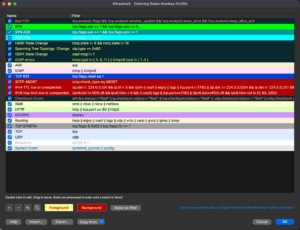
Here you can see my custom ones where I made the SYN packet alone be bright green, the SYN/ACK to be a darker green, and the ACK only is like a blue color. You can see the other ones that are default. Note that you should have the Bad Packet at the top becuase you may have a situation where the SYN packet is bad, and you would never see it because the it would never color it black and red.
Command Line Tools
When you install Wireshark, it includes command line tools such as tshark and dumpcap. These can be used to capture files in the background with little overhead from the GUI etc. The Ring Buffer features are built in although differnt in both.
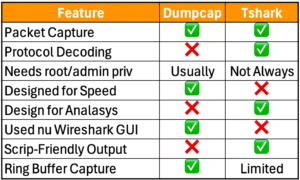
TShark
TShark is part of Wireshark and allows you use the command line to capture.
tshark -i 1 -ta -s 68 -F pcap -f "udp port 53" -b filesize:100000 -b files:100 -a files:100 -w capture.pcap
Lets break it down
- tshark – this is the executable
- -i – This identifies the interface to be used,
- 1 is the interface itself
- -ta set the timestamp format, in this case
ais equal toabsolute- ad – absolute with date
- adoy – absolute using date and year (e.g. YYYY/DOY)
- d – delta. Since the last packet
- dd – since the last packet ‘displayed’ was captured.
- e – epoch
- r – relative
- u – UTC
- ud – UTC with date
- udoy – UTC with date using day of year
- -s This sets the snaphot-length (e.g. no more than
snapshot-lengthwhen capturing data - 68 – Is the
snapshot-length - -F Is the file format to capture
- pcap – is the format from the
-Foption - -f , this defines the capture filter
- udp port 53 – Customer only wanted UDP 53 traffic to be captured.
- -b stands for ring-buffer which essentially tells
tsharkto use the different options to capture the file - filesize – Self explanatory and tells
tsharkto use 10000 kb each - files – how many files it will create in this example
100 - -a Stand for
autostopoptions are :- duration
- files
- filesize
- packets
- 100 the number of files it will write before
-aautostopping.
Dumpcap
Dumpcap is a Wireshark command-line tool for network traffic sniffing, optimized for minimal packet loss. Key flags include -i to select interfaces, -w to save pcapng files, -b for ring buffer options (file size/duration), -a to set autostop conditions, and -f to apply BPF capture filters.
dumpcap -i eth0 -a duration:60 -w capture.pcapngdumpcap -i eth0 -a duration:60 -w capture.pcapng
Key dumpcap Flags and Usage
Interface Selection:
-D: List all available interfaces for capturing.
-i <interface>: Capture from a specific interface (name or index).
Capture File Handling:
-w <filename>: Write raw packets to a file (use – for stdout).
-p Do not put the interface into promiscuous mode.
-n Save files in pcap format instead of the default pcapng.
Ring Buffer (Multiple Files):
-b filesize:<value>KB/MB/GB: Switch to next file after size limit.
-b duration:<seconds>: Switch to next file after time elapsed.
-b files:<value>: Create a ring buffer with a maximum number of files, overwriting the oldest.
Capture Autostop:
-a duration:<seconds>: Stop writing to a file after a set time.
-a filesize:<value>: Stop writing after a specific file size.
-a packets:<value>: Stop after capturing a certain number of packets.
Filtering and Limits:
–f “<capture filter>”: Set a BPF filter (e.g., host 192.168.1.1).
-s <snaplen>: Set the snapshot length (bytes) to capture per packet.
-C <byte_limit>: Limit the number of bytes for buffering.
Miscellaneous:
-q Quiet mode; do not report packet capture counts.
-v Print version information.
-h Display help.
Recent posts
-

-

DNS is one of those technologies that quietly underpins... Full Story
-

BGP issues on FortiGate firewalls usually trace back to... Full Story
-

Every time your laptop talks to your router, a... Full Story
-

If you've spent any time configuring NAT on a... Full Story
-

If you have spent any time configuring firewall policies... Full Story
-

High availability on FortiGate is one of those features... Full Story
-

If you've configured SD-WAN on a FortiGate, you've almost... Full Story
-

FortiLink is the management protocol that turns a FortiSwitch... Full Story
-

FortiSwitches are pretty rock solid from Mean Time Between... Full Story
-

This is a quicky tip. Have you ever gone... Full Story
-

DNS is one of those quiet pieces of internet... Full Story
-

This article is an updated version of the previous... Full Story
-

You will add ns2 as a secondary (slave) BIND9... Full Story
-

In the process of deploying my lab, I needed... Full Story
-

RFC 8805, used to be known as Self-Correcting IP... Full Story
-

Years back, I wrote an article about certificate pinning. ... Full Story
-

FortiGates have the ability to send alerts to Microsoft... Full Story
-

In this post, I am going to walk through... Full Story
-

Troubleshooting VoIP on a FortiGate can feel like trying... Full Story
-

Prior to FortiOS 7.0, there were three commands to... Full Story
-

In this post, I am going to go over... Full Story
-

What we are going to do: We are going... Full Story
-

Choosing between FGCP (FortiGate Clustering Protocol) and FGSP (FortiGate... Full Story
-

Creating a VLAN on macOS (The "Pro" Move) A... Full Story
-

This blog post explores the logic behind how macOS... Full Story
-

Pretty Fly for a Wi-Fi Tell My Wi-Fi Love... Full Story
-

Part of my daily gig is creating BoMs (Bill-of-Materials)... Full Story
-

ICMP introduces several security risks, but careful filtering, rate... Full Story
-

The command diag debug application dhcps -1 enables full... Full Story
-

In the world of FortiOS, execute tac report is... Full Story
-

LLDP; What is it The Link Layer Discovery Protocol... Full Story
-

What it actually does When you run diagnose fdsm... Full Story
-

Monkey Bites are bite-sized, high-impact security insights designed for... Full Story
-

I have run macOS in macOS with Parallels but... Full Story
-

Don't be confused with my other FortiNAC posts where... Full Story
-

This is the third session in a multi-part article... Full Story
-

Today I was configuring key-based authentication on a FortiGate... Full Story
-

Netcat, often called the "Swiss Army knife" of networking,... Full Story
-

At its core, IEEE 802.1X is a network layer... Full Story
-

In case you did not see the previous FortiNAC... Full Story
-

This is our 5th session where we are going... Full Story
-

Now that we have Wireshark installed and somewhat configured,... Full Story
-

The Philosophy of Packet Analysis Troubleshooting isn't about looking... Full Story
-

1. High-Level Overview The FortiGate Wireless Intrusion Detection System... Full Story
-

What MIMO Actually Does Multiple Input, Multiple Output (MIMO)... Full Story
-

A practitioner's tour of the diagnose, test, and fnsysctl... Full Story