If you've spent any time configuring user authentication on... Full Story
By Manny Fernandez
June 9, 2026
The FortiOS Commands the Admin Guide Forgot
A practitioner’s tour of the diagnose, test, and fnsysctl corners of FortiOS that never made it into the official documentation.
Spend enough time on a FortiGate console and you start to notice a pattern. The official CLI Reference is enormous, but the commands that actually save you at 2 a.m. during an outage are often the ones it barely mentions, or skips entirely. They live under diagnose, behind numbered daemon menus, and inside a handful of low-level utilities that Fortinet documents with a single line if at all.
This post is a field guide to those corners. None of this is a secret backdoor, and that distinction matters. These are operator tools that ship in the product, gated behind the super_admin profile, intended for troubleshooting. Treat them as power tools: useful, occasionally sharp, and worth testing in a lab before you run them on a production box.
One caveat up front. The numbered actions under diagnose test application are version specific. What restarts a daemon on FortiOS 7.2 may report stats on 7.4 or do nothing on 8.0. Every example below was checked against current 7.4 and 7.6 references, but always confirm against your running version with the daemon’s own menu before you act.
The diagnose test application menus
This is the single most underdocumented part of the CLI, and the most useful. Almost every FortiOS daemon exposes a menu of numbered actions through diagnose test application <daemon> <number>. The official library lists the daemon names but rarely tells you what each number does. The trick is that most daemons respond to a discovery call. On many of them, action 99 restarts the process, and calling the command with no recognized number, or a number like 0, prints the available menu.
The IPS monitor is the cleanest example to learn on, because its menu is stable across versions:
diagnose test application ipsmonitor 1# Display IPS engine information
diagnose test application ipsmonitor 2# Toggle IPS engine enable/disable
diagnose test application ipsmonitor 5# Toggle IPS bypass status
diagnose test application ipsmonitor 99# Restart all IPS engines
That ipsmonitor 99 is the one to remember. When IPS is misbehaving and pinning a CPU core, restarting the engines is far less disruptive than rebooting the unit. The 2 toggle is your fast way to prove whether IPS is the cause of a traffic problem without tearing down policy.
The same pattern applies across the daemon list. The logging daemons (miglogd, fgtlogd, locallogd) accept numbered actions for live statistics and restarts. The proxy daemon wad, the URL filter urlfilter, the DNS proxy dnsproxy, the authentication daemon fnbamd, and many more all carry their own menus. The workflow is always the same: query the daemon’s menu first, read what each number does on your version, then act.
A safe way to explore without guessing:
diagnose test application <daemon>
Run with just the daemon name, or with an out of range number, and most daemons echo their menu rather than doing anything destructive. Read before you fire.
Watching the GUI write CLI for you
This one belongs in every engineer’s muscle memory. When you want to know exactly what configuration the web interface generates for a given action, turn on CLI echo and then click around the GUI:
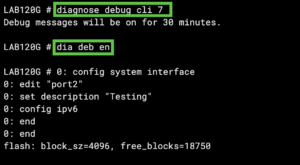
diagnose debug cli 7
diagnose debug enable
On some builds the level is 8 rather than 7, so if 7 is quiet, try 8. Now every change you make in the web UI prints as the equivalent CLI command on your console session. It is the fastest way to learn the CLI syntax for a feature you only know how to configure in the GUI, and it is invaluable for building repeatable scripts or documentation. Turn it off with diagnose debug disable when you are done.
fnsysctl, the closest thing to a shell
FortiOS runs on Linux, but Fortinet deliberately hides the underlying shell. The `fnsysctl` command is the sanctioned peephole into it. It lets a super_admin run a small, fixed set of underlying utilities:
fnsysctl ls /# List the root filesystem
fnsysctl cat <file># Read a file (where permitted)
fnsysctl ifconfig# Raw interface state, Linux style
fnsysctl df# Filesystem usage
This is barely documented, and its behavior has tightened over time. On older units fnsysctl cat worked freely. On newer FortiOS releases you will often see a Not allowed error on cat even as ls keeps working, because Fortinet has been progressively restricting it. Do not count on any particular subcommand being available on a given firmware. It is a diagnostic aid, not a guaranteed interface.
A word of judgment here. fnsysctl touches real filesystem internals. Moving or deleting system files through it can leave a unit unbootable, and it is a known path that attackers have abused to hide their tracks after a compromise. Use it to look, almost never to change.
Performance and process visibility
When a FortiGate feels slow, these are the commands that tell you why. They are documented, but thinly, and they are the backbone of any real triage:
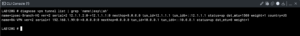
get system performance status# One-shot CPU, memory, sessions, throughput
diagnose sys top 3 30# Live process monitor, refresh 3s, 30 rows
diagnose sys top-mem# Processes sorted by memory consumption
In diagnose sys top, press P to sort by CPU, M to sort by memory, and q to quit. The process names map back to the daemons in the section above, so a runaway wad or ipsengine in top tells you exactly which daemon to investigate or restart.
Memory pressure deserves its own note, because conserve mode is one of the most misunderstood FortiGate behaviors:
diagnose hardware sysinfo conserve
This prints the live conserve mode thresholds and where you currently sit. The three thresholds are green, red, and extreme. Crossing the red threshold puts the unit into conserve mode, where new UTM scanning is skipped to protect the box. Crossing the extreme threshold means new sessions get dropped outright. Green is the level it has to fall back to before conserve mode releases. The percentages are configurable, and knowing where you are against them is the difference between a calm diagnosis and a panicked reboot.
Flow tracing, the debugger you will use most
The flow trace is the FortiGate equivalent of following a packet through the box step by step. It is the tool I reach for first on any policy or routing question:
diagnose debug flow filter addr <ip>
diagnose debug flow show function-name enable
diagnose debug flow show iprope enable
diagnose debug flow trace start 100
diagnose debug enable
The filter narrows the trace to one address so you are not drowning in output. The iprope option shows which internal firewall policy the traffic is hitting, which is exactly what you need when a session is being dropped and you cannot work out which rule is responsible. Stop it with diagnose debug flow trace stop and diagnose debug disable.
Pair this with the packet sniffer when you need to confirm what is actually on the wire:
diagnose sniffer packet any 'host <ip> and icmp' 4
The verbosity number at the end controls how much detail you get, with 4 showing headers plus interface names, which is usually the right level for tracing a path problem.
A grep trick that pays for itself
FortiOS pipes output to a built-in grep, and it accepts alternation if you escape the pipe. This lets you pull two or more patterns out of a long config in one pass:
show full-configuration | grep 'edit\|set ip'#Do this from within a section to avoid massive data returned.
diagnose vpn tunnel list | grep 'name\|esp\|ah'
That second one is a daily-driver for IPsec troubleshooting. Instead of scrolling through pages of tunnel output, you get just the tunnel names and their security parameters lined up together.
A note on the things that are actually hidden
You will find blog posts and forum threads claiming there are secret maintainer logins or master passwords baked into FortiOS. Be skeptical. Anything genuinely hidden in that sense is a vulnerability, not a feature, and Fortinet has had real CVEs over the years tied to undisclosed access. The commands in this post are different in kind. They are sanctioned operator tools, gated behind the super_admin profile, that Fortinet simply chose not to document thoroughly. If you ever encounter a path into a FortiGate that bypasses authentication, treat it as a security incident, not a shortcut.
The short version
The official CLI Reference is your map of the documented territory. The commands above are the unmarked trails: the daemon menus under diagnose test application, the GUI to CLI echo with diagnose debug cli, the fnsysctl peephole, the flow trace, and the performance and conserve mode commands that tell you why a box is struggling. Learn the IPS monitor menu, get comfortable reading a flow trace, and keep diagnose debug cli 7 in your back pocket. They will not show up in the manual’s index, but they will get you out of trouble (remember to use dia deb enable with the cli 7 command.
As always, lab first, production second.
Recent posts
-

-

DNS is one of those technologies that quietly underpins... Full Story
-

BGP issues on FortiGate firewalls usually trace back to... Full Story
-

Every time your laptop talks to your router, a... Full Story
-

If you've spent any time configuring NAT on a... Full Story
-

If you have spent any time configuring firewall policies... Full Story
-

High availability on FortiGate is one of those features... Full Story
-

If you've configured SD-WAN on a FortiGate, you've almost... Full Story
-

FortiLink is the management protocol that turns a FortiSwitch... Full Story
-

FortiSwitches are pretty rock solid from Mean Time Between... Full Story
-

This is a quicky tip. Have you ever gone... Full Story
-

DNS is one of those quiet pieces of internet... Full Story
-

This article is an updated version of the previous... Full Story
-

You will add ns2 as a secondary (slave) BIND9... Full Story
-

In the process of deploying my lab, I needed... Full Story
-

RFC 8805, used to be known as Self-Correcting IP... Full Story
-

Years back, I wrote an article about certificate pinning. ... Full Story
-

FortiGates have the ability to send alerts to Microsoft... Full Story
-

In this post, I am going to walk through... Full Story
-

Troubleshooting VoIP on a FortiGate can feel like trying... Full Story
-

Prior to FortiOS 7.0, there were three commands to... Full Story
-

In this post, I am going to go over... Full Story
-

What we are going to do: We are going... Full Story
-

Choosing between FGCP (FortiGate Clustering Protocol) and FGSP (FortiGate... Full Story
-

Creating a VLAN on macOS (The "Pro" Move) A... Full Story
-

This blog post explores the logic behind how macOS... Full Story
-

Pretty Fly for a Wi-Fi Tell My Wi-Fi Love... Full Story
-

Part of my daily gig is creating BoMs (Bill-of-Materials)... Full Story
-

ICMP introduces several security risks, but careful filtering, rate... Full Story
-

The command diag debug application dhcps -1 enables full... Full Story
-

In the world of FortiOS, execute tac report is... Full Story
-

LLDP; What is it The Link Layer Discovery Protocol... Full Story
-

What it actually does When you run diagnose fdsm... Full Story
-

Monkey Bites are bite-sized, high-impact security insights designed for... Full Story
-

I have run macOS in macOS with Parallels but... Full Story
-

Don't be confused with my other FortiNAC posts where... Full Story
-

This is the third session in a multi-part article... Full Story
-

Today I was configuring key-based authentication on a FortiGate... Full Story
-

Netcat, often called the "Swiss Army knife" of networking,... Full Story
-

At its core, IEEE 802.1X is a network layer... Full Story
-

In case you did not see the previous FortiNAC... Full Story
-

This is our 5th session where we are going... Full Story
-

Now that we have Wireshark installed and somewhat configured,... Full Story
-

The Philosophy of Packet Analysis Troubleshooting isn't about looking... Full Story
-

Do you use Sequence Groups In your Firewall Policies? ... Full Story
-

The other day, I opened my Wireshark for macOS... Full Story
-

1. Executive Summary Objective This guide walks through the... Full Story