
If you've spent any time configuring user authentication on... Full Story
By Manny Fernandez
September 3, 2026
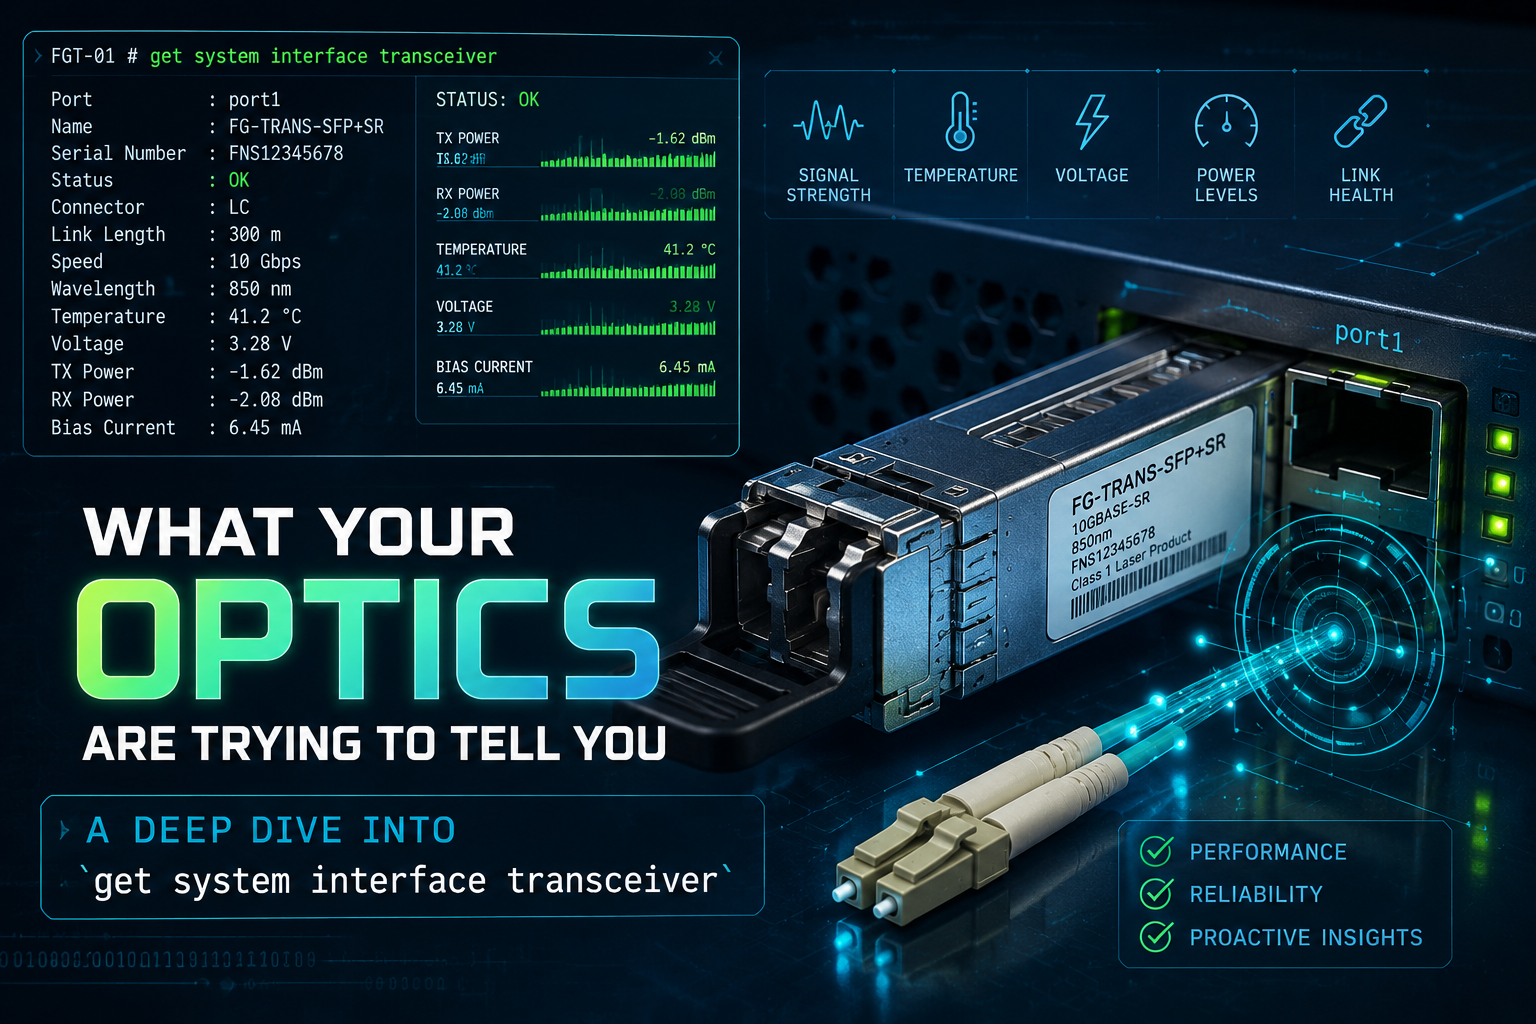
What Your Optics Are Trying to Tell You: A Deep Dive into `get system interface transceiver`
The command nobody reads until something breaks
Every FortiGate with SFP or SFP+ cages ships with a diagnostic command that most engineers never touch until a circuit starts flapping at 2 AM. get system interface transceiver pulls the digital diagnostics data straight off the optic’s own EEPROM: who made it, what it is, and how it’s actually performing right now in your rack, not how it performed on the vendor’s test bench.
Most people run it, see a wall of numbers, confirm the port isn’t showing “not detected,” and move on. That’s a mistake. This single command tells you whether an outage is a fiber problem, a laser that’s dying of old age, a dirty connector, or a transceiver that was never going to work with your chassis in the first place. Read it correctly and you skip a truck roll. Read it wrong and you swap a perfectly healthy switch for nothing.
This guide breaks down every field, every flag, and every “N/A” you’ll see, and shows you how to turn the output into an actual diagnosis.
Where this data actually comes from
Before the syntax, it helps to know what you’re looking at. Optical transceivers built to the SFP and SFP+ form factor implement a two-wire (I2C) management interface defined by SFF-8472, the “Diagnostic Monitoring Interface for Optical Transceivers” specification. That spec defines two memory pages inside the module: a base ID page (vendor name, part number, serial number, connector type) and a diagnostic monitoring page that continuously updates four analog readings plus a set of vendor-programmed alarm and warning thresholds for each one.
FortiOS reads both pages and formats them for you. It isn’t measuring anything itself. Every number in this command’s output was generated by circuitry inside the transceiver, which means the accuracy, and the presence, of this data depends entirely on what you plugged in. A cheap unbranded optic with no DDM support will hand FortiOS nothing to show, and FortiOS will faithfully report that as “N/A.” That distinction matters and we’ll come back to it.
QSFP and QSFP28 optics (40G and 100G form factors) use a related but different specification, SFF-8636, for their own diagnostic page. The concept is identical, current readings plus alarm and warning thresholds, but it’s a different EEPROM layout under the hood. On FortiGates with QSFP+ cages, get system interface transceiver still works, but not every model or firmware build exposes DDM data for QSFP the same way it does for SFP/SFP+.
Syntax
get system interface transceiver
Run without arguments, this walks every physical interface with an SFP or SFP+ cage and prints a two-part report: an identity block per interface, followed by a single summary table covering every populated port at once.
You can also scope it to one interface:
get system interface transceiver <port>
This changes the output format entirely. Instead of a shared summary table, you get a per-metric breakdown for that one port that includes the module’s own alarm and warning thresholds alongside the live reading, which is the most useful form of this command and the one worth memorizing.
A couple of practical notes before you go looking for it on every box. This command has historically not been supported on every FortiGate model (some older fixed-port desktop models never implemented it), and the exact wording of the “not detected” message has changed slightly across FortiOS versions. If the command returns nothing useful on a given unit, that’s worth confirming against the Fortinet hardware compatibility notes for that model rather than assuming the port itself is the problem.
Part one: the identity block
Run the command with no arguments and the first thing you get, per interface, is an identity block:
get system interface transceiver

Interface port9 - SFP/SFP+
Vendor Name  : FINISAR CORP.
Part No.     : FCLF-8521-3
Serial No.   : XXXXXXXXXX
Interface port10 - Transceiver is not detected.
Interface port11 - SFP/SFP+
Vendor Name  : FORTINET
Part No.     : FG-TRAN-SX
Serial No.   : XXXXXXXXXX
Three fields, and all three earn their keep:
Vendor Name and Part No. tell you exactly what’s seated in the cage, without pulling the module or trusting a label that might have been swapped during a rack move. This is the fastest way to confirm whether a “random outage” port is running Fortinet-branded optics, a certified third-party transceiver, or something a previous technician grabbed from a junk drawer. It’s also the first thing to check before opening a case with TAC, since Fortinet support will often ask for exactly this.
Serial No. matters more than it looks. If you’re chasing a transceiver that keeps failing intermittently, the serial number is how you prove it’s the *same physical module* reappearing, versus a batch of modules from the same bad manufacturing lot each failing once. Keep it in your ticket notes.
“Transceiver is not detected” simply means the cage is empty, or the module isn’t seated, or it isn’t communicating over the management I2C bus at all (which, for a module that used to work, is itself a data point: it suggests physical damage or a connector problem, not a link-layer issue).
Part two: the DDM summary table
After the identity blocks, the no-argument form prints one consolidated table covering the live optical readings for every populated port:
Optical    Optical    Optical
SFP/SFP+   Temperature   Voltage   Tx Bias   Tx Power   Rx Power
Interface  (Celsius)     (Volts)   (mA)      (dBm)      (dBm)
---------- -----------   -------   -------   --------   --------
port9      38.3          3.35      6.80      -2.3       -3.2
port11     42.1          3.34      7.21      -2.3       -40.0 --
++ : high alarm, + : high warning, - : low warning, -- : low alarm, ? : suspect.
Five columns, and one legend line that turns this from “a bunch of numbers” into an actual health check. That port11 row above isn’t hypothetical formatting, it’s the exact shape of what a dying receive path looks like: everything upstream is fine (temperature, voltage, bias current are all normal), but Rx Power has collapsed to -40.0 dBm and the module itself flagged it as a low alarm. That’s a fiber, connector, or far-end transmitter problem, diagnosed without leaving your terminal.
The flag legend, decoded
That one line at the bottom of the summary table is doing more work than it looks like. Every SFF-8472 compliant module ships from the factory with four thresholds per measurement: a high alarm, a high warning, a low warning, and a low alarm. FortiOS compares the live reading against all four and appends a flag when one is crossed:
| Flag | Meaning | What it tells you |
|---|---|---|
++ |
High alarm | The reading has crossed the module’s upper hard limit. Treat as an active fault. |
+ |
High warning | Trending high, inside a caution band below the alarm threshold. Worth watching, not yet critical. |
- |
Low warning | Trending low, inside a caution band above the alarm threshold. |
-- |
Low alarm | Crossed the lower hard limit. Treat as an active fault. |
? |
Suspect | FortiOS considers the reading itself unreliable, not just out of range. Usually a marginal or misbehaving DDM implementation rather than a real physical extreme. |
| (blank) | Nominal | Value sits between the warning bands. No action needed. |
No flag on a row doesn’t mean “everything about this link is fine,” it means “these five DDM values are inside their programmed bands.” A flapping link with clean DDM readings across the board points you away from the physical layer and toward duplex, MTU, spanning tree, or a config issue instead, which is genuinely useful information even when nothing here lights up.
Where the thresholds actually come from: run it against one port
The no-argument form is great for a fleet-wide scan, but it hides the thresholds themselves. Point the command at a single interface and FortiOS shows you the module’s actual programmed limits next to the live value:
get system interface transceiver port9

Interface port9 - SFP/SFP+
Vendor Name  : FINISAR CORP.
Part No.     : FCLF-8521-3
Serial No.   : XXXXXXXXXX

Measurement    Unit   Value High Alarm High Warn Low Warn Low Alarm
------------ ------- ------ ---------- --------- -------- ---------
Temperature  Celsius   38.3       90.0      85.0      0.0      -5.0
Voltage        Volts   3.35       3.60      3.46     3.13      3.00
Tx Bias           mA   6.80      10.50     10.50     2.50      2.50
Tx Power         dBm   -2.3        3.0      -1.0     -5.0      -9.0
Rx Power         dBm   -3.2        3.0      -1.0    -15.0     -15.0

++ : high alarm, + : high warning, - : low warning, -- : low alarm, ? : suspect.
This is the form worth building muscle memory for. These threshold numbers aren’t Fortinet’s, and they aren’t universal. They’re written into that specific module at manufacture, so a 10G SFP+ SR optic from one vendor and a 10G SFP+ LR optic from another can (and usually do) ship with different alarm bands, because their laser types, expected power budgets, and thermal tolerances differ. That’s exactly why FortiOS reads them from the module instead of hardcoding a single set of limits into FortiOS itself.
Reading each field like a practitioner
Temperature (Celsius)
This is the internal case temperature of the transceiver, not ambient room temperature. Sustained high temperature readings, or a +/++ flag here, usually point to one of three things: a cooling problem in the rack (blocked airflow, a failed fan tray, a closet running hot), a transceiver that’s simply not rated for the environment it’s in (a commercial-temp optic in an industrial cabinet), or a module nearing end of life, since internal component aging often shows up as elevated idle temperature before anything else does.
A single hot port among otherwise-normal neighbors points at that specific module or its immediate airflow path. A whole shelf trending warm points at the chassis or the room.
Voltage (Volts)
This is the module’s internal supply rail, nominally 3.3V on essentially every SFP/SFP+ optic in production today. Voltage is the most stable of the five readings under normal conditions, so any drift here is worth taking seriously even before it crosses a warning threshold. A voltage rail that’s sagging or noisy usually means a power delivery problem on the host side (a marginal SFP cage, backplane, or power supply) rather than anything wrong with the fiber plant, and it’s often the earliest indicator of a cage or slot that’s about to start causing you other, harder-to-diagnose problems.
Tx Bias (mA)
Bias current is the DC current driving the module’s laser diode to keep it lasing. This one is worth understanding on its own, because it’s the field that best predicts a future failure rather than just reporting a current one.
Laser diodes age. As a laser ages, its efficiency drops, which means the module’s internal control loop has to push more bias current through it to hold the same optical output power steady. A slowly climbing Tx Bias trend over weeks or months, even while it’s still inside the warning band, is one of the better early-warning signs available for predicting when an optic is approaching end of life. This is also the reason it’s worth pulling a baseline reading on critical circuits when they’re first deployed: without a “day one” number, a slightly-elevated bias reading six months later is much harder to interpret.
Tx Power (dBm)
How much light the module is actually putting out onto the fiber, expressed in dBm, a logarithmic scale where 0 dBm equals 1 milliwatt and every 3 dB roughly doubles or halves the power. Tx Power sitting outside its nominal range but still within spec for the fiber type usually isn’t an emergency by itself; it’s most useful as one half of a link budget calculation with the far end’s Rx Power.
A Tx Power reading that’s -- low-alarm flagged on its own, with everything else nominal, is a module telling you its own laser is failing to hit its rated output. That’s a transceiver replacement, not a fiber problem.
Rx Power (dBm)
What the module is actually receiving, and in a lot of real-world troubleshooting, this is the column that gets you to the answer fastest. Rx Power depends on the far-end transmitter’s Tx Power minus every source of loss between the two: connector loss at every mated pair, splice loss, macrobend loss from a fiber routed too tightly around a rack post, and attenuation across the fiber run itself.
A low or ---flagged Rx Power with a healthy Tx Power on the same port, and a healthy Tx Power reported by the far-end device, points squarely at the fiber path itself: a dirty or damaged connector (still the single most common cause in the field), a bad patch cable, a bend violation, or a splice that’s degraded. This is exactly the signature in the port11 example above, and it’s worth internalizing that shape, because it’s the single most common real-world pattern this command will show you.
Why you’ll see “N/A” across an entire row
Three different situations produce the same “N/A” output, and it’s worth being able to tell them apart before you escalate:
The transceiver doesn’t implement DDM at all. Plenty of legitimate, working optics, especially older or budget 1G SFPs, simply don’t have a diagnostic monitoring page. The base ID page (vendor, part number, serial number) still reads fine, and the link itself may be perfectly healthy. N/A here just means “this module can’t tell you how it’s doing,” not “something is wrong.”
It’s a Direct Attach Copper (DAC) cable. DACs are electrical, not optical. There’s no laser to bias and no light to measure, so the Tx/Rx power and bias fields have nothing to report even though many DACs do implement the base ID page and will show a vendor and part number. Active Optical Cables (AOCs) are the exception worth knowing: despite looking like a copper DAC from the outside, an AOC has real optics embedded in each connector housing, and most implement full DDM.
The transceiver isn’t communicating at all. If the identity block also shows “Transceiver is not detected,” you’re not looking at a DDM support gap, you’re looking at a module that isn’t answering on the management bus, which points toward a seating problem, a damaged connector, or a dead module rather than a feature limitation.
The practical rule: N/A next to a populated, working link is almost always case one or two and not worth chasing. N/A alongside “not detected” is a physical-layer problem worth your immediate attention.
Three scenarios, worked from the output
“Port keeps flapping, but only in the afternoon.” Pull the per-port DDM history if you’re logging it, or just catch it live during a flap. Climbing Temperature with everything else nominal, correlated with the building’s afternoon HVAC load, points at ambient cooling rather than the optic. Swapping the transceiver here usually doesn’t fix anything.
“New circuit, link comes up, but throughput is garbage and CRC errors are climbing.” Check Rx Power on both ends. A Tx Power that looks normal on your end paired with a Rx Power that’s deep in -- territory, especially on a freshly terminated fiber run, is almost always a bad termination, a connector that wasn’t fully seated, or a jumper that got kinked during the pull. This is a fiber inspection job, not a FortiGate config problem, and this command is what tells you to stop looking at the firewall.
“10G SFP+ that’s been in production for three years just started dropping intermittently.” Compare Tx Bias against a baseline if you have one, or just check it against the module’s own High Warning threshold from the single-port form. A bias current that’s crept up toward its warning band while Tx Power has correspondingly started to sag is the textbook signature of laser aging. Order the replacement before it fails hard during a maintenance window you didn’t plan for.
Related commands worth knowing
This command tells you what the optic itself is reporting. It won’t tell you about packet counters, driver-level errors, or negotiated link parameters, so pair it with:
diagnose hardware deviceinfo nic <port>
Shows host-side interface counters, including received and transmitted packet counts and host-level drop counters, useful for confirming whether a marginal optical signal is actually translating into real packet loss.
diagnose hardware deviceinfo nic-detail <port>
A deeper dump of the underlying NIC driver’s reported settings and statistics for that interface.
get system interface <port>
Confirms the logical interface configuration and administrative/operational status, useful as a sanity check that you’re not chasing an optical ghost on a port that’s administratively down.
The GUI equivalent lives under Network > Interfaces: the Transceiver column shows vendor name and part number directly in the table, and hovering over an entry surfaces the same diagnostic detail this command prints to the CLI, which is a fast way to eyeball a whole chassis without opening a terminal.
Quick reference
| Column | Unit | What a bad reading usually means |
|---|---|---|
| Temperature | Celsius | Cooling problem, hostile environment, or aging module |
| Voltage | Volts | Cage, backplane, or power delivery issue on the host side |
| Tx Bias | mA | Laser aging; rising trend predicts future failure |
| Tx Power | dBm | This module’s own laser output is weak or failing |
| Rx Power | dBm | Almost always the fiber path: dirty connector, bend, bad splice, or a weak far-end transmitter |
| N/A (all fields) | n/a | No DDM support (normal) or a DAC (normal), unless paired with “not detected” |
Run it, read the flags before the raw numbers, and let Rx Power do most of the talking when a link is unhappy. That’s the whole trick.
Recent posts
-

-

DNS is one of those technologies that quietly underpins... Full Story
-

BGP issues on FortiGate firewalls usually trace back to... Full Story
-

Every time your laptop talks to your router, a... Full Story
-

If you've spent any time configuring NAT on a... Full Story
-

If you have spent any time configuring firewall policies... Full Story
-

High availability on FortiGate is one of those features... Full Story
-

If you've configured SD-WAN on a FortiGate, you've almost... Full Story
-

FortiLink is the management protocol that turns a FortiSwitch... Full Story
-

FortiSwitches are pretty rock solid from Mean Time Between... Full Story
-

This is a quicky tip. Have you ever gone... Full Story
-

DNS is one of those quiet pieces of internet... Full Story
-

This article is an updated version of the previous... Full Story
-

You will add ns2 as a secondary (slave) BIND9... Full Story
-

In the process of deploying my lab, I needed... Full Story
-

RFC 8805, used to be known as Self-Correcting IP... Full Story
-

Years back, I wrote an article about certificate pinning. ... Full Story
-

FortiGates have the ability to send alerts to Microsoft... Full Story
-

In this post, I am going to walk through... Full Story
-

Troubleshooting VoIP on a FortiGate can feel like trying... Full Story
-

Prior to FortiOS 7.0, there were three commands to... Full Story
-

In this post, I am going to go over... Full Story
-

What we are going to do: We are going... Full Story
-

Choosing between FGCP (FortiGate Clustering Protocol) and FGSP (FortiGate... Full Story
-

Creating a VLAN on macOS (The "Pro" Move) A... Full Story
-

This blog post explores the logic behind how macOS... Full Story
-

Pretty Fly for a Wi-Fi Tell My Wi-Fi Love... Full Story
-

Part of my daily gig is creating BoMs (Bill-of-Materials)... Full Story
-

ICMP introduces several security risks, but careful filtering, rate... Full Story
-

The command diag debug application dhcps -1 enables full... Full Story
-

In the world of FortiOS, execute tac report is... Full Story
-

LLDP; What is it The Link Layer Discovery Protocol... Full Story
-

What it actually does When you run diagnose fdsm... Full Story
-

Monkey Bites are bite-sized, high-impact security insights designed for... Full Story
-

I have run macOS in macOS with Parallels but... Full Story
-

Don't be confused with my other FortiNAC posts where... Full Story
-

This is the third session in a multi-part article... Full Story
-

Today I was configuring key-based authentication on a FortiGate... Full Story
-

Netcat, often called the "Swiss Army knife" of networking,... Full Story
-

At its core, IEEE 802.1X is a network layer... Full Story
-

In case you did not see the previous FortiNAC... Full Story
-

This is our 5th session where we are going... Full Story
-

Now that we have Wireshark installed and somewhat configured,... Full Story
-

The Philosophy of Packet Analysis Troubleshooting isn't about looking... Full Story
-

Nmap Scripting Engine (NSE): From One-Liners to Your First... Full Story
-

Stand up TRex on Ubuntu, wire it through a... Full Story
-

1. Executive Summary Objective: Get a working, persistent nftables... Full Story