
If you've spent any time configuring user authentication on... Full Story
By Manny Fernandez
September 3, 2026
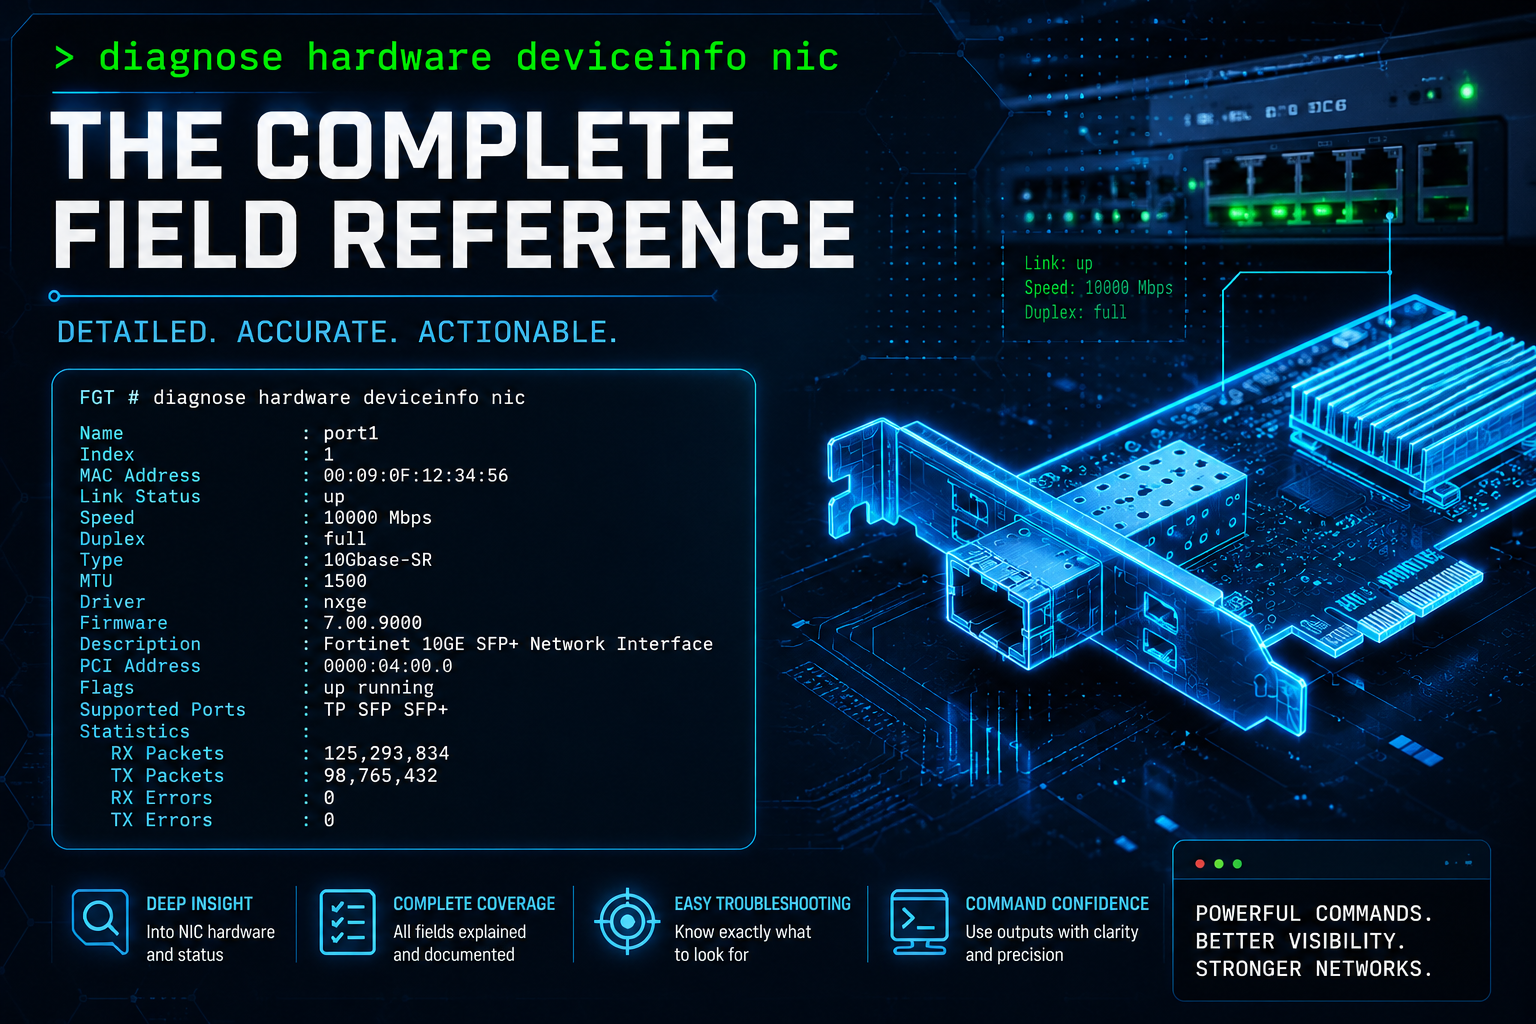
“diagnose hardware deviceinfo nic”: The Complete Field Reference
diagnose hardware deviceinfo nic: The Complete Field Reference
No fluff. Just the config that works.
Executive Summary
Objective: diagnose hardware deviceinfo nic is one of the most-run commands on a FortiGate and one of the least-understood. It dumps three separate layers of statistics into a single wall of text, the Linux kernel netdev, the NP6/NP7 switch ASIC, and the host CPU slow path, and it changes shape depending on ASIC generation and firmware version. This guide walks every field the command can print, explains which layer it belongs to, and shows how to turn the output into an actual diagnosis instead of a screenful of numbers.
Target audience: FortiGate engineers and SEs troubleshooting interface-level packet loss, throughput complaints, or physical-layer errors, and anyone who has run this command, gotten a wall of output, and moved on without reading past the first ten lines.
Prerequisites & Architecture
Assumed knowledge: comfort with the FortiGate CLI, and a basic understanding that hardware-accelerated FortiGates offload the bulk of session traffic to an NP6 or NP7 network processor so the CPU never touches most packets.
Environment requirements: any physical FortiGate. The exact fields depend on the ASIC:
- NP6 platforms (FortiGate 100E/200E-class and similar, 6.x/7.x firmware) print a flat
Description/Driver Name/link-settings/Countersblock. - NP7 platforms (400F/1800F-class and newer) print a segmented block: Host Counters, Netdev Counters, Switch Poll Counters, Switch Error Counters, and Queue Counters.
- Desktop and entry-level models without an NP ASIC (softswitch-only ports) return a much shorter, mostly-netdev-only block since there is no switch chip underneath.
Every sample in this guide is real Fortinet output, reproduced from Fortinet’s own documentation and support KB, with interface names and serials left as Fortinet published them (port1, port17, wan1).
The three layers, at a glance
| Layer | Where it lives | What it counts | Command that shows it |
|---|---|---|---|
| Host / CPU | Linux kernel netdev on the management CPU | Only packets punted up from the ASIC: session setup, ICMP, routing protocol hellos, management and local-in traffic | Host Counters / hrx_* / htx_* block |
| Switch / ASIC | NP6 or NP7 network processor | The real interface throughput, including everything hardware-offloaded after session establishment | Switch Poll Counters / Switch Error Counters block (NP7), plain Counters block (NP6) |
| Kernel netdev | Linux struct net_device on the interface |
Standard OS-level packet, byte, and error counters, independent of Fortinet’s ASIC driver | diagnose netlink interface list <port> |
Confusing the Host layer for total throughput is the single most common misread of this command. A saturated 10G WAN port can show a Host Counters block sitting at a few hundred packets. That is correct and expected. The real number is in Switch Poll Counters.
Command family
| Command | Purpose |
|---|---|
diagnose hardware deviceinfo nic <interface> |
The main per-interface hardware/driver dump covered in this guide |
diagnose netlink interface list <interface> |
The Linux kernel netdev view, including the re:/te: hardware error counters |
diagnose hardware deviceinfo nic-details <interface> |
Forward Error Correction (FEC) bit-error-rate detail; currently limited to the FortiGate 1801F and interfaces that support CL91 FEC |
diagnose netlink interface clear <interface> |
Zeroes the netlink counters so you can baseline a fresh measurement window |
Step-by-Step: Reading the Output
Step 1: Run the command
Goal: pull the raw dump for the interface in question.
Action:
diagnose hardware deviceinfo nic <interface-name>Replace <interface-name> with the physical port, for example port1, wan1, or port17. VLAN sub-interfaces, aggregates, and software-switch members are not valid targets; run the command against the underlying physical port.
Output shape: the rest of this guide walks the blocks in the order they print, first the older NP6-style flat layout, then the current NP7-style segmented layout, noting where the two diverge.
Step 2: Identity and driver block
Goal: confirm you’re looking at the interface you think you’re looking at, and capture the identifiers TAC will ask for.
NP6 sample:
diagnose hardware deviceinfo nic wan1
Description :FortiASIC NP6 Adapter
Driver Name :FortiASIC Unified NPU Driver
Name :np6_0
PCI Slot :0000:02:00.0
irq :16
Board :FGT800D
SN :FG800D3916800432
Major ID :20
Minor ID :0
lif id :16
lif oid :154
netdev oid :154
netdev flags :1003
netdev oid_vid :0
Current_HWaddr 90:6c:ac:5a:da:e2
Permanent_HWaddr 90:6c:ac:5a:da:e2
phy name :wan1
bank_id :1
phy_addr :0x03
lane :8
flags :0x400220
sw_port :0
sw_np_port :0
vid_phy[6] :[ 18, 0, 0, 0, 0, 0]
eid_phy[6] :[ 0, 0, 0, 0, 0, 0]
NP7 sample (post-8.0.0 field names):
diagnose hardware deviceinfo nic port17
Description :FortiASIC NP7 Adapter Driver
Name :FortiASIC Unified NPU Driver
pid :17
oid :145
vid :18
macid :16
eif_id :127
promiscous :1
local_port :0
vlan_wa_done :0
mtu :9216
netdev oid :145
dev-flags :1903
dev-promis :1
Current_HWaddr e0:23:ff:50:31:6a
Permanent_HWaddr e0:23:ff:50:31:6a
Field notes:
| Field | Meaning | Practitioner use |
|---|---|---|
Description / Driver Name |
Which ASIC and driver are behind this port | Confirms NP6 vs NP7 before you decide which block layout to expect |
Board / SN |
Chassis model and serial | Useful when copy-pasting output into a TAC case that spans multiple units |
Current_HWaddr vs Permanent_HWaddr |
Active MAC vs the burned-in factory MAC | A mismatch means a MAC override (set macaddr) or HA virtual MAC is in play, not a fault by itself |
sw_port / sw_np_port (NP6) or local_port (NP7) |
Which physical port maps to which NPU port group | Needed when cross-referencing diagnose npu np6/np7 output, which is grouped by NPU port, not by interface name |
mtu |
Configured MTU as seen by the driver | Confirms jumbo frame settings actually reached the ASIC, not just the interface config |
Step 3: Link settings block
Goal: compare what was configured against what the PHY actually negotiated.
NP7 output splits Default from Current, which is the most useful pivot in the whole command:
==== Default Link Settings =====
auto-nego :Disable
s_speed :1000
s_duplex :Full
==== Current Link Settings =====
auto-nego :Enable
s_status :Up
s_speed :1000
s_duplex :Full
FEC :OFF (0x2)
FEC_cap :None (0x0)
SerDes_if :SGMII
SerDes_if_cap :SGMII (0x4)
SerDes_dflt :2
pm_mode_setting :0
pm_mode :0x0
pm_mode_dflt :0
pm_port :No
medium_mode :0
NP6 equivalent (single block, no Default/Current split):
======== Link Settings ==========
link_autonego :1
link_setting :1
link_speed :1000
link_duplex :1
link_fec :None (0x0)
link_fec_cap :None (0x0)
link_serdes_if :None
serdes_if_cap : (0x0)
serdes_dflt :0
pm_mode_setting :0
pm_mode :0x0
pm_mode_dflt :0
pm_port :No
medium_mode :0
Field notes:
auto-nego/s_speed/s_duplexunder Default reflect what’s configured inconfig system interface. The same fields under Current reflect what actually negotiated on the wire. When a “speed didn’t take” ticket lands on your desk, this comparison is the first thing to check, before you touch a cable.FEC/FEC_cap: Forward Error Correction state and capability.OFFwith a capability ofNoneon copper 1G is normal; mismatched FEC settings between two ends of a 25G/40G/100G optical link is a classic cause of a link that comes up but throws CRC errors under load.SerDes_if/SerDes_if_cap: which SerDes protocol the lane is running (SGMII, XFI, etc.) and what it’s capable of. Relevant when a transceiver is inserted but the port refuses to link at the expected speed.pm_mode*/medium_mode: internal port-manager mode flags used mostly by TAC for chassis and breakout-cable diagnostics, not something you’ll typically act on directly.
Step 4: Link status block
Goal: get the current up/down state and catch flapping links.
NP7:
==== Link Status ===============
Admin :Up
link_status :Up
Speed :1000
Duplex :Full
==== Netdev Status =============
dev_running :Yes
dev_carrier :On
NP6:
========== Link Status ==========
Admin :up
netdev status :down
Speed :N/A
Duplex :N/A
link_status :Down
rx_link_status :0
int_phy_link :0
local_fault :0
local_warning :0
remote_fault :0
nr_reset :0
Field notes:
Adminis the administrative state (set status up/downin the interface config);link_statusis the physical link state. Admin up with link down means a cabling, transceiver, or far-end problem, not a config problem on this box.local_fault/remote_faultdistinguish which end of an optical link is reporting the problem. Aremote_faultclimbing whilelocal_faultstays at zero points you at the far-end device or the fiber itself, not this FortiGate.nr_reset: a counter of PHY resets. A nonzero and climbing value here is a strong signal of a flapping optic, a marginal DAC cable, or a failing SFP, well before “interface flapping” shows up in the event log.dev_running/dev_carrier(NP7) are the kernel-level running and carrier-detect states; they should trackAdmin/link_statusand rarely disagree with them, but a mismatch is worth a second look at the driver layer specifically.
Step 5: Host Counters (CPU / slow path)
Goal: see how much traffic is actually reaching the management CPU for this interface, and why.
NP7:
==== Host Counters =============
hrx_pkts :300
hrx_bytes :28000
htx_pkts :2100
htx_bytes :220000
htx_drop :0
htx_e_busy :0
htx_e_noheadroom:0
htx_e_oid :0
htx_e_adapter :0
htx_e_pad :0
htx_e_frag :0
htx_e_other :0
NP6 (folded into the flat Counters block):
Host Rx Pkts :0
Host Rx Bytes :0
Host Tx Pkts :0
Host Tx Bytes :0
Host Tx dropped :0
Field notes:
hrx_pkts/hrx_bytesandhtx_pkts/htx_bytes(orHost Rx/Tx Pkts/Byteson NP6) count only what the CPU handled directly: new-session SYNs before NPU offload kicks in, ICMP, routing protocol traffic, management-plane traffic (HTTPS/SSH to the FortiGate itself), and anything explicitly excluded from hardware offload. This is not total interface throughput. On a busy hardware-accelerated port these numbers stay small on purpose.htx_drop: added in FortiOS 7.6.4 for supported platforms. Tracks FCS, oversized, or jabber errors specifically on packets the host tried to transmit. A nonzero value here on the host path, separate from the switch-level drop counters in Step 7, points at a driver or MTU mismatch on packets the CPU itself is generating.htx_e_*fields break down why a host-originated transmit failed:htx_e_busy(queue or adapter busy),htx_e_noheadroom(not enough buffer headroom to prepend the driver’s header, usually an MTU/fragmentation interaction),htx_e_oid(bad internal object ID, driver-level),htx_e_adapter(adapter rejected the packet),htx_e_pad/htx_e_frag(padding or fragmentation failure),htx_e_other(catch-all). These are almost always a TAC-level signal rather than something to act on directly, but a nonzero, climbinghtx_e_noheadroomalongside a recent jumbo-frame change is worth connecting.
Step 6: Netdev Counters and rates
Goal: cross-check the kernel-level packet/byte counts and, on supported platforms, get a live rate instead of a cumulative total.
==== Netdev Counters ===========
Rx Pkts :260
Rx Bytes :33000
Tx Pkts :2000
Tx Bytes :225000
Rx pps :3
Rx bps :1600
Tx pps :3
Tx bps :1400
Field notes:
Rx/Tx PktsandRx/Tx Byteshere are the kernel netdev’s own counters, a second, independent count from thehrx/htxhost counters above. They should track closely withhrx/htxon a given interface; a large and growing gap between the two is itself a useful anomaly to flag.Rx pps/Rx bps/Tx pps/Tx bpswere added alongsidehtx_dropin FortiOS 7.6.4. As of that release, Fortinet has this limited to the FortiGate 1801F and interfaces that support CL91 FEC. On every other platform and port type, don’t expect to see these fields; their absence is expected behavior on non-qualifying hardware, not a broken driver.
Step 7: Switch Poll Counters and Switch Error Counters (the real throughput numbers)
Goal: this is where the actual, hardware-offloaded interface throughput and physical-layer error counts live.
NP7:
==== Switch Poll Counters ======
sw_tx_pkts :2000
sw_tx_bytes :225000
sw_tx_bc_pkts :0
sw_tx_mc_pkts :0
sw_rx_pkts :260
sw_rx_bytes :33000
sw_rx_bc_bytes :35
sw_rx_mc_bytes :180
==== Switch Error Counters =====
rx_err :0
rx_crc_err :0
rx_len_err :0
rx_carrier_err :0
rx_over_err :0
rx_under_err :0
rx_drop_pkts :0
tx_collision_err:0
tx_drop_pkts :0
NP6 (flat Counters block, includes both throughput and errors together):
============ Counters ===========
Rx_CRC_Errors :0
Rx_Frame_Too_Longs:0
rx_undersize :0
Rx Pkts :0
Rx Bytes :0
Tx Pkts :0
Tx Bytes :0
rx_rate :0
tx_rate :0
nr_ctr_reset :0
FragTxCreate :0
FragTxOk :0
FragTxDrop :0
Field notes:
sw_rx_pkts/sw_rx_bytesandsw_tx_pkts/sw_tx_bytesare the ASIC’s own poll of what actually moved through the switch fabric, hardware-offloaded flows included. This, not the Host Counters block, is the number to trust for “how much traffic is this interface actually carrying.”rx_crc_err/Rx_CRC_Errors: CRC failures at the physical layer. Climbing CRC errors almost always mean a bad cable, a bad connector, a marginal transceiver, or (very commonly) a speed/duplex mismatch with the device on the other end.rx_len_err/Rx_Frame_Too_Longs/rx_undersize: frames outside expected size bounds. Oversized frames with jumbo frames disabled somewhere in the path, or undersized/runt frames, both point at a framing problem on the wire or on the sending device, not on this FortiGate’s configuration.rx_over_err/rx_under_err: FIFO overrun/underrun at the ASIC. Sustained overruns under heavy load can indicate the port is legitimately oversubscribed for its buffer depth; occasional ones during a burst are usually not actionable on their own.tx_collision_err: collision counter. On any full-duplex link (which is effectively every link in 2026), this should be permanently zero. A nonzero value is a strong signal that somewhere in the path a device is still running, or has fallen back to, half-duplex.rx_drop_pkts/tx_drop_pkts: packets the switch ASIC dropped outright. Pair this with the Queue Counters in Step 8 to see whether the drop is link-wide or isolated to one priority queue.
Step 8: Queue Counters (NP7 only)
Goal: isolate whether a drop is happening across the whole link or inside a single hardware queue.
======Queue Counters ===========
uc_que0_pkts :0
uc_que1_pkts :0
uc_que2_pkts :0
uc_que3_pkts :0
uc_que4_pkts :0
uc_que5_pkts :0
uc_que6_pkts :0
uc_que7_pkts :0
--------------------------------
uc_drop_que0_pkts:0
uc_drop_que1_pkts:0
uc_drop_que2_pkts:0
uc_drop_que3_pkts:0
uc_drop_que4_pkts:0
uc_drop_que5_pkts:0
uc_drop_que6_pkts:0
uc_drop_que7_pkts:0
Field notes: eight unicast hardware queues per port, each with its own packet count and its own drop count. If rx_drop_pkts/tx_drop_pkts from Step 7 is climbing but only one uc_drop_queN_pkts is moving, the problem is a specific traffic-shaping or QoS priority class overflowing its queue depth, not a link-wide capacity problem. That’s a very different fix (adjust shaping/queue depth) from a link-wide drop (check cabling, negotiation, or genuine oversubscription).
Step 9: Transceiver Info
Goal: a quick optical-health snapshot without pulling the full DDM report.
==== Transceiver Info ==========
tx_disable : N/A
rx_los : N/A
tx_fault : N/A
present : N/A
last_spd : 0
Field notes: N/A across the board is normal and expected on copper ports; these fields only populate on SFP/SFP+ optical interfaces. present confirms the driver sees a transceiver seated at all; rx_los (receive loss-of-signal) and tx_fault are the two to watch for a suspect optic. For the full per-lane DDM breakdown (temperature, voltage, Tx bias, Tx/Rx power with alarm and warning thresholds), that lives in get system interface transceiver, which this command deliberately keeps brief.
Step 10: Cross-referencing diagnose netlink interface list
Goal: confirm the kernel’s own view of the interface matches the driver dump, and get the standard Linux hardware error counters in their raw, mnemonic form.
diagnose netlink interface list name wan1
if=wan1 family=00 type=1 index=4 mtu=1500 link=0 master=0
ref=329 state=off start fw_flags=10000000 flags=up broadcast run allmulti multicast
Qdisc=mq hw_addr=90:6c:ac:5b:bf:b9 broadcast_addr=ff:ff:ff:ff:ff:ff
outbandwidth=92000(kbps)
stat: rxp=8542076 txp=7928261 rxb=5853285911 txb=3381014267 rxe=0 txe=0 rxd=0 txd=0 mc=0 collision=0
re: rxl=0 rxo=0 rxc=0 rxf=0 rxfi=0 rxm=0
te: txa=0 txc=0 txfi=0 txh=0 txw=0
misc rxc=0 txc=0
Field notes:
stat:line:rxp/txp(packets),rxb/txb(bytes),rxe/txe(errors),rxd/txd(drops),mc(multicast),collision.re:(receive errors) andte:(transmit errors) are the standard Linux kernel net_device error counters, abbreviated. They map directly to the fieldsethtool -Swould show on any Linux box, see the table below.
| Abbreviation | Full name | Meaning |
|---|---|---|
rxl |
rx_length_errors |
Frame length outside the expected range |
rxo |
rx_over_errors |
Receiver ran out of buffer space (overrun) |
rxc |
rx_crc_errors |
CRC/checksum failure on receive |
rxf |
rx_frame_errors |
Framing error, usually a cabling or physical-layer issue |
rxfi |
rx_fifo_errors |
Kernel-side receive FIFO buffer full |
rxm |
rx_missed_errors |
Packet missed because the interrupt wasn’t handled in time |
txa |
tx_aborted_errors |
Transmission aborted |
txc |
tx_carrier_errors |
Carrier lost during transmission |
txfi |
tx_fifo_errors |
Kernel-side transmit FIFO buffer full |
txh |
tx_heartbeat_errors |
Transmitter heartbeat check failed |
txw |
tx_window_errors |
Collision window/late-collision error |
- On a FortiGate with traffic shaping configured on the interface, this command also prints a
priority=line per shaping class showingallocated-bandwidth,total_bytes, anddrop_bytes, which is the fastest way to confirm whether a shaper (not the physical link) is the thing actually dropping the traffic. diagnose netlink interface clear <interface>zeroes these counters. Run it, then reproduce the issue or wait a fixed interval, and re-poll; a cumulative-since-boot counter tells you an error happened at some point, not whether it’s an active, ongoing problem.
Step 11: FEC bit error rate with nic-details
Goal: on qualifying hardware, get the raw Forward Error Correction statistics behind the pass/fail FEC field from Step 3.
diagnose hardware deviceinfo nic-details port37
System time: Thu Jun 12 17:25:22 2025
fec_stats_acc                changes  last change
corr codewds    :0           0        never
uncorr codewds  :0           0        never
lane 0          :0           0        never
lane 1          :0           0        never
lane 2          :0           0        never
lane 3          :0           0        never
FEC BER: 0.000000
FEC symbol err rate: 0.000000
Field notes: corr codewds (correctable codewords) climbing steadily but uncorr codewds staying at zero is a link doing exactly what FEC is designed to do, quietly correcting line noise. A rising uncorr codewds count, or a FEC BER moving off zero, means FEC is no longer able to keep up and the link is one bad day away from throwing real errors. As Fortinet documents it, this command is currently scoped to the FortiGate 1801F and CL91-capable interfaces; it will not return meaningful output elsewhere.
Verification & Validation
What a healthy interface looks like: Admin and link_status both up, Current speed/duplex matching Default (or matching what you intentionally hard-set), nr_reset static, all rx_*_err/tx_*_err/re:/te: fields at or near zero, and sw_rx_pkts/sw_tx_pkts climbing in line with the traffic you expect on that port. Host Counters staying small on a busy hardware-accelerated port is expected, not a fault.
Quick-reference: symptom to counter
| You see | Likely means |
|---|---|
Current speed/duplex differs from Default |
Auto-negotiation mismatch with the far-end device; check the peer’s configured speed/duplex |
rx_crc_err / rxc climbing |
Bad cable, bad connector, marginal transceiver, or a duplex mismatch |
rx_len_err / Rx_Frame_Too_Longs / rx_undersize climbing |
Jumbo-frame mismatch somewhere in the path, or a framing problem on the wire |
tx_collision_err nonzero |
Something in the path has fallen back to half-duplex |
nr_reset climbing |
Flapping optic, marginal DAC, or failing SFP |
rx_drop_pkts/tx_drop_pkts climbing, one uc_drop_queN_pkts moving |
A specific QoS/shaping queue overflowing, not a link-wide problem |
rx_drop_pkts/tx_drop_pkts climbing, all queues moving |
Link-wide oversubscription, cabling, or negotiation problem |
Host Counters low on a saturated interface |
Normal; check Switch Poll Counters for real throughput instead |
FEC BER moving off zero, uncorr codewds climbing |
Optical link degrading; plan a transceiver or cable swap before it hard-fails |
Worked example: a “port3 users are seeing intermittent slowness” ticket. First pass, diagnose hardware deviceinfo nic port3 shows Current duplex reporting Half while Default (the configured setting) is Full. That alone, before touching a single cable or opening a case, explains intermittent slowness: a duplex mismatch causes exactly that symptom under load, not a hard failure. Cross-checking rx_crc_err and tx_collision_err both climbing in the Switch Error Counters block confirms it. The fix is on the far-end device’s negotiation settings, not on this FortiGate.
Troubleshooting & Gotchas
1. Reading Host Counters as total throughput. This is the most common misread of the entire command. Host Counters (hrx_*/htx_* or Host Rx/Tx Pkts/Bytes) only reflects CPU slow-path traffic: new sessions, ICMP, routing protocol hellos, and management traffic. A busy, fully hardware-offloaded interface will legitimately show a small, mostly-flat Host Counters block. For real throughput, use sw_rx_pkts/sw_tx_pkts in Switch Poll Counters (NP7) or the plain Rx/Tx Pkts/Rx/Tx Bytes in the flat Counters block (NP6).
2. Assuming the output shape is fixed across firmware and platforms. NP6 platforms print a flat block; NP7 platforms print the segmented Host/Netdev/Switch Poll/Switch Error/Queue layout used throughout this guide. The htx_drop, Rx pps/Rx bps/Tx pps/Tx bps fields only exist from FortiOS 7.6.4 onward, and as of that release Fortinet has them scoped to the 1801F on CL91-capable interfaces. A missing field is not automatically a broken driver; check the platform and firmware version before escalating.
3. Treating a cumulative counter as a live status. Every counter in this command is cumulative since the last boot or the last diagnose netlink interface clear. A nonzero rx_crc_err from a bad cable that was replaced six months ago will still show up today. Before chasing a number, run diagnose netlink interface clear <interface>, wait a known interval or reproduce the issue, and re-poll for a rate rather than a running total.
Recent posts
-

-

DNS is one of those technologies that quietly underpins... Full Story
-

BGP issues on FortiGate firewalls usually trace back to... Full Story
-

Every time your laptop talks to your router, a... Full Story
-

If you've spent any time configuring NAT on a... Full Story
-

If you have spent any time configuring firewall policies... Full Story
-

High availability on FortiGate is one of those features... Full Story
-

If you've configured SD-WAN on a FortiGate, you've almost... Full Story
-

FortiLink is the management protocol that turns a FortiSwitch... Full Story
-

FortiSwitches are pretty rock solid from Mean Time Between... Full Story
-

This is a quicky tip. Have you ever gone... Full Story
-

DNS is one of those quiet pieces of internet... Full Story
-

This article is an updated version of the previous... Full Story
-

You will add ns2 as a secondary (slave) BIND9... Full Story
-

In the process of deploying my lab, I needed... Full Story
-

RFC 8805, used to be known as Self-Correcting IP... Full Story
-

Years back, I wrote an article about certificate pinning. ... Full Story
-

FortiGates have the ability to send alerts to Microsoft... Full Story
-

In this post, I am going to walk through... Full Story
-

Troubleshooting VoIP on a FortiGate can feel like trying... Full Story
-

Prior to FortiOS 7.0, there were three commands to... Full Story
-

In this post, I am going to go over... Full Story
-

What we are going to do: We are going... Full Story
-

Choosing between FGCP (FortiGate Clustering Protocol) and FGSP (FortiGate... Full Story
-

Creating a VLAN on macOS (The "Pro" Move) A... Full Story
-

This blog post explores the logic behind how macOS... Full Story
-

Pretty Fly for a Wi-Fi Tell My Wi-Fi Love... Full Story
-

Part of my daily gig is creating BoMs (Bill-of-Materials)... Full Story
-

ICMP introduces several security risks, but careful filtering, rate... Full Story
-

The command diag debug application dhcps -1 enables full... Full Story
-

In the world of FortiOS, execute tac report is... Full Story
-

LLDP; What is it The Link Layer Discovery Protocol... Full Story
-

What it actually does When you run diagnose fdsm... Full Story
-

Monkey Bites are bite-sized, high-impact security insights designed for... Full Story
-

I have run macOS in macOS with Parallels but... Full Story
-

Don't be confused with my other FortiNAC posts where... Full Story
-

This is the third session in a multi-part article... Full Story
-

Today I was configuring key-based authentication on a FortiGate... Full Story
-

Netcat, often called the "Swiss Army knife" of networking,... Full Story
-

At its core, IEEE 802.1X is a network layer... Full Story
-

In case you did not see the previous FortiNAC... Full Story
-

This is our 5th session where we are going... Full Story
-

Now that we have Wireshark installed and somewhat configured,... Full Story
-

The Philosophy of Packet Analysis Troubleshooting isn't about looking... Full Story
-

Nmap Scripting Engine (NSE): From One-Liners to Your First... Full Story
-

Stand up TRex on Ubuntu, wire it through a... Full Story
-

1. Executive Summary Objective: Get a working, persistent nftables... Full Story