
If you've spent any time configuring user authentication on... Full Story
By Manny Fernandez
September 24, 2026
Understanding the output of “dia debug app ike” on a FortiGate Firewall
Executive Summary
Every FortiGate IPsec write-up tells you to run diagnose debug application ike -1 and move on. That works, but it hides the fact that the number is a bitmask with eight documented categories, and that you can dial each one in or out. Once you know what the bits are, you can capture exactly the negotiation you care about, keep DPD chatter off your screen, and hand a debug to TAC or a customer without leaking key material.
| Item | Detail |
|---|---|
| Objective | Explain every bit in the IKE debug level, what each one prints, and how to combine them into targeted debug levels |
| Target audience | Network and security engineers who troubleshoot FortiGate site-to-site and dial-up IPsec |
| Applies to | FortiOS 6.x through 7.6.x (filter syntax changes at 7.4.1, covered below) |
| Companion post | Troubleshooting IPSec VPN tunnels in FortiGate Firewalls 2026 Version (the full tunnel workflow) |
Prerequisites and Lab
You should already be comfortable with IKEv1 and IKEv2 Phase 1 and Phase 2, and with getting to the FortiGate CLI over SSH or the GUI console. Nothing here changes configuration. The only disruptive command is the gateway flush in Step 5, which briefly drops the tunnel so you can watch it renegotiate.
| Component | Value | Role |
|---|---|---|
| FGT-HQ | wan1 198.18.10.1 | Responder, where we run the debug |
| FGT-BR1 | wan1 198.19.20.1 | Initiator (remote branch) |
| HQ LAN | 10.0.10.0/24 | Phase 2 local selector on HQ |
| BR1 LAN | 10.0.20.0/24 | Phase 2 remote selector on HQ |
| Phase 1 / Phase 2 | HQ-BR1 / HQ-BR1-P2 | Route-based IKEv2 tunnel |
Tip: Run the debug on the responder whenever you can and trigger the negotiation from the far end. The responder is the side that has to accept or reject the peer’s proposal, so its debug tells you why a negotiation failed, not just that it did.
How the Bitmask Works
The level you pass is the sum of the categories you want. Each category owns one bit, so there is never any ambiguity: 13 can only mean 8 + 4 + 1. The value 255 is binary 11111111, which is all eight documented bits set at once.
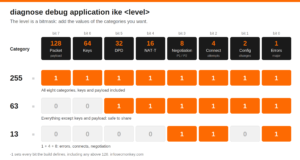
| Value | Hex | Binary | Category | What it prints |
|---|---|---|---|---|
| 1 | 0x01 | 00000001 | Errors | Major errors: probable PSK mismatch, no proposal chosen, parse failures |
| 2 | 0x02 | 00000010 | Config | Phase 1 and Phase 2 configuration changes and IKE cache rebuilds |
| 4 | 0x04 | 00000100 | Connect | Connection attempts: auto-negotiate, SA connect, new connection created |
| 8 | 0x08 | 00001000 | Negotiation | Phase 1 and Phase 2 message exchange, proposal dumps, selectors |
| 16 | 0x10 | 00010000 | NAT-T | NAT detection, port 4500 float, NAT-T keepalives |
| 32 | 0x20 | 00100000 | DPD | Dead peer detection probes, acks and DPD failures |
| 64 | 0x40 | 01000000 | Keys | Encryption and authentication keys for each negotiated SA |
| 128 | 0x80 | 10000000 | Payload | Raw IKE packet contents as hex dumps |
| 255 | 0xFF | 11111111 | All documented | Everything above |
| -1 | all bits | all ones | Everything | Every bit the build defines, including any above 128 |
255 versus -1. On a practical level they print the same thing for a normal tunnel. -1 is two’s complement for “every bit set”, so it also turns on any category a newer build adds above 128. Use -1 when you want everything and 255 when you want to be explicit about the eight documented categories.
You do not need a calculator to build a level. Any shell (including the terminal you SSH from) will do the math:
$ echo $((1 + 4 + 8))
13
$ echo $((255 - 64 - 128))
63
Reading the Line Prefix
Before looking at individual bits, it helps to know how every IKE debug line is labeled. The prefix tells you which VDOM, which tunnel, and which SA the line belongs to, which matters when two negotiations interleave.
ike 0:HQ-BR1:1022:HQ-BR1-P2:4711: added IPsec SA: SPIs=3f8a21c0/9be47d15
|   | |      |    |         |
|   | |      |    |         +-- Phase 2 negotiation serial
|   | |      |    +------------ Phase 2 (selector) name
|   | |      +----------------- IKE SA serial
|   | +------------------------ Phase 1 name
|   +-------------------------- VDOM index (0 = root)
+------------------------------ daemon (iked)
Lines that come from the IKE daemon itself, before a packet has been matched to a gateway, only carry ike 0:. That is normal and it is how you spot a packet the FortiGate could not tie to any Phase 1.
Bit by Bit
The sample lines below are representative of what each category prints on FortiOS 7.x. Exact wording shifts between releases, and some lines can be produced by more than one category, so treat these as a field guide rather than a byte-exact reference.
1: Major errors
The short list of things that are definitely wrong. If you only turn on one bit, this is the one, because it is quiet on a healthy box and loud on a broken tunnel.
ike 0:HQ-BR1:1022: probable pre-shared secret mismatch
ike 0:HQ-BR1:1022: no SA proposal chosen
ike 0:HQ-BR1:1022: negotiation failure
Use it for: a first look at any tunnel that will not come up, and as a base bit in almost every custom level.
2: Configuration changes
Prints when iked reloads its configuration because someone edited a Phase 1, a Phase 2, or a related object. On a stable box you will see nothing.
ike 0: cache rebuild start
ike 0: cache rebuild done
Use it for: proving that a tunnel reset lined up with a config push from FortiManager or a teammate, or confirming that your edit was actually picked up.
4: Connection attempts
Shows the FortiGate deciding to start a negotiation: auto-negotiate firing, traffic hitting a down tunnel, or a new connection object being created for a peer.
ike 0:HQ-BR1:HQ-BR1-P2: IPsec SA connect 6 198.18.10.1->198.19.20.1:0
ike 0:HQ-BR1: created connection: 0x7f3a2c 6 198.18.10.1->198.19.20.1:500.
Use it for: “the tunnel never even tries” problems, such as auto-negotiate disabled with no interesting traffic, or a route sending traffic somewhere other than the tunnel interface.
8: Phase 1 and Phase 2 negotiation
The heart of the debug. This is the exchange-by-exchange conversation: which messages arrived, which proposals each side offered, what was chosen, and which selectors were agreed.
ike 0: comes 198.19.20.1:500->198.18.10.1:500,ifindex=6,vrf=0....
ike 0: IKEv2 exchange=SA_INIT id=3a7c91e4f02b6d15/0000000000000000 len=512
ike 0:HQ-BR1:1022: incoming proposal:
ike 0:HQ-BR1:1022: proposal id = 1:
ike 0:HQ-BR1:1022:   protocol = IKEv2:
ike 0:HQ-BR1:1022:      encapsulation = IKEv2/none
ike 0:HQ-BR1:1022:         type=ENCR, val=AES_GCM_16 (key_len = 256)
ike 0:HQ-BR1:1022:         type=PRF, val=PRF_HMAC_SHA2_256
ike 0:HQ-BR1:1022:         type=DH_GROUP, val=ECP384.
ike 0:HQ-BR1:1022: matched proposal id 1
Use it for: proposal mismatches, DH group mismatches, selector (proxy ID) mismatches, and IKE_AUTH identity problems. Compare the incoming proposal block with your own Phase 1 or Phase 2 line by line.
16: NAT traversal
Covers NAT detection during the initial exchange, the float from UDP 500 to UDP 4500, and the periodic NAT-T keepalives that hold the NAT mapping open.
ike 0:HQ-BR1:1022: NAT detected: PEER
ike 0:HQ-BR1:1022: NAT-T float, index=0 port=4500
ike 0:HQ-BR1: sending NAT-T keep-alive
Use it for: a branch behind a carrier or hotel NAT, a tunnel that negotiates but passes no traffic because UDP 4500 is blocked upstream, or a mapping that times out between keepalives.
32: Dead peer detection
DPD probes (R-U-THERE in IKEv1, empty INFORMATIONAL exchanges in IKEv2), the acknowledgements, and the moment DPD declares the peer dead. On a hub with hundreds of dial-up peers this is the category that floods the console.
ike 0:HQ-BR1:1022: send IKEv1 DPD probe, seqno 97
ike 0:HQ-BR1:1022: notify msg received: R-U-THERE-ACK
ike 0:HQ-BR1:1022: dpd failed, connection timed out
Use it for: tunnels that flap every few minutes, or to prove the far end stopped answering before the tunnel dropped. Leave it off for everything else.
64: Encryption and authentication keys
Prints the actual key material for each negotiated SA. This is the only way to decrypt ESP in a packet capture with Wireshark, which is occasionally exactly what you need.
ike 0:HQ-BR1:1022:HQ-BR1-P2:4711: IPsec SA dec spi 3f8a21c0 key 32:<redacted>
ike 0:HQ-BR1:1022:HQ-BR1-P2:4711: IPsec SA enc spi 9be47d15 key 32:<redacted>
Warning: Anyone holding this output plus a capture of the tunnel can read the traffic until the SA rekeys. Never paste bit 64 output into a ticket, a chat, or a shared screen unless that is the point of the exercise, and flush the tunnel afterward so the exposed SAs are replaced.
128: Encrypted packet payload
Raw IKE messages as hex dumps, in and out. It is noisy and rarely needed, but it is what you want when the decoded lines disagree with what the peer says it sent, or when a vendor interop problem comes down to a malformed payload.
ike 0:HQ-BR1:1022: out 3A7C91E4F02B6D158E21BF6A9C034FD72E20230800000000...
ike 0:HQ-BR1:1022: in 3A7C91E4F02B6D158E21BF6A9C034FD72E20232000000000...
Use it for: interop disputes and TAC escalations where the parsed output is not enough. Because it can include material you would rather not share, treat it with the same care as bit 64.
Recipes: Levels by Symptom
Start narrow, widen only when the narrow level does not answer the question. Every recipe below includes bit 1 because errors are cheap and almost always relevant.
| Symptom | Level | Bits | Why |
|---|---|---|---|
| Tunnel down, no idea why | 13 | 1 + 4 + 8 | Shows whether it tries, what it negotiates, and the error |
| Proposal, DH or PSK mismatch | 9 | 1 + 8 | Proposal dumps plus the failure line, nothing else |
| Branch behind NAT | 25 | 1 + 8 + 16 | Negotiation plus NAT detection and port 4500 float |
| Tunnel flaps every few minutes | 37 | 1 + 4 + 32 | DPD failures and the reconnect attempts that follow |
| Who changed the tunnel? | 3 | 1 + 2 | Config reloads lined up with timestamps |
| Send to TAC or a customer | 63 | all but 64, 128 | Full negotiation story with no key material |
| Decrypt ESP in Wireshark | 64 | keys only | Pair with a sniffer capture, then flush the tunnel |
| Everything, lab only | -1 | all | When you truly do not know where to look |
Step-by-Step Capture Workflow
Step 1: Start from a clean slate
Goal: make sure no leftover filter or debug level from an earlier session skews what you see.
Action: disable output, reset all debug levels, and clear the IKE filter. The IKE filter survives closing your SSH session, so clear it every time.
diagnose debug disable
diagnose debug reset
diagnose vpn ike log filter clear
Pre-7.4.1: the filter command is hyphenated: diagnose vpn ike log-filter clear.
Step 2: Filter to one peer
Goal: scope the output to the tunnel you are troubleshooting.
Action: filter on the remote gateway address, or on the Phase 1 name if the peer address is dynamic.
diagnose vpn ike log filter rem-addr4 198.19.20.1
diagnose vpn ike log filter name HQ-BR1
diagnose vpn ike log filter list
Pre-7.4.1: diagnose vpn ike log-filter dst-addr4 198.19.20.1.
Step 3: Choose the level
Goal: turn on only the categories the symptom calls for.
Action: pick a level from the recipe table. For an unknown failure, 13 is a good start.
diagnose debug application ike 13Step 4: Make the console readable
Goal: timestamp every line and keep admin log messages from interleaving with the debug.
diagnose debug console timestamp enable
diagnose debug console no-user-log-msg enable
diagnose debug duration 60
Debug output stops on its own after 30 minutes by default. duration extends that window (in minutes) for an intermittent problem.
Step 5: Enable and trigger
Goal: capture a full negotiation from the first packet.
Action: enable output, then bring the tunnel up from the remote side (or flush it locally if you must initiate from this box).
diagnose debug enable
diagnose vpn ike gateway flush name HQ-BR1
GUI verification: in VPN > VPN Tunnels (called IPsec Tunnels on older builds), the tunnel status should move from down to up as the negotiation completes. On FortiOS 7.6.3 and later you can also right-click the tunnel and choose CLI diagnostics to run the same IKE debug from the GUI.
Step 6: Stop and reset
Goal: leave the box the way you found it.
diagnose debug disable
diagnose debug reset
diagnose vpn ike log filter clear
Verification and Validation
Confirm what is actually enabled before you trust an empty screen. diagnose debug info lists the output state, console options and every application debug level currently set.
diagnose debug infoYou are looking for debug output enabled, console timestamps enabled, and the IKE level you set (13, 63 and so on). If the IKE level is missing or zero, Step 3 did not stick.
A healthy capture at level 13 or higher ends with the Phase 2 SA being installed and the tunnel-up trap:
ike 0:HQ-BR1:1022:HQ-BR1-P2:4711: added IPsec SA: SPIs=3f8a21c0/9be47d15
ike 0:HQ-BR1:1022:HQ-BR1-P2:4711: sending SNMP tunnel UP trap
Then confirm from the tunnel side that the SA is really passing traffic:
get vpn ipsec tunnel name HQ-BR1
diagnose vpn tunnel list name HQ-BR1
Troubleshooting and Gotchas
Zero output after enabling the debug
Nine times out of ten this is a stale filter or a missing diagnose debug enable. The tenth is the 30-minute duration timer expiring during a long wait, or the tunnel simply not negotiating because nothing is triggering it.
diagnose vpn ike log filter list
diagnose debug info
Resolution: clear the filter, re-set the level, re-enable output, then flush the tunnel or send traffic from the far end. If a specific positive level still prints nothing on your build, retry with -1 to rule out a level problem before you blame the tunnel.
Keys ended up in a shared capture
Levels 255 and -1 include bits 64 and 128. A debug grabbed “with everything on” and pasted into a ticket exposes live key material.
Resolution: default to 63 for anything that will leave your hands. If keys were already shared, flush the tunnel so fresh SAs replace the exposed ones.
diagnose vpn ike gateway flush name HQ-BR1The filter command errors out
The filter moved from log-filter to log filter in FortiOS 7.4.1, and dst-addr4 became rem-addr4. Mixed fleets hit this constantly.
Resolution: check the running version with get system status and use the matching syntax. On 7.4.1 and later, run diagnose vpn ike log filter ? to see the options your build supports.
Quick Reference
| Command | Purpose |
|---|---|
diagnose debug application ike 13 |
Errors, connects and negotiation (good default) |
diagnose debug application ike 63 |
Everything except keys and payload (safe to share) |
diagnose debug application ike 255 |
All eight documented categories |
diagnose debug application ike -1 |
Every bit the build defines |
diagnose vpn ike log filter rem-addr4 <ip> |
Scope to one peer (7.4.1 and later) |
diagnose vpn ike log-filter dst-addr4 <ip> |
Scope to one peer (before 7.4.1) |
diagnose debug console timestamp enable |
Timestamp every line |
diagnose debug duration <minutes> |
Extend the 30-minute auto-stop |
diagnose debug info |
Show what is currently enabled |
diagnose debug disable / reset |
Stop output and zero all levels |
If this saved you from scrolling past a thousand R-U-THERE lines, it did its job.
Recent posts
-

-

DNS is one of those technologies that quietly underpins... Full Story
-

BGP issues on FortiGate firewalls usually trace back to... Full Story
-

Every time your laptop talks to your router, a... Full Story
-

If you've spent any time configuring NAT on a... Full Story
-

If you have spent any time configuring firewall policies... Full Story
-

High availability on FortiGate is one of those features... Full Story
-

If you've configured SD-WAN on a FortiGate, you've almost... Full Story
-

FortiLink is the management protocol that turns a FortiSwitch... Full Story
-

FortiSwitches are pretty rock solid from Mean Time Between... Full Story
-

This is a quicky tip. Have you ever gone... Full Story
-

DNS is one of those quiet pieces of internet... Full Story
-

This article is an updated version of the previous... Full Story
-

You will add ns2 as a secondary (slave) BIND9... Full Story
-

In the process of deploying my lab, I needed... Full Story
-

RFC 8805, used to be known as Self-Correcting IP... Full Story
-

Years back, I wrote an article about certificate pinning. ... Full Story
-

FortiGates have the ability to send alerts to Microsoft... Full Story
-

In this post, I am going to walk through... Full Story
-

Troubleshooting VoIP on a FortiGate can feel like trying... Full Story
-

Prior to FortiOS 7.0, there were three commands to... Full Story
-

In this post, I am going to go over... Full Story
-

What we are going to do: We are going... Full Story
-

Choosing between FGCP (FortiGate Clustering Protocol) and FGSP (FortiGate... Full Story
-

Creating a VLAN on macOS (The "Pro" Move) A... Full Story
-

This blog post explores the logic behind how macOS... Full Story
-

Pretty Fly for a Wi-Fi Tell My Wi-Fi Love... Full Story
-

Part of my daily gig is creating BoMs (Bill-of-Materials)... Full Story
-

ICMP introduces several security risks, but careful filtering, rate... Full Story
-

The command diag debug application dhcps -1 enables full... Full Story
-

In the world of FortiOS, execute tac report is... Full Story
-

LLDP; What is it The Link Layer Discovery Protocol... Full Story
-

What it actually does When you run diagnose fdsm... Full Story
-

Monkey Bites are bite-sized, high-impact security insights designed for... Full Story
-

I have run macOS in macOS with Parallels but... Full Story
-

Don't be confused with my other FortiNAC posts where... Full Story
-

This is the third session in a multi-part article... Full Story
-

Today I was configuring key-based authentication on a FortiGate... Full Story
-

Netcat, often called the "Swiss Army knife" of networking,... Full Story
-

At its core, IEEE 802.1X is a network layer... Full Story
-

In case you did not see the previous FortiNAC... Full Story
-

This is our 5th session where we are going... Full Story
-

Now that we have Wireshark installed and somewhat configured,... Full Story
-

The Philosophy of Packet Analysis Troubleshooting isn't about looking... Full Story
-

Nmap Scripting Engine (NSE): From One-Liners to Your First... Full Story
-

Stand up TRex on Ubuntu, wire it through a... Full Story
-

1. Executive Summary Objective: Get a working, persistent nftables... Full Story