
If you've spent any time configuring user authentication on... Full Story
By Manny Fernandez
September 2, 2026
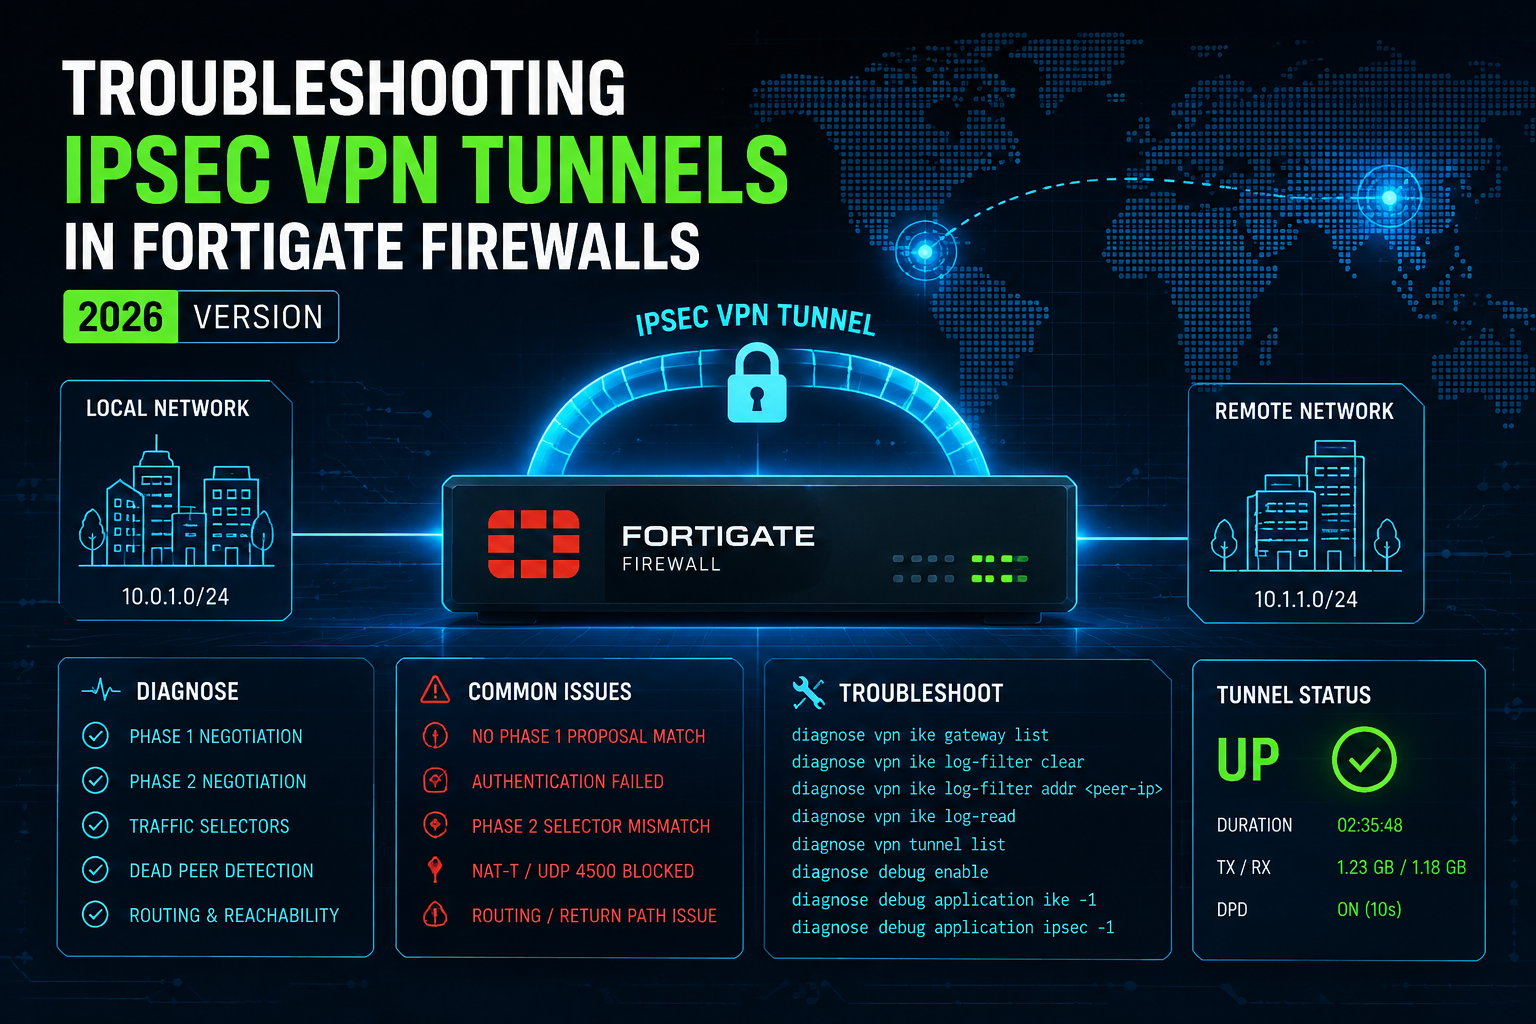
Troubleshooting IPSec VPN tunnels in FortiGate Firewalls 2026 Version
This is an updated, expanded version of an older Quick-Tip. Same goal as always: get a VPN tunnel talking again without wading through documentation you do not need. This version adds the full IKE debug bitmask, the FortiOS 7.4.1+ filter syntax, and a few options most engineers never touch.
FortiGate IPsec troubleshooting comes down to two commands: one to filter the noise, one to turn on the firehose. Get the filter wrong and you are staring at every VPN gateway on the box. Get the debug level wrong and you either miss the one line that mattered or drown in packet hex you did not need. Here is both, plus the parts most people skip.
Filtering the Output
With one or two tunnels, raw IKE debug is readable without a filter. On a hub with ten, twenty, or a hundred tunnels, it is not, and it is easy to forget a filter is still set from the last session. A stale filter is a classic reason for “why am I getting zero output from this gateway.”
Check what is currently set:
diagnose vpn ike log filter listVersion note: starting in FortiOS 7.4.1, Fortinet dropped the hyphen. The command changed from diagnose vpn ike log-filter to diagnose vpn ike log filter (three words, no dash). Plenty of boxes in the field are still on 7.2 and earlier, so both forms are worth knowing.
If a filter is set, the output looks something like this:
vd: any
name: any
ifindex: any
loc-addr4: any
mloc-addr4: any
rem-addr4: 198.19.12.5
mrem-addr4: any
loc-addr6: any
mloc-addr6: any
rem-addr6: any
mrem-addr6: any
dst-port: any
negate: disable
Clear it before starting a new capture, every time, even if you think you know what is set:
diagnose vpn ike log filter clearFilter options, FortiOS 7.4.1 and later
| Option | What it filters |
|---|---|
| list | Display the current filter |
| clear | Erase the current filter |
| vd | Index of the VDOM. -1 matches all |
| name | Phase 1 name to filter by |
| ifindex | Index of the interface the IKE connection negotiates over |
| loc-addr4 | IPv4 local gateway address range |
| mloc-addr4 | Multiple IPv4 local gateway addresses |
| rem-addr4 | IPv4 remote gateway address range (this is the one you will use most) |
| mrem-addr4 | Multiple IPv4 remote gateway addresses |
| loc-addr6 / mloc-addr6 | IPv6 local gateway address range, single or multiple |
| rem-addr6 / mrem-addr6 | IPv6 remote gateway address range, single or multiple |
| dst-port | Destination port range |
| negate | Inverts whatever filter parameter you just set |
Filter options, pre-7.4.1 (legacy syntax)
Older code uses source/destination naming instead of local/remote, and the command keeps its hyphen:
| Option | What it filters |
|---|---|
| name | Phase 1 name to filter by |
| src-addr4 / msrc-addr4 | IPv4 source address, single or multiple |
| dst-addr4 / mdst-addr4 | IPv4 destination address, single or multiple (the old rem-addr4) |
| src-addr6 / msrc-addr6 | IPv6 source address, single or multiple |
| dst-addr6 / mdst-addr6 | IPv6 destination address, single or multiple |
| src-port / dst-port | Source and destination port range |
| vd | Index of the VDOM. -1 matches all |
| interface | Interface the IKE connection negotiates over (now ifindex) |
| negate | Inverts the specified filter parameter |
Most engineers only ever touch rem-addr4 (or dst-addr4 on older code) to scope the debug to one peer. A few of the rest are worth knowing:
- negate flips whatever filter you just set. Instead of “only show me tunnel X,” you get “show me everything except tunnel X,” which is a faster way to spot a noisy neighbor tunnel that is drowning out the one you actually care about.
- ifindex (interface on legacy code) scopes the filter to one physical or logical interface. Handy on SD-WAN or dual-ISP designs where the same peer address negotiates over two different WAN links and you only want the chatter from one of them.
- mrem-addr4 / mloc-addr4 take multiple address ranges in a single filter, so a multi-site hub does not need four separate filter commands for four remote sites.
- vd -1 matches all VDOMs by default, but a debug session itself is still scoped to whatever VDOM you are logged into. On a multi-VDOM box, jump to
config globalfirst if you need to see traffic across VDOMs.
Finding Tunnel Names Before You Filter
Every command in this guide eventually wants an exact Phase 1 or Phase 2 name. On a box with two tunnels, guessing is fine. On a hub with fifty, you need a fast way to pull the list first.
The direct summary command
For a condensed table of every configured Phase 1 definition, remote gateway, and interface binding:
diagnose vpn ike config list summaryFast configuration greps
Straight from the running config, no diagnose engine involved:
get vpn ike gateway | grep nameor
show vpn ipsec phase1-interface | grep "edit"To see both Phase 1 and Phase 2 object names, run the phase1 grep above alongside:
show vpn ipsec phase2-interface | grep "edit"Active tunnel summary
For tunnels that currently have an active or negotiated SA rather than every tunnel in the config, get vpn ipsec tunnel summary (covered below) already does this, since a down tunnel reports its status as down instead of listing an SA. To pull just the names of the active IKE gateways:
get vpn ike gateway | grep -i "name:"Using the name switch
Once you have the exact name, for example To_Branch_Office, pass it straight into the diagnostic tools already covered in this guide:
- Check Phase 1 / IKE SA state:
diagnose vpn ike gateway list name <phase1_name> - Check Phase 2 IPsec SAs and traffic counters:
diagnose vpn tunnel list name <phase2_name> - Filter IKE debug output:
diagnose vpn ike log filter name <phase1_name>
Pre-7.4.1: that last one is diagnose vpn ike log-filter name <phase1_name>, same hyphen rule as everywhere else in this guide.
Listing IPsec VPN Tunnels: Phase 1
For a summary of every configured VPN and whether it is up:
get vpn ipsec tunnel summarySwap summary for details for the fuller version:
get vpn ipsec tunnel detailsTo see specifics on one gateway, including whether you are the initiator or responder and which proposal was negotiated:
diagnose vpn ike gateway list name VPN-MIA-ATLNot so known: drop the name argument entirely and diagnose vpn ike gateway list dumps every configured gateway on the box in one shot. Good first pass on a hub with dozens of spokes before you narrow down to one.
Not so known: diagnose vpn tunnel list is a lower level, kernel-facing dump of every Phase 2 SA (SPIs, proxy IDs, NPU offload flags) that sits underneath get vpn ipsec tunnel details. Reach for it when you suspect a stale or duplicate SA rather than a negotiation problem.
Bouncing VPN Tunnels
To tear down a tunnel and force it to renegotiate:
diagnose vpn ike gateway flush name VPN-MIA-ATLIf you just want to zero out the encrypt/decrypt counters without dropping the tunnel, so you can watch fresh traffic counts:
diagnose vpn tunnel stat flush VPN-MIA-ATLNot so known: you will also run across diagnose vpn ike gateway clear name VPN-MIA-ATL in the wild. Fortinet’s own troubleshooting documentation covers flush for this workflow, so that is the one to lean on. Treat clear as a related command rather than an interchangeable synonym until you have confirmed its exact behavior on your build.
Listing IPsec VPN Tunnels: Phase 2
For the Phase 2 detail on a specific tunnel:
get vpn ipsec tunnel name VPN-MIA-ATLSample output, values illustrative:
gateway
  name: 'VPN-MIA-ATL'
  type: route-based
  local-gateway: 198.18.4.10:0 (static)
  remote-gateway: 198.19.12.5:0 (static)
  mode: ike-v2
  interface: 'wan1' (6)
  rx packets: 412 bytes: 61804 errors: 0
  tx packets: 398 bytes: 58210 errors: 0
  dpd: on-demand/negotiated idle: 20000ms retry: 3 count: 0
  selectors
    name: 'VPN-MIA-ATL'
    auto-negotiate: disable
    mode: tunnel
    src: 0:10.10.0.0/255.255.0.0:0
    dst: 0:10.30.0.0/255.255.0.0:0
    SA
      lifetime/rekey: 3600/3512
      mtu: 1438
      replay: enabled
      qat: 0
      inbound
        spi: 3f8a21c0
        enc: aes 24:...
        auth: sha256 32:...
      outbound
        spi: 9be47d15
        enc: aes 24:...
        auth: sha256 32:...
      NPU acceleration: encryption(outbound) decryption(inbound)
Filtering and Debugging
Set the filter to the peer you care about:
diagnose vpn ike log filter rem-addr4 198.19.12.5Pre-7.4.1: diagnose vpn ike log-filter dst-addr4 198.19.12.5
Then turn on IKE debugging:
diagnose debug application ike -1-1 is not a magic number, it is a bitmask, and that is the part most write-ups skip. Each debug category is its own bit, and the level you pass is however many of those bits you add together. -1 sets every bit there is, including a couple that only matter on HA clusters.
The IKE debug bitmask
| Value | Category | Shows |
|---|---|---|
| 1 (0x01) | error | Major errors: PSK mismatches, no-proposal-chosen, parse failures |
| 2 (0x02) | config | Phase 1 and Phase 2 configuration changes |
| 4 (0x04) | negotiate | Connection attempts and SA negotiation start |
| 8 (0x08) | debug | Phase 1 and Phase 2 negotiation messages, proposal comparisons |
| 16 (0x10) | keepalive | NAT-T keepalive messages |
| 32 (0x20) | dpd | Dead peer detection messages |
| 64 (0x40) | keys | Encryption and authentication key material |
| 128 (0x80) | packet | Raw ISAKMP/IKE packet payload, hex dumped |
| 256 (0x100) | SLBC | Internal session load-balancing/clustering diagnostics, HA-related and rarely needed |
Add the bits you want together to build a custom level. For example, diagnose debug application ike 12 is 4 + 8, negotiate plus debug, which gets you the SA negotiation flow without the NAT-T keepalive spam that scrolls the useful part off your screen every 10-20 seconds.
-1 vs. 255: -1 is the documented shortcut for everything. 255 (0xFF) is the other value engineers reach for and covers every bit from error through packet, but not the 256/SLBC bit. In practice the two are indistinguishable unless you are chasing an HA-specific issue, in which case use -1.
Gotcha: some builds only respond to the negative form. A few engineers have reported entering a positive level like 255 or 1 on its own and getting zero output. If debug looks dead right after you enable it, retry with -1 before you start assuming the tunnel itself is idle.
Console options worth knowing
| Command | What it does |
|---|---|
| diagnose debug console timestamp enable | Timestamps every debug line, so you can line it up against a sniffer capture or the event log |
| diagnose debug duration <minutes> | Extends the default 30-minute auto-disable window for a longer capture |
| diagnose debug console no-user-log-msg enable | Stops admin login/logout console spam from interleaving with your IKE debug |
| diagnose debug reset | Zeroes every debug application level back to 0 before you start a new capture, good hygiene against stacking old filters |
Companion daemons
When the tunnel itself negotiates fine but authentication is the problem, IKE debug alone will not show it. Two related daemons are worth debugging in the same session:
diagnose debug application fnbamd -1for certificate-based authentication, XAuth, and EAPdiagnose debug application samld -1for SAML SSO, relevant on SSL VPN or dial-up IPsec tunnels using a SAML IdP
Then enable debugging:
diagnose debug enableSample output of a Phase 2 (Quick Mode) exchange coming up cleanly:
ike 0: comes 198.19.12.5:500->198.18.4.10:500,ifindex=6....
ike 0: IKEv1 exchange=Quick id=3a7c91e4f02b6d15:8e21bf6a9c034fd7 len=172
ike 0:VPN-MIA-ATL:5182:9931: responder received first quick-mode message
ike 0:VPN-MIA-ATL:5182:9931: peer proposal is: peer:0:10.30.0.0-10.30.255.255:0, me:0:10.10.0.0-10.10.255.255:0
ike 0:VPN-MIA-ATL:5182:VPN-MIA-ATL:9931: matched phase2
ike 0:VPN-MIA-ATL:5182:VPN-MIA-ATL:9931: my proposal:
ike 0:VPN-MIA-ATL:5182:VPN-MIA-ATL:9931:   proposal id = 1:
ike 0:VPN-MIA-ATL:5182:VPN-MIA-ATL:9931:      protocol id = IPSEC_ESP:
ike 0:VPN-MIA-ATL:5182:VPN-MIA-ATL:9931:      trans_id = ESP_AES
ike 0:VPN-MIA-ATL:5182:VPN-MIA-ATL:9931:      type = AUTH_ALG, val=SHA256
ike 0:VPN-MIA-ATL:5182:VPN-MIA-ATL:9931: incoming proposal:
ike 0:VPN-MIA-ATL:5182:VPN-MIA-ATL:9931:   proposal id = 1:
ike 0:VPN-MIA-ATL:5182:VPN-MIA-ATL:9931:      protocol id = IPSEC_ESP:
ike 0:VPN-MIA-ATL:5182:VPN-MIA-ATL:9931:      trans_id = ESP_AES
ike 0:VPN-MIA-ATL:5182:VPN-MIA-ATL:9931:      type = AUTH_ALG, val=SHA256
ike 0:VPN-MIA-ATL:5182:VPN-MIA-ATL:9931: negotiation result
ike 0:VPN-MIA-ATL:5182:VPN-MIA-ATL:9931: SA life soft seconds=3512.
ike 0:VPN-MIA-ATL:5182:VPN-MIA-ATL:9931: SA life hard seconds=3600.
ike 0:VPN-MIA-ATL:5182:VPN-MIA-ATL:9931: IPsec SA selectors #src=1 #dst=1
ike 0:VPN-MIA-ATL:5182:VPN-MIA-ATL:9931: src 0 7 0:10.10.0.0-10.10.255.255:0
ike 0:VPN-MIA-ATL:5182:VPN-MIA-ATL:9931: dst 0 7 0:10.30.0.0-10.30.255.255:0
ike 0:VPN-MIA-ATL:5182:VPN-MIA-ATL:9931: added IPsec SA: SPIs=3f8a21c0/9be47d15
ike 0:VPN-MIA-ATL:5182:VPN-MIA-ATL:9931: sending SNMP tunnel UP trap
my proposal is what your firewall offered for Phase 2. incoming proposal is what the remote gateway sent back. When a tunnel refuses to come up, this is the pair to compare line by line, since a mismatch anywhere here is a no-proposal-chosen error waiting to happen.
When you are done, always turn it off:
diagnose debug disable
diagnose debug reset
Quick Reference
| Command | Purpose |
|---|---|
| diagnose vpn ike config list summary | Condensed table of every configured Phase 1 gateway |
| get vpn ike gateway | grep name | Fast grep for configured gateway names |
| show vpn ipsec phase1-interface | grep “edit” | Fast grep for Phase 1 object names |
| show vpn ipsec phase2-interface | grep “edit” | Fast grep for Phase 2 object names |
| get vpn ike gateway | grep -i “name:” | Names of active/negotiated IKE gateways only |
| diagnose vpn ike log filter clear | Reset the filter before a new capture |
| diagnose vpn ike log filter rem-addr4 <ip> | Scope debug to one peer (7.4.1+) |
| diagnose vpn ike log filter name <name> | Scope debug to one Phase 1 name instead of an IP |
| get vpn ipsec tunnel summary | Quick up/down view of every tunnel |
| diagnose vpn ike gateway list name <name> | Phase 1 detail for one gateway |
| diagnose vpn tunnel list / list name <name> | Low-level Phase 2 SA table (SPIs, NPU flags), all tunnels or one by name |
| diagnose vpn ike gateway flush name <name> | Tear down and force renegotiation |
| diagnose vpn tunnel stat flush <name> | Reset traffic counters without dropping the tunnel |
| get vpn ipsec tunnel name <name> | Phase 2 detail, selectors, and SA state |
| diagnose debug application ike -1 | Full-verbosity IKE debug (all bitmask levels) |
| diagnose debug application ike 12 | Negotiate + debug only, no keepalive spam |
| diagnose debug application fnbamd -1 | Certificate auth, XAuth, EAP |
| diagnose debug application samld -1 | SAML SSO for SSL VPN or dial-up IPsec |
| diagnose debug console timestamp enable | Timestamp every debug line |
| diagnose debug enable / disable / reset | Start, stop, and clear a debug session |
Hope this saves you the afternoon it once cost me.
Recent posts
-

-

DNS is one of those technologies that quietly underpins... Full Story
-

BGP issues on FortiGate firewalls usually trace back to... Full Story
-

Every time your laptop talks to your router, a... Full Story
-

If you've spent any time configuring NAT on a... Full Story
-

If you have spent any time configuring firewall policies... Full Story
-

High availability on FortiGate is one of those features... Full Story
-

If you've configured SD-WAN on a FortiGate, you've almost... Full Story
-

FortiLink is the management protocol that turns a FortiSwitch... Full Story
-

FortiSwitches are pretty rock solid from Mean Time Between... Full Story
-

This is a quicky tip. Have you ever gone... Full Story
-

DNS is one of those quiet pieces of internet... Full Story
-

This article is an updated version of the previous... Full Story
-

You will add ns2 as a secondary (slave) BIND9... Full Story
-

In the process of deploying my lab, I needed... Full Story
-

RFC 8805, used to be known as Self-Correcting IP... Full Story
-

Years back, I wrote an article about certificate pinning. ... Full Story
-

FortiGates have the ability to send alerts to Microsoft... Full Story
-

In this post, I am going to walk through... Full Story
-

Troubleshooting VoIP on a FortiGate can feel like trying... Full Story
-

Prior to FortiOS 7.0, there were three commands to... Full Story
-

In this post, I am going to go over... Full Story
-

What we are going to do: We are going... Full Story
-

Choosing between FGCP (FortiGate Clustering Protocol) and FGSP (FortiGate... Full Story
-

Creating a VLAN on macOS (The "Pro" Move) A... Full Story
-

This blog post explores the logic behind how macOS... Full Story
-

Pretty Fly for a Wi-Fi Tell My Wi-Fi Love... Full Story
-

Part of my daily gig is creating BoMs (Bill-of-Materials)... Full Story
-

ICMP introduces several security risks, but careful filtering, rate... Full Story
-

The command diag debug application dhcps -1 enables full... Full Story
-

In the world of FortiOS, execute tac report is... Full Story
-

LLDP; What is it The Link Layer Discovery Protocol... Full Story
-

What it actually does When you run diagnose fdsm... Full Story
-

Monkey Bites are bite-sized, high-impact security insights designed for... Full Story
-

I have run macOS in macOS with Parallels but... Full Story
-

Don't be confused with my other FortiNAC posts where... Full Story
-

This is the third session in a multi-part article... Full Story
-

Today I was configuring key-based authentication on a FortiGate... Full Story
-

Netcat, often called the "Swiss Army knife" of networking,... Full Story
-

At its core, IEEE 802.1X is a network layer... Full Story
-

In case you did not see the previous FortiNAC... Full Story
-

This is our 5th session where we are going... Full Story
-

Now that we have Wireshark installed and somewhat configured,... Full Story
-

The Philosophy of Packet Analysis Troubleshooting isn't about looking... Full Story
-

Nmap Scripting Engine (NSE): From One-Liners to Your First... Full Story
-

Stand up TRex on Ubuntu, wire it through a... Full Story
-

1. Executive Summary Objective: Get a working, persistent nftables... Full Story