
If you've spent any time configuring user authentication on... Full Story
By Manny Fernandez
September 2, 2026
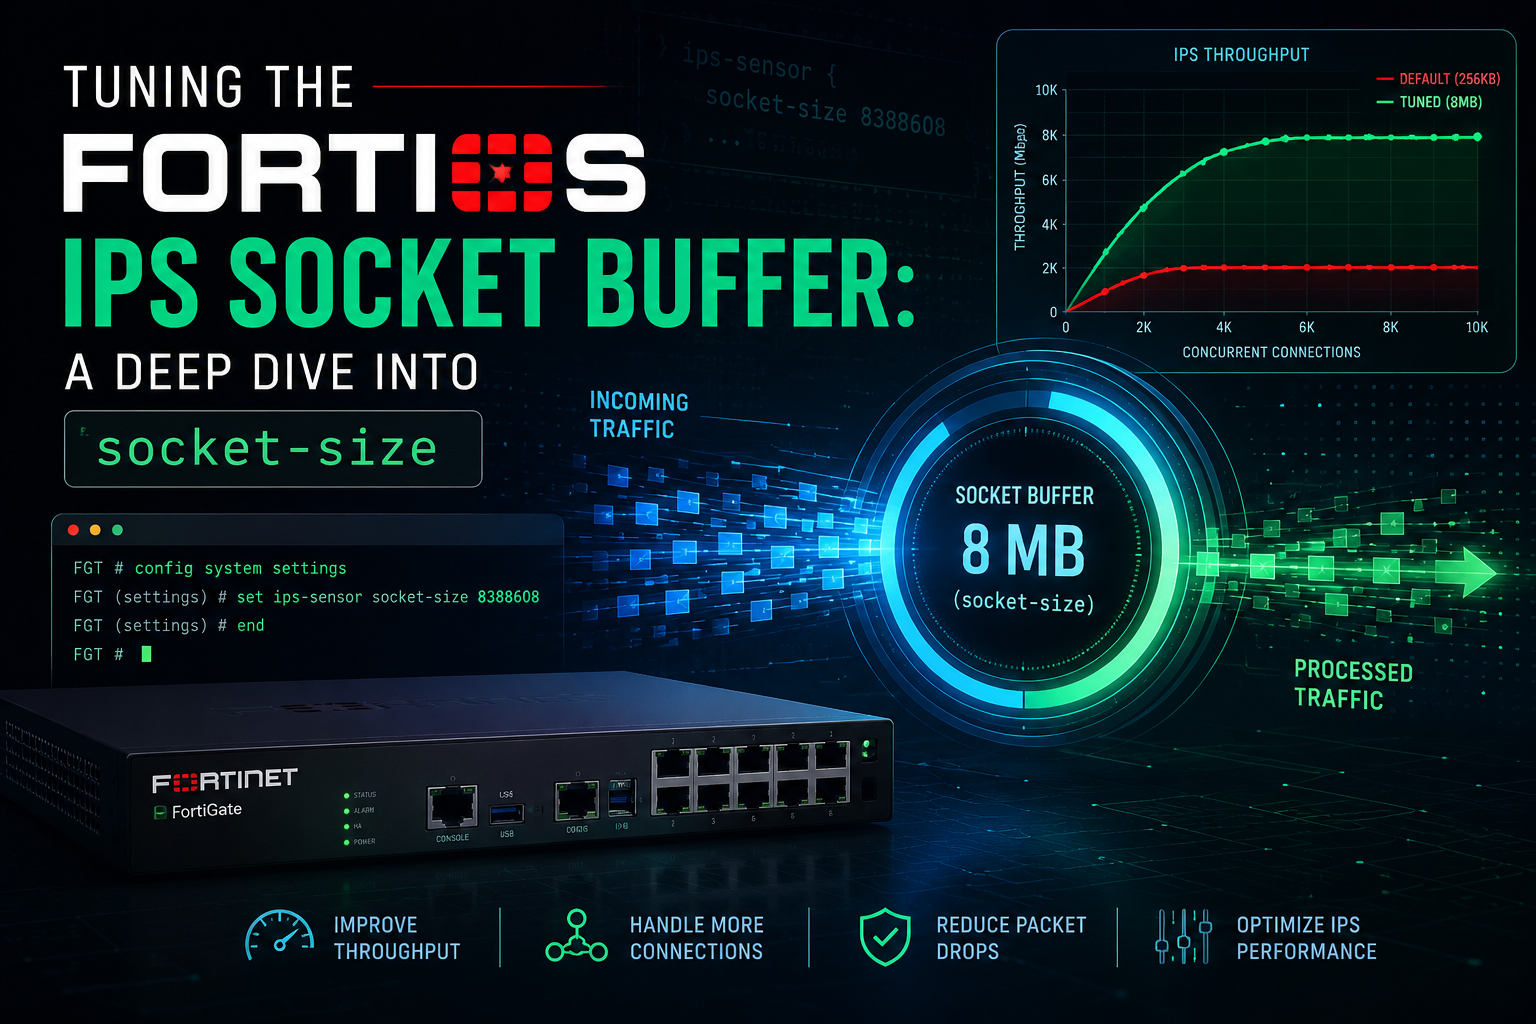
Tuning the FortiOS IPS Socket Buffer: A Deep Dive into socket-size
Executive Summary
Objective: Explain, in real operational depth, what the FortiOS ips global socket-size setting actually does, why it exists, when to touch it, and how to verify a change actually took effect.
Target audience: FortiGate administrators, NOC/SOC engineers, and SEs who need to answer the question “why is my IPS engine dropping into fail-open?” or “why does my FortiGate keep entering conserve mode after I touched IPS settings?” with something more useful than “just raise the buffer.”
The short version: socket-size controls how much data the kernel is allowed to hand off to the IPS engine at a time, in megabytes. It is the buffer that sits between raw packet capture and the actual inspection engine. Too small, and the engine starves under load and the box can enter fail-open. Too large, and you are handing memory to a daemon that may push the system into conserve mode. There is no universal “correct” value: the default and the maximum are both model- and memory-dependent, so the right number is the one you arrive at by watching your own platform’s counters, not a number copied from a forum post.
How FortiOS IPS Actually Processes Traffic
Before touching socket-size, it helps to know where it sits in the pipeline.
- Kernel packet capture. Traffic matched to a firewall policy with a security profile requiring IPS inspection is intercepted at the kernel level.
- Raw socket hand-off. The kernel copies that data into a raw socket buffer. This buffer is exactly what
socket-sizesizes. - IPS engine sampling. One or more
ipsengineprocesses (their count controlled byengine-count) pull data out of that buffer to run signature and protocol decoder matching against it. - Verdict. The engine returns a verdict (PASS, DROP, RESET, RESET_CLIENT, RESET_SERVER, DROP_SESSION, PASS_SESSION, CLEAR_SESSION, EXEMPT) which is applied to the session.
On platforms with NP-series network processors, some flow-based sessions can be offloaded around this software path entirely through NTurbo (controlled by np-accel-mode), and pattern matching itself can be offloaded to CP-series content processors through IPSA (cp-accel-mode). Those offloaded sessions do not behave the same way under pressure as sessions running the full software path, which matters later when we talk about fail-open.
The important architectural point: socket-size is not a “how much RAM does IPS get” setting in the abstract. It is specifically the size of the buffer the kernel uses to queue data for the IPS engine to consume. If that buffer fills faster than the engine can drain it (CPU-bound engine, too few engine instances, unusually bursty or high-volume traffic, deep TCP stream reassembly holding data longer), the kernel has nowhere left to put new data.
What socket-size Actually Controls
Per Fortinet’s own documentation, socket-size determines how much data the kernel passes to the IPS engine each time the engine samples packets. It is expressed as an integer in megabytes. In practice this buffer gives the engine breathing room to:
- absorb bursts of traffic without immediately backing up
- hold enough of a TCP stream in memory to reassemble it before running signatures against the reassembled data, rather than only ever seeing individual packets in isolation
- avoid becoming CPU-starved-looking when the real bottleneck is that data is arriving faster than it can be handed off
A larger buffer generally means more tolerance for bursty or high-throughput traffic before the engine falls behind. It does not mean “more thorough inspection.” Fortinet’s own field guidance is blunt about the trade-off: raising socket-size too high increases the IPS engine’s memory footprint, which can push the system into conserve mode more often on memory-constrained platforms. Setting it too low increases the odds the engine starves and the system enters fail-open. There is a middle you have to find for your own hardware and traffic profile, and it is rarely the factory default on a box that is running hot.
Syntax and Value Ranges
config ips global
    set socket-size <integer>
end
To check what your platform is currently running and its allowed range:
get ips global
This is the single most important thing to internalize about this setting: the default and the maximum both vary by model and by how much memory is available. Do not trust a number you read in a blog post, including this one, as universal truth for your platform. Some real examples pulled from across FortiOS releases and hardware classes, to illustrate the spread:
| Source | Default | Maximum |
|---|---|---|
| FortiGate 90D desktop-class unit, field example | 32 MB | Model-dependent |
| FortiOS 6.4.5 official CLI reference | 128 MB | 256 MB |
| FortiOS 6.4.7 official CLI reference | 32 MB | 128 MB |
| Fortinet KB, IPS memory optimization tech tip | 256 MB | 512 MB |
These are illustrative examples pulled from different platforms and FortiOS releases, not a lookup table for your box. The spread alone should tell you why
get ips global matters more than any published number.Always confirm your own platform’s ceiling and current value with get ips global before you set anything. On lower-memory desktop and branch models the maximum will be noticeably smaller than on a chassis-class unit with tens of gigabytes of RAM to spare.
Fail-Open: What Happens When the Buffer Runs Out
A fail-open condition is triggered specifically when the IPS raw socket buffer is full. At that point the IPS engine has no room left to create new sessions in its buffer, and FortiOS has to decide what happens to the traffic that can’t be admitted:
config ips global
    set fail-open {enable | disable}
end
disable(factory default): sessions are dropped by the IPS engine when the system enters fail-open mode. Traffic is blocked rather than let through uninspected.enable: the IPS engine fails open, and traffic continues to flow without IPS scanning. This affects every protocol inspected by the FortiOS IPS decoders, including HTTP, HTTPS, FTP, SMTP, POP3, and IMAP.
Two things practitioners routinely get wrong here:
- Fail-open is a symptom, not a fix. Flipping
fail-opentoenablebecause the box keeps blocking traffic under load treats the pressure valve as the solution. It just changes what happens when the buffer overflows: from “drop the session” to “let it through uninspected.” Either way, the root cause, an undersized buffer or an underpowered engine relative to your traffic, is still there. - NTurbo-offloaded sessions do not respect
fail-openat all. Sessions offloaded to NTurbo bypass the software IPS socket path. When the NTurbo data path itself is overloaded, that traffic is dropped regardless of howfail-openis configured. If you’re chasing drops on a platform with NTurbo enabled, check NTurbo statistics separately, raisingsocket-sizewill not touch that path.
The Supporting Cast: Other ips global Knobs That Interact With socket-size
socket-size doesn’t operate in isolation. These are the parameters most likely to matter alongside it:
| Parameter | What it controls |
|---|---|
engine-count |
Number of concurrent IPS engine processes. Default 0 lets FortiOS auto-size based on CPU core count. Lowering it concentrates load on fewer cores; it doesn’t remove the CPU cost, it redistributes it. |
session-limit-mode |
How the engine counts concurrent sessions for session-limit anomalies: accurate (precise, heavier) or heuristic (estimated, default, lighter). |
np-accel-mode |
Enables or disables NTurbo offload of flow-based sessions to NP-series network processors. Only present on platforms that support NTurbo. |
cp-accel-mode |
Enables or disables IPSA offload of pattern matching to CP-series content processors. Only present on platforms that support IPSA. |
ips-reserve-cpu |
Enable or disable letting the IPS daemon use CPUs beyond CPU 0. |
av-mem-limit |
Memory ceiling for the antivirus engine component used during IPS/UTM scanning. |
packet-log-queue-depth |
Depth of the queue used for IPS packet logging. A separate buffer from the raw socket socket-size governs. |
ngfw-max-scan-range |
In NGFW policy mode, how far into a flow the engine scans before it stops. A detection-completeness setting, not a buffering setting. |
Step-by-Step Tuning Workflow
Step 1: Baseline the current configuration
Goal: know what you’re starting from before you change anything.
get ips global
Note the current socket-size, engine-count, fail-open, and session-limit-mode values, and the maximum socket-size your platform will accept.
Step 2: Identify the symptom actually driving the change
Goal: don’t tune blind. Pull the evidence first.
- Check the event log for fail-open entries.
- Run
diagnose ips packet statusand look at the PACKET ACTION STATISTICS block for DROP, RESET, and DROP_SESSION counts trending up. - Run
diagnose sys topto see whetheripsengineis CPU-bound (a different problem from a buffer that’s too small) versus whether the box shows memory pressure and conserve-mode log entries (a sign the buffer may already be too large for the platform).
These two failure modes point in opposite tuning directions, so don’t skip this step.
Step 3: Choose a new value
- If the symptom is fail-open events with CPU and memory otherwise healthy, raise
socket-sizein a modest increment rather than jumping straight to the platform maximum. - If the symptom is conserve mode or generally high memory pressure and
socket-sizeis already set well above default, consider lowering it instead, and look at whetherengine-countorsession-limit-modeare better levers for the actual bottleneck.
config ips global
    set socket-size 128
end
(Replace 128 with the value appropriate to your platform and findings from Step 2, not this number.)
Step 4: Restart the IPS engine
Config changes to ips global should be followed by an IPS engine restart so the running daemon actually picks them up:
diagnose test application ipsmonitor 99
This stops and restarts all IPS engine instances and begins monitoring them again. Expect a brief IPS inspection gap while it restarts, plan the change for a maintenance window on production boxes.
Step 5: Confirm the change is live
get ips global
diagnose test application ipsmonitor 1
Option 1 displays current IPS engine information, confirming the engines actually restarted with the new value rather than just the configuration database reflecting it.
Verification and Validation
After a change, give it a real traffic cycle before declaring victory. Useful commands:
get ips global
Confirms the configured value.
diagnose test application ipsmonitor 1
Displays IPS engine information, process-level confirmation the new value is live.
diagnose test application ipsmonitor 12
IPS L7 socket statistics, useful for watching buffer behavior directly.
diagnose test application ipsmonitor 14
NTurbo statistics, check this separately if NTurbo is in play on your platform.
diagnose ips packet status
Packet and packet-action counters (PASS, DROP, RESET, RESET_CLIENT, RESET_SERVER, DROP_SESSION, PASS_SESSION, CLEAR_SESSION, EXEMPT). Watch DROP and DROP_SESSION trend down after a well-targeted change.
Expected success signature: fail-open event log entries stop recurring (or never start, if you tuned proactively), DROP/DROP_SESSION counters stabilize, and diagnose sys top shows ipsengine no longer pegged with memory headroom intact elsewhere on the box.
Troubleshooting and Gotchas
1. Changed the value, nothing changed.
The most common miss: the CLI change was committed but the running ipsengine process was never restarted to pick it up. Run diagnose test application ipsmonitor 99 after any ips global change and re-verify with option 1.
2. Fail-open events stopped, but now the box enters conserve mode more often.
You traded one symptom for another. A socket-size that’s comfortable for the traffic volume can still be too large for the platform’s available memory. Pull it back and look at engine-count or session-limit-mode as a lower-memory-cost alternative before pushing the buffer size any higher.
3. Raised socket-size significantly, drops on a specific NTurbo-offloaded flow class didn’t improve.
That traffic likely never touched the software IPS socket path at all. Check diagnose test application ipsmonitor 14 for NTurbo statistics and confirm np-accel-mode. NTurbo-offloaded sessions bypass fail-open entirely and are dropped on their own overload conditions, independent of socket-size.
4. Chasing socket-size for what is actually a session-count problem.
If the underlying issue is the number of concurrent sessions IPS is tracking rather than the volume of data in flight, session-limit-mode (accurate versus heuristic) and engine-count are the more relevant knobs. socket-size sizes the per-sample data buffer, not the session table.
5. Confusing socket-size with ngfw-max-scan-range.
These solve different problems and it’s an easy mix-up. socket-size is about buffering throughput between the kernel and the IPS engine. ngfw-max-scan-range (used in NGFW policy mode) limits how far into a given flow the engine scans before it stops looking, a detection-completeness setting, not a buffering setting. Don’t reach for one when the symptom points at the other.
Quick Reference
| Symptom | Likely lever | First move |
|---|---|---|
| Fail-open events, CPU and memory otherwise healthy | socket-size too small |
Raise socket-size in modest increments, restart the engine, re-verify |
Conserve mode after raising socket-size |
socket-size too large for platform memory |
Pull it back; consider engine-count or session-limit-mode instead |
ipsengine pegged at high CPU, buffer not full |
engine-count or cp-accel-mode |
Review engine count and content-processor offload before touching the buffer |
| Drops on NTurbo-offloaded flows despite a larger buffer | socket-size doesn’t apply to this path |
Check NTurbo stats (option 14) and np-accel-mode |
| Detection stopping partway into long flows | ngfw-max-scan-range, not socket-size |
Review NGFW scan range settings instead |
Closing
socket-size is a small, easily overlooked line in config ips global, but it sits directly on the path between “traffic gets inspected” and “traffic gets dropped or waved through uninspected.” Treat it the way you’d treat any buffer tuning exercise: baseline first, change one thing at a time, restart the process that actually needs to pick up the change, and verify against real counters rather than assuming the config change alone did the job. The right number lives on your box, not in this article.
Recent posts
-

-

DNS is one of those technologies that quietly underpins... Full Story
-

BGP issues on FortiGate firewalls usually trace back to... Full Story
-

Every time your laptop talks to your router, a... Full Story
-

If you've spent any time configuring NAT on a... Full Story
-

If you have spent any time configuring firewall policies... Full Story
-

High availability on FortiGate is one of those features... Full Story
-

If you've configured SD-WAN on a FortiGate, you've almost... Full Story
-

FortiLink is the management protocol that turns a FortiSwitch... Full Story
-

FortiSwitches are pretty rock solid from Mean Time Between... Full Story
-

This is a quicky tip. Have you ever gone... Full Story
-

DNS is one of those quiet pieces of internet... Full Story
-

This article is an updated version of the previous... Full Story
-

You will add ns2 as a secondary (slave) BIND9... Full Story
-

In the process of deploying my lab, I needed... Full Story
-

RFC 8805, used to be known as Self-Correcting IP... Full Story
-

Years back, I wrote an article about certificate pinning. ... Full Story
-

FortiGates have the ability to send alerts to Microsoft... Full Story
-

In this post, I am going to walk through... Full Story
-

Troubleshooting VoIP on a FortiGate can feel like trying... Full Story
-

Prior to FortiOS 7.0, there were three commands to... Full Story
-

In this post, I am going to go over... Full Story
-

What we are going to do: We are going... Full Story
-

Choosing between FGCP (FortiGate Clustering Protocol) and FGSP (FortiGate... Full Story
-

Creating a VLAN on macOS (The "Pro" Move) A... Full Story
-

This blog post explores the logic behind how macOS... Full Story
-

Pretty Fly for a Wi-Fi Tell My Wi-Fi Love... Full Story
-

Part of my daily gig is creating BoMs (Bill-of-Materials)... Full Story
-

ICMP introduces several security risks, but careful filtering, rate... Full Story
-

The command diag debug application dhcps -1 enables full... Full Story
-

In the world of FortiOS, execute tac report is... Full Story
-

LLDP; What is it The Link Layer Discovery Protocol... Full Story
-

What it actually does When you run diagnose fdsm... Full Story
-

Monkey Bites are bite-sized, high-impact security insights designed for... Full Story
-

I have run macOS in macOS with Parallels but... Full Story
-

Don't be confused with my other FortiNAC posts where... Full Story
-

This is the third session in a multi-part article... Full Story
-

Today I was configuring key-based authentication on a FortiGate... Full Story
-

Netcat, often called the "Swiss Army knife" of networking,... Full Story
-

At its core, IEEE 802.1X is a network layer... Full Story
-

In case you did not see the previous FortiNAC... Full Story
-

This is our 5th session where we are going... Full Story
-

Now that we have Wireshark installed and somewhat configured,... Full Story
-

The Philosophy of Packet Analysis Troubleshooting isn't about looking... Full Story
-

Nmap Scripting Engine (NSE): From One-Liners to Your First... Full Story
-

Stand up TRex on Ubuntu, wire it through a... Full Story
-

1. Executive Summary Objective: Get a working, persistent nftables... Full Story