
If you've spent any time configuring user authentication on... Full Story
By Manny Fernandez
September 24, 2026

HopMatrix: A great little tool packed with features
Executive Summary
Objective: Get HopMatrix installed, verified, and working across all eight of its modes, then fold it into a repeatable troubleshooting workflow for cutovers, outages, and ISP escalations.
Target audience: Network and security engineers, SEs, and MSP field techs who need a single portable toolkit on a jump box, a customer laptop, or an air-gapped segment where installing ten separate tools is not an option.
HopMatrix is a free, portable, single-file network troubleshooting platform from RedEye Network Solutions. At its core is a continuous, ECMP-aware visual traceroute (think WinMTR that watches every path instead of one), but it also ships a native iperf3 client and server, SNMP discovery and MIB walks, multicast decoding, a Layer 2 inspector, bulk OUI lookup, a Cisco routing-table analyzer, and a fleet monitor, all sharing one session history and one export path.
Note: This guide reflects HopMatrix 1.17.x as of September 2026. The project ships fast, so menu labels and CLI switches can shift between releases. When a CLI value is wrong, HopMatrix exits and prints the list of valid values, which is the fastest way to confirm current syntax.
Prerequisites and Architecture
Assumed Knowledge
- Comfort with traceroute output, ICMP vs. UDP vs. TCP probing, and why ECMP makes classic traceroute lie.
- Basic SNMP (v2c communities, v3 auth/priv), iperf3 client/server roles, and CIDR notation.
- Local admin (Windows) or sudo (Linux/macOS) for the privileged probe types covered in Step 3.
Lab Environment
| Component | Role in this guide | Example address |
|---|---|---|
| Engineer workstation | Runs HopMatrix (client side) | 10.0.10.50 |
| Remote HopMatrix or Linux host | iperf3 server endpoint | 10.0.20.10 |
| FortiGate | SNMP v3 target, trace transit hop | 10.0.10.1 |
| Access switch | CDP/LLDP source for the L2 Inspector | 10.0.10.2 |
| Internet target | Public trace destination | 198.18.50.10 |
Platform Support
| Platform | Package options | Notes |
|---|---|---|
| Windows 10/11 x64 | Per-user installer, portable EXE, machine-wide installer, winget | Authenticode-signed via Azure Trusted Signing |
| Windows 11 ARM64 | Same three packages as x64 | Surface, Snapdragon devices |
| Linux x64 | Self-contained binary | chmod +x and run |
| macOS Apple Silicon | DMG or tarball | Developer ID signed and notarized. Intel Macs are not supported |
The Eight Modes
| Mode | What it replaces | Needs elevation or extras? |
|---|---|---|
| Trace | WinMTR, PingPlotter, repeated tracert | ICMP: no. UDP Paris and TCP SYN: yes |
| Monitor | Ping scripts, lightweight NMS | ICMP and TCP checks: no |
| iPerf | Standalone iperf3 binary | No (DSCP marking needs elevation) |
| SNMP | snmpwalk plus a spreadsheet | No |
| Multicast | Wireshark plus manual decode | Packet recording needs elevation |
| L2 Inspector | Console cable plus show cdp neighbors | Npcap on Windows plus capture privileges |
| OUI / MAC Lookup | Web vendor lookups | No, fully offline |
| Quick Tools | Subnet calc, whois, PMTU, Nmap launcher, and more | Nmap features need Nmap installed |
Caution: HopMatrix does not bundle Nmap or Npcap. Everything works without them except integrated Nmap scanning and L2 Inspector capture. Install them only on machines where you are allowed to.
Step-by-Step Implementation Workflow
Step 1: Download and Install
Goal: Get a trusted, signed copy of HopMatrix onto the workstation using the package type that fits the environment.
Action: Pick the package. Use the portable EXE for jump boxes and USB sticks (no install, no registry writes), the per-user installer or winget for your own laptop (no admin, adds hopmatrix to your user PATH), and the machine-wide installer for shared lab boxes.
Windows (winget):
# Install (per-user scope by default)
winget install --id RedEyeNetworks.HopMatrix -e

# Upgrade later
winget upgrade --id RedEyeNetworks.HopMatrix -e

# Confirm what is installed
winget list --id RedEyeNetworks.HopMatrix
Linux x64:
BASE=https://download.redeyenetworks.com/hopmatrix/releases/latest
curl -LO "$BASE/HopMatrix-linux-x64"
chmod +x HopMatrix-linux-x64
./HopMatrix-linux-x64
macOS (Apple Silicon): Download HopMatrix-osx-arm64.dmg from hopmatrix.com, drag the app to Applications, and launch it.
GUI verification: The main window opens with the mode tabs across the top and an update banner if a newer stable release exists.
Step 2: Verify the Binary Before You Trust It
Goal: Prove the file you are about to run on a production network is the signed release, not a lookalike.
Action: Check the code signature on each platform. Every stable release is also auto-submitted to VirusTotal, and the release notes carry SHA-256-keyed links you can compare against.
# Windows: confirm a valid Authenticode signature
Get-AuthenticodeSignature .\HopMatrix-win-x64.exe | Format-List Status, SignerCertificate

# Windows: hash for comparison against the release notes / VirusTotal
Get-FileHash .\HopMatrix-win-x64.exe -Algorithm SHA256
# macOS: signature and notarization (Gatekeeper) check
codesign --verify --deep --strict --verbose=2 /Applications/HopMatrix.app
spctl --assess --type execute --verbose /Applications/HopMatrix.app
# Linux or macOS: hash for comparison
shasum -a 256 HopMatrix-linux-x64Expected result: Windows reports Status : Valid. macOS reports accepted with a Developer ID source. The SHA-256 matches the value in the release notes or VirusTotal.
Step 3: Install the Optional Dependencies
Goal: Unlock integrated Nmap scanning and L2 Inspector capture.
Action: On Windows, install Npcap from npcap.com (select WinPcap API-compatible mode only if other tools need it) and Nmap from nmap.org. The Nmap Windows installer can also install Npcap for you. On Linux and macOS, install Nmap from your package manager.
# Debian / Ubuntu
sudo apt install nmap

# macOS with Homebrew
brew install nmap
GUI verification: Right-click any hop in a trace. The Nmap scan entries are enabled once HopMatrix finds Nmap.
Step 4: Run Your First Visual Trace
Goal: Map every path to a destination, not just the one that answered first.
Action: Launch a trace from the GUI Trace tab, or straight from the command line. Multiple targets open one tab each.
# Single target, opens the GUI and starts tracing immediately
hopmatrix 198.18.50.10

# Two targets, one tab per target
hopmatrix 1.1.1.1 8.8.8.8
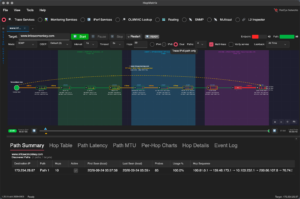
Reading the topology view:
- Multiple branches are ECMP paths. HopMatrix traces them concurrently and continuously, so a flow that hashes onto a bad member link stops hiding.
- Colored AS boxes group hops by Autonomous System. This is your evidence when two ISPs are pointing at each other.
- Delta latency on each edge shows which hop actually adds the latency, instead of making you subtract cumulative RTTs by eye.
- Per-hop sparklines with loss ticks run continuously. Let the trace run through the problem window.
- The time scrubber at the bottom replays the trace at any past moment. Drag it back to the minute the users complained.
- Plain-English detection flags routing loops, mixed ECMP, and ICMP rate limiting.
Protocol choice: ICMP needs no elevation. UDP (Paris-style, ECMP-stable) and TCP SYN probing need admin or root. Privilege-gated options are marked in the UI with a one-click restart-elevated option. Use TCP SYN to a real service port (443) when ICMP and UDP are filtered along the path.
Note: IPv4 and IPv6 can be traced side by side. For dual-stack sites, run both. An IPv6 path that exits a different transit AS than IPv4 explains a lot of “only some users are slow” tickets.
Step 5: Discover Path MTU Hop by Hop
Goal: Find the smallest MTU along the path before it breaks IPsec, SD-WAN overlays, or EAP-TLS.
Action: Open the Path MTU tab for an active trace (also available under Quick Tools as Path MTU Discovery). HopMatrix probes the path and reports MTU per hop, which matters because many internet hops drop the ICMP messages classic PMTUD depends on.
Why it matters: EAP-TLS certificates exchanged over an IPsec SD-WAN overlay are a classic victim. Oversized RADIUS packets get fragmented or dropped, and 802.1X works on some sites and fails on others. Once you know the minimum path MTU, fix it at the tunnel edge.
config system interface
    edit "<IPSEC_TUNNEL_NAME>"
        set mtu-override enable
        set mtu <PATH_MTU_MINUS_OVERHEAD>
        set tcp-mss <MTU_MINUS_40>
    next
end
Caution: Size the tunnel MTU from the measured minimum minus your actual IPsec overhead (cipher, NAT-T, and any GRE or VXLAN inside it), then validate with a do-not-fragment ping across the tunnel before calling it done.
Step 6: Monitor a Fleet Before and After a Change
Goal: Prove exactly which hosts were up before a maintenance window and confirm the same set is back afterward.
Action: In the Monitor tab, add targets by any of three methods:
- A comma-separated list of hosts.
- A CSV import.
- A CIDR block, up to a /22 (1,024 addresses).
Pick the probe type per target. ICMP is the default, TCP proves a service is listening (443, 80, 3389, and so on), UDP 53 checks DNS, NTP checks time sources, and ARP catches hosts that drop ping. Set alert thresholds on RTT, loss, and jitter. The dashboard defaults to 256 endpoints and can be raised to 1,024.
Pre-change baseline workflow:
- Add the production subnet, for example
10.0.10.0/24. - Wait for the initial sweep to finish completely.
- Click Remove Dead to prune non-responders, leaving only live hosts.
- Export the list. This is your pre-change inventory.
- After the change, reload the same list and look for red.
# Open straight into Monitor with targets
hopmatrix -m 10.0.10.1 10.0.10.2 10.0.20.10

# Import a CSV of targets into Monitor
hopmatrix --import .\cutover-targets.csv
Caution: Click Remove Dead only after the first sweep completes. Pressing it early deletes hosts that simply have not been probed yet.
Pro tips: Leave an ARP-probe monitor running against a subnet for a full business day to find truly unused IPs before you reallocate them. Right-click any monitored row to send it to Trace or Nmap, and double-click a row to open a full trace session.
Step 7: Test Throughput with the Built-In iPerf3
Goal: Measure real TCP/UDP throughput without hunting for a trustworthy iperf3 Windows build.
Action: HopMatrix implements the iperf3 wire protocol natively (verified against iperf3 3.20), so any mix works: HopMatrix to HopMatrix, HopMatrix client to a stock iperf3 -s, or a stock client to a HopMatrix server.
Server side (pick one):
# Stock iperf3 server on a Linux host
iperf3 -s -p 5201
On a remote Windows box, open HopMatrix, go to iPerf, select Server, and start it on port 5201. Allow the port through the host firewall first:
New-NetFirewallRule -DisplayName "HopMatrix iPerf 5201" -Direction Inbound -Protocol TCP -LocalPort 5201 -Action Allow -Profile Domain,PrivateClient side:
# Launch the GUI as an iPerf client against the server
hopmatrix --iperf 10.0.20.10 --port 5201
Test options worth knowing:
- Download, upload, or simultaneous bidirectional mode to stress both directions at once.
- Up to 128 parallel streams, IPv6, and DSCP marking (DSCP needs elevation) for QoS validation.
- Scheduled tests that repeat every N seconds, minutes, hours, or days, which is how you catch the 2 p.m. saturation nobody can reproduce on demand.
- Results export to JSON or copy as plain text for the ticket.
Note: If a FortiGate sits between client and server, confirm a firewall policy permits TCP 5201 (and UDP 5201 for UDP tests), and remember that UTM inspection on that policy will cap what you measure. Test with a no-inspection policy first to get a clean baseline.
Step 8: Discover and Walk SNMP Devices
Goal: Inventory every SNMP-responsive device on a subnet and pull its MIB data without a spreadsheet.
Action: Make sure the target answers SNMP. For a FortiGate, a v3 auth-priv user looks like this:
config system interface
    edit "<MGMT_INTERFACE>"
        append allowaccess snmp
    next
end
config system snmp sysinfo
    set status enable
end
config system snmp user
    edit "hopmatrix"
        set queries enable
        set security-level auth-priv
        set auth-proto sha256
        set auth-pwd <AUTH_PASSWORD>
        set priv-proto aes256
        set priv-pwd <PRIV_PASSWORD>
    next
end
In HopMatrix, open SNMP, enter the CIDR (for example 10.0.10.0/24), choose v1, v2c, or v3 with matching credentials, and run discovery. HopMatrix scans concurrently and classifies the vendor from sysObjectID. Right-click a discovered host to Walk it using one of 25+ presets and the 117-entry embedded MIB dictionary, or send it to Trace or Monitor.
GUI verification: A walk of the FortiGate returns sysDescr, sysUpTime, sysName, and interface tables.
Step 9: Inspect Layer 2 Without a Console Cable
Goal: Learn what the switch port you are plugged into actually is.
Action: With Npcap installed (Windows) and the app elevated, open L2 Inspector, pick the wired NIC, and start capture. Within one CDP or LLDP advertisement interval (typically 30 to 60 seconds) you get the switch name, port ID, platform, and on CDP the PID, VID, and serial. You also see STP and RSTP BPDUs, ARP, 802.1Q tags, and the native VLAN. Export to PCAP for Wireshark.
Use it for: confirming a port is in the VLAN the change ticket claims, spotting a rogue switch sending BPDUs, and documenting unlabeled closets.
Step 10: Troubleshoot Multicast
Goal: See what multicast is actually on the wire, decoded.
Action: Open Multicast, join a group (for example 224.0.0.1 or an application group such as 239.1.1.1), and watch the flows. Seventeen decoders cover IGMP, mDNS, SSDP, PIM, HSRP, VRRP, OSPF, and more. The mDNS service cache is browsable, the full frame is available as a hex dump, and captures export to PCAP.
Use it for: verifying IGMP joins reach the querier, finding which host is flooding SSDP, and confirming first-hop redundancy (HSRP or VRRP) hellos are present on a segment.
Step 11: Bulk-Resolve MAC Vendors
Goal: Turn a raw ARP or MAC table into a vendor-labeled inventory, even air-gapped.
Action: Paste raw show ip arp or show mac address-table output into OUI Lookup. The embedded IEEE database (57,000+ entries) resolves every MAC offline, flags multicast, broadcast, and locally administered addresses, and exports to CSV.
Note: Locally administered flags matter now. Phones and laptops with MAC randomization show up as locally administered, which explains “unknown vendor” rows in a guest or corporate Wi-Fi ARP table.
Step 12: Analyze a Routing Table Offline
Goal: Answer “where does this destination go?” from a pasted table, with no live access to the device.
Action: Paste show ip route output from a Cisco IOS or IOS-XE device into the Routing Analyzer. Look up any destination to get the longest-prefix match, egress interface, next hop, and every equal-cost path. It parses protocol, AD, metric, age, flags, and VRF, identifies the gateway of last resort, and tells you how many lines it could not parse instead of guessing.
Caution: The analyzer targets Cisco IOS and IOS-XE output. FortiOS get router info routing-table all, Junos, and NX-OS formats are not listed as supported. Check the unparsed-line count before trusting a lookup from any other platform.
Step 13: Use the Quick Tools
The Quick Tools tab collects the utilities you reach for between bigger tasks:
| Tool | Typical use |
|---|---|
| Traffic Generator (to 10 Gbps) | Load a link while you watch the trace or monitor |
| Path MTU Discovery | Standalone PMTU test (see Step 5) |
| Burst Probe | Surface microbursts and queue drops |
| Cisco Remote Capture (ciscodump over SSH) | Pull a capture from a Cisco box remotely |
| Subnet Calculator | IPv4 and IPv6 subnet math |
| Whois | Ownership of an IP or ASN seen in a trace |
| Local Route Table, ARP Table, Listening Ports, Hosts File | Quick local host sanity checks |
| Integrated Nmap | Right-click any hop or host to scan it |
Step 14: Automate and Run Air-Gapped
Goal: Launch HopMatrix into a known state from scripts or shortcuts, and keep it silent on isolated networks.
CLI launchers:
| Switch | Effect |
|---|---|
hopmatrix <target> [target...] |
Open Trace with one tab per target |
-m / --monitor |
Open Monitor with the given targets |
--import <file.csv> |
Bulk import targets from a CSV |
--iperf <host> --port <port> |
Open iPerf as a client against a server |
--snmp, --multicast, --l2, --oui, --subnet |
Open directly into that mode |
--airgap |
Suppress all external enrichment endpoints |
# Air-gapped launch into a trace
hopmatrix --airgap 10.0.20.10
In air-gap mode the OUI, ASN (Team Cymru), and GeoIP (db-ip) databases keep working because they are embedded in the binary and refreshed every release. System DNS to internal resolvers still works. Update checks can also be disabled in Settings.
Verification and Validation
Run through this checklist on a fresh install to confirm every mode is healthy.
| Test | How | Expected success |
|---|---|---|
| Signature | Get-AuthenticodeSignature or codesign --verify |
Valid / accepted |
| Trace | hopmatrix 198.18.50.10 |
Hops populate, AS boxes render, sparklines update every probe cycle |
| Elevated probes | Switch trace to TCP SYN 443 after restart-elevated | Path completes where ICMP was filtered |
| Monitor | Add 10.0.10.0/24, wait, Remove Dead |
Only live hosts remain, RTT and loss columns populated |
| iPerf | Client to iperf3 -s on 10.0.20.10 |
Throughput graph with Mbps labels, JSON export works |
| SNMP | v3 walk of the FortiGate | sysDescr returns the FortiGate model and firmware |
| L2 Inspector | Capture on the wired NIC for 60 seconds | CDP or LLDP neighbor shows switch name and port |
| OUI | Paste a MAC table | Every row resolves or is flagged as locally administered |
Troubleshooting and Gotchas
Gotcha 1: UDP or TCP Trace Options Are Greyed Out
Symptom: Only ICMP is selectable, or DSCP marking is disabled.
Cause: UDP Paris, TCP SYN probing, custom DSCP, and packet recording need raw socket privileges.
Resolution: Use the restart-elevated option, or launch from an elevated shell.
# Linux
sudo ./HopMatrix-linux-x64
Gotcha 2: A Middle Hop Shows Heavy Loss but the Destination Is Clean
Symptom: Hop 6 shows 40 percent loss, yet every later hop and the destination show 0 percent.
Cause: That router rate-limits ICMP generated to its own control plane. It is forwarding your traffic fine.
Resolution: Trust loss only when it persists to every downstream hop and the destination. HopMatrix flags rate limiting in plain English. Loss that starts at hop N and continues to the end is the real signal, and the delta-latency edge tells you where it begins.
Gotcha 3: iPerf Client Cannot Connect
Symptom: The client times out or reports connection refused.
Cause: The server is not listening, the host firewall blocks TCP 5201, or a firewall policy in the path drops it.
Resolution: Confirm the server is up and listening, then test the port directly.
Test-NetConnection 10.0.20.10 -Port 5201nc -vz 10.0.20.10 5201On a FortiGate in the path, confirm the policy match with diagnose debug flow filtered on the server IP and port 5201.
Gotcha 4: L2 Inspector Shows Nothing
Symptom: Capture runs but no CDP, LLDP, or BPDU frames appear.
Cause: Npcap is missing, the app is not elevated, the selected adapter is Wi-Fi or a VPN virtual adapter, or the switch has CDP/LLDP disabled on that port.
Resolution: Install Npcap, restart elevated, pick the physical wired NIC, and wait at least 60 seconds. If ARP appears but no discovery protocol does, the switch is not advertising on that port.
Gotcha 5: SNMP Discovery Finds Nothing
Symptom: A /24 scan returns zero hosts.
Cause: Wrong version or credentials, SNMP not allowed on the interface, or an ACL/trusted-host list excluding the workstation.
Resolution: Verify with a single known device first. On FortiGate, confirm allowaccess includes snmp on the interface you are querying and the v3 user has queries enable.
Licensing and Where It Fits
HopMatrix is free for personal and internal business use with no account, no trial, and no gated tier. The license is proprietary: modification, redistribution, and derivative works are not permitted. If you run it on customer equipment as a consultant, read the license terms first.
In a Fortinet-heavy workflow, HopMatrix covers the client-side view (paths, MTU, throughput, what the endpoint sees) while the FortiGate covers the device-side view (diagnose sniffer packet, diagnose debug flow, SD-WAN SLA logs). Running both on the same problem window is what closes tickets.
Recent posts
-

-

DNS is one of those technologies that quietly underpins... Full Story
-

BGP issues on FortiGate firewalls usually trace back to... Full Story
-

Every time your laptop talks to your router, a... Full Story
-

If you've spent any time configuring NAT on a... Full Story
-

If you have spent any time configuring firewall policies... Full Story
-

High availability on FortiGate is one of those features... Full Story
-

If you've configured SD-WAN on a FortiGate, you've almost... Full Story
-

FortiLink is the management protocol that turns a FortiSwitch... Full Story
-

FortiSwitches are pretty rock solid from Mean Time Between... Full Story
-

This is a quicky tip. Have you ever gone... Full Story
-

DNS is one of those quiet pieces of internet... Full Story
-

This article is an updated version of the previous... Full Story
-

You will add ns2 as a secondary (slave) BIND9... Full Story
-

In the process of deploying my lab, I needed... Full Story
-

RFC 8805, used to be known as Self-Correcting IP... Full Story
-

Years back, I wrote an article about certificate pinning. ... Full Story
-

FortiGates have the ability to send alerts to Microsoft... Full Story
-

In this post, I am going to walk through... Full Story
-

Troubleshooting VoIP on a FortiGate can feel like trying... Full Story
-

Prior to FortiOS 7.0, there were three commands to... Full Story
-

In this post, I am going to go over... Full Story
-

What we are going to do: We are going... Full Story
-

Choosing between FGCP (FortiGate Clustering Protocol) and FGSP (FortiGate... Full Story
-

Creating a VLAN on macOS (The "Pro" Move) A... Full Story
-

This blog post explores the logic behind how macOS... Full Story
-

Pretty Fly for a Wi-Fi Tell My Wi-Fi Love... Full Story
-

Part of my daily gig is creating BoMs (Bill-of-Materials)... Full Story
-

ICMP introduces several security risks, but careful filtering, rate... Full Story
-

The command diag debug application dhcps -1 enables full... Full Story
-

In the world of FortiOS, execute tac report is... Full Story
-

LLDP; What is it The Link Layer Discovery Protocol... Full Story
-

What it actually does When you run diagnose fdsm... Full Story
-

Monkey Bites are bite-sized, high-impact security insights designed for... Full Story
-

I have run macOS in macOS with Parallels but... Full Story
-

Don't be confused with my other FortiNAC posts where... Full Story
-

This is the third session in a multi-part article... Full Story
-

Today I was configuring key-based authentication on a FortiGate... Full Story
-

Netcat, often called the "Swiss Army knife" of networking,... Full Story
-

At its core, IEEE 802.1X is a network layer... Full Story
-

In case you did not see the previous FortiNAC... Full Story
-

This is our 5th session where we are going... Full Story
-

Now that we have Wireshark installed and somewhat configured,... Full Story
-

The Philosophy of Packet Analysis Troubleshooting isn't about looking... Full Story
-

Executive Summary Objective: Get HopMatrix installed, verified, and working... Full Story
-

Executive Summary Objective: Stand up RIPv2 between two FortiGates,... Full Story
-

Executive Summary Every FortiGate IPsec write-up tells you to... Full Story