
If you've spent any time configuring user authentication on... Full Story
By Manny Fernandez
September 28, 2026
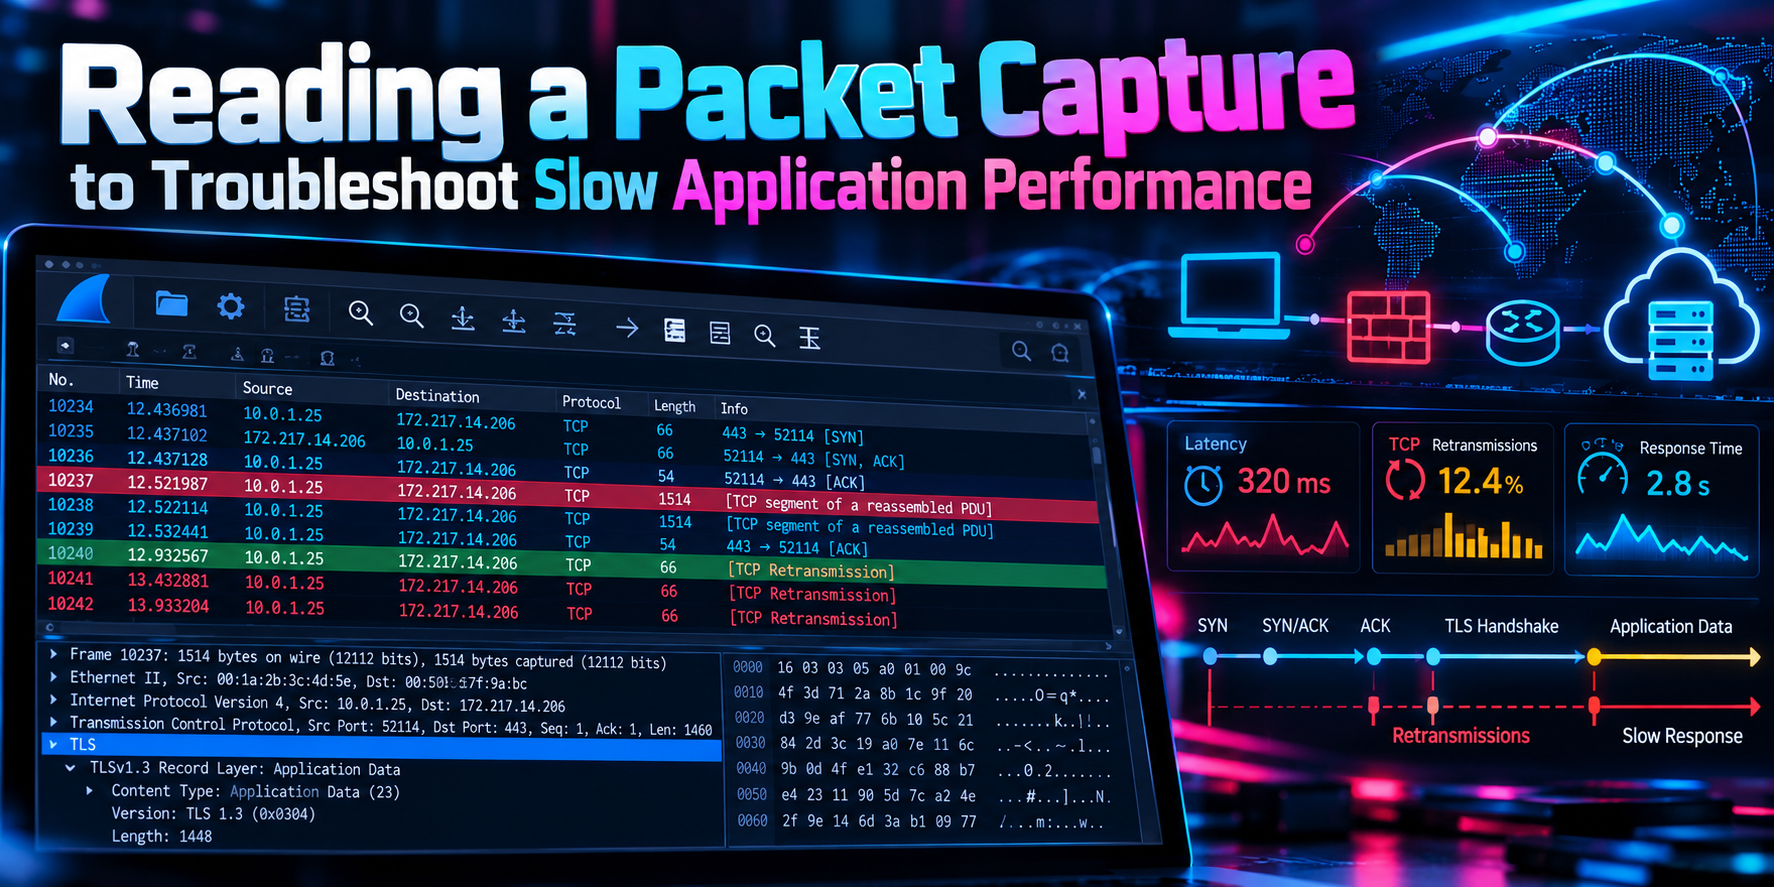
Reading a Packet Capture to Troubleshoot Slow Application Performance
Executive Summary
Objective: Turn “the app is slow” into a measured answer. Every slow transaction breaks down into network delay (RTT and loss), server processing time, client processing time, and protocol behavior (too many round trips, small windows, timeouts). A packet capture lets you measure each bucket instead of guessing, and it ends the “it’s the network” versus “it’s the app” argument with evidence.
Target audience: Network and security engineers, SEs, and application support teams who can open Wireshark but want a repeatable method for performance problems.
What you will be able to do: Capture the right traffic at the right point, configure Wireshark for timing analysis, split transaction time into network time and server time, identify loss, window limits, and chatty application patterns in TCP, and measure DNS, RTP, QUIC, and custom UDP flows where the transport layer gives you nothing.
Prerequisites and Architecture
Assumed Knowledge
You should be comfortable with IP addressing, the TCP three-way handshake, sequence and acknowledgment numbers, and basic Wireshark navigation (display filters, Follow Stream).
Lab and Environment
| Component | Role | Example Value |
|---|---|---|
| Client workstation | Where the user feels the slowness | 10.0.10.25 |
| FortiGate | Path device and capture point | port3 10.0.10.1, wan1 198.18.0.2 |
| Application server | Service being measured | 198.18.10.50:443 |
| DNS resolver | Name resolution before connect | 10.0.10.53 |
| Analysis tools | Capture and decode | Wireshark 4.x, tshark, tcpdump, dumpcap, pktmon, FortiGate sniffer |
The Time Budget Model
The whole method rests on one idea: the time a user waits is a sum of measurable parts. Your job is to find which part is large.
Total wait = DNS lookup
           + TCP connect         (1 RTT)
           + TLS handshake       (1 RTT for TLS 1.3, 2 RTT for TLS 1.2)
           + app turns x RTT     (each sequential request/response)
           + server think time   (backend, database, auth, disk)
           + transfer time       (bandwidth, window, congestion)
+ loss recovery (fast retransmit or RTO stalls)| Time Bucket | Measured From | Usually Owned By |
|---|---|---|
| DNS lookup | Query to response (dns.time) |
DNS / infrastructure team |
| TCP connect | SYN to SYN/ACK | Network path, firewall, server listen queue |
| Server think time | Request ACK to first response byte | Application / database team |
| App turns | Number of sequential round trips x RTT | Application design |
| Transfer time | First byte to last byte | Bandwidth, TCP window, loss |
| Loss recovery | Gaps before retransmissions | Network path (congestion, errors) |
Step-by-Step Implementation Workflow
Step 1: Scope the Slow Transaction and Choose Capture Points
Goal: Know exactly which user action is slow and where you will see its packets.
Action: Get a reproducible action with a number attached, for example “opening the Orders report takes 12 seconds, it used to take 2.” Record the client IP, the server FQDN and IPs, and the time of each test. Then choose where to capture. Start as close to the client as possible, because that shows what the user experiences. Capture at both ends at the same time when you can, since comparing two points is how you prove where loss or delay is introduced.
| Capture Point | What It Proves | Watch Out For |
|---|---|---|
| Client host | Exactly what the user experiences | NIC offload artifacts (giant segments, bad checksums) |
| SPAN / mirror port | Wire view without touching hosts | SPAN drops packets under load |
| Network TAP | Most accurate wire view | Needs physical access and a TAP |
| FortiGate sniffer | Both sides of the firewall in one trace | NP-offloaded sessions are invisible |
| Server host | Server receive and response timing | Same offload artifacts as the client |
Verification: You can state the slow action, the expected time, the observed time, and the two IPs involved in one sentence.
Step 2: Capture the Right Packets
Goal: A trace containing the whole transaction, from the DNS lookup through the last byte of the response.
Action: Follow these rules on every capture:
- Start the capture before the user acts. You need the DNS query, the SYN, and the TLS handshake. Without the SYN, Wireshark does not know the window scale factor and its window analysis will be wrong.
- Filter by host, not by port. A port filter hides DNS, Kerberos, LDAP, and redirects to other servers.
- Use full snap length so application headers are available.
- Use a ring buffer for intermittent problems so the capture can run for hours without filling the disk.
- Capture a known-good baseline of the same action. Good versus bad comparison is the fastest way to spot what changed.
- Log TLS session keys on the client so you can decrypt and see application-level timing.
Linux or macOS with tcpdump:
sudo tcpdump -i eth0 -s 0 -w slow.pcap host 198.18.10.50 or host 10.0.10.53Long-running ring buffer with dumpcap (10 files of 100 MB each):
dumpcap -i eth0 -f "host 10.0.10.25" -b filesize:100000 -b files:10 -w ring.pcapngWindows with the built-in pktmon, then convert to pcapng:
pktmon filter add -i 198.18.10.50
pktmon start --capture --pkt-size 0 -f slow.etl
pktmon stop
pktmon etl2pcap slow.etl -o slow.pcapng
TLS key logging for browsers and curl (set before launching the application):
export SSLKEYLOGFILE=$HOME/tls-keys.log        # Linux / macOS
setx SSLKEYLOGFILE "%USERPROFILE%\tls-keys.log"  # Windows, new sessions
Capturing on the FortiGate
The FortiGate sniffer shows both sides of the firewall in a single trace, which is ideal for proving whether delay or loss happens before or after the firewall.
diagnose sniffer packet any "host 10.0.10.25 and host 198.18.10.50" 6 0 aVerbosity 6 prints headers, payload, and the interface name. The 0 means no packet count limit, and a prints absolute UTC timestamps. Save the session output to a text file and convert it with the fgt2eth.pl script, or use the GUI capture (Network > Diagnostics > Packet Capture on FortiOS 7.4 and later) to download a pcap directly.
Sessions offloaded to NP hardware bypass the CPU and never appear in the sniffer. Disable offload on the matching policy for the duration of the capture, then set it back:
config firewall policy
    edit 15
        set auto-asic-offload disable
    next
end
Verification: Open the trace and confirm the DNS query, the SYN, SYN/ACK, and ACK, and the full response are present. Run capinfos slow.pcap to confirm the capture duration covers the whole test, and check that dumpcap or tcpdump reported zero dropped packets when it stopped.
Step 3: Configure Wireshark for Timing Analysis
Goal: Make time gaps and TCP state visible at a glance.
Action: Create a dedicated configuration profile (Edit > Configuration Profiles) called ISM-Perf so these settings do not clutter your everyday profile. Then:
- Set
View>Time Display Format>Seconds Since Previous Displayed Packet. Large gaps jump out immediately when you filter to a single stream. - In
Preferences>Protocols>TCP, enable Calculate conversation timestamps and confirm Analyze TCP sequence numbers is on. - Add the columns below (right-click a field in the packet details pane and choose Apply as Column).
| Column | Field | Why It Matters |
|---|---|---|
| Delta in stream | tcp.time_delta |
Gap since the previous packet in the same TCP stream |
| ACK RTT | tcp.analysis.ack_rtt |
How long each segment took to be acknowledged |
| Initial RTT | tcp.analysis.initial_rtt |
Handshake RTT, valid from any capture point |
| Bytes in flight | tcp.analysis.bytes_in_flight |
Unacknowledged data outstanding |
| Calc window | tcp.window_size |
Receiver’s advertised window, after scaling |
| Stream | tcp.stream |
Isolate a single connection quickly |
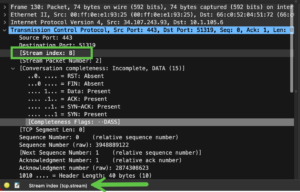
You can see the name of the filter on the bottom.
Know where the built-in tools live:
- Statistics > Conversations finds the large and long-lived flows. Sort by Duration or Bytes.
- Analyze > Expert Information summarizes retransmissions, zero windows, resets, and other anomalies.
- Statistics > TCP Stream Graphs provides Stevens (sequence over time), Throughput, Round Trip Time, and Window Scaling graphs.
- Statistics > I/O Graphs plots traffic over time. Add a second graph with the filter
tcp.analysis.flagsto see when problems occur.
Verification: Filter on tcp.stream eq 0 and confirm the new columns populate with values.
Step 4: Measure the Baseline RTT from the Handshake
Goal: Establish the network round trip time. Every other number is judged against it.
Action: On a client-side capture, the time from SYN to SYN/ACK is the round trip to the server. On a server-side capture, SYN/ACK to the final ACK gives the same measurement from the other end. The tcp.analysis.initial_rtt field combines both halves, so it is correct wherever you captured.
tshark -r slow.pcap -Y "tcp.analysis.initial_rtt" \
  -T fields -e tcp.stream -e ip.dst -e tcp.analysis.initial_rtt | sort -u
While you are at the handshake, check the negotiated options in the SYN and SYN/ACK:
tshark -r slow.pcap -Y "tcp.flags.syn==1" -T fields -e ip.src \
-e tcp.options.mss_val -e tcp.options.wscale.shift -e tcp.options.sack_perm- MSS values like 536 or 1360 point to tunnels, MSS clamping, or path MTU problems.
- Window scale must appear in both the SYN and the SYN/ACK. If either side omits it, scaling is disabled and the window is capped at 64 KB. Some middleboxes strip this option.
- SACK permitted missing on either side makes loss recovery much slower.
A retransmitted SYN (a second SYN about 1 second later, then about 3 seconds) means the delay happened before the application even started. Filter with tcp.flags.syn==1 && tcp.analysis.retransmission and look at the firewall policy, routing, or the server’s listen queue.
Verification: You have a single RTT number for the path, for example 38 ms, and you know whether window scaling and SACK are active.
Step 5: Split Network Time from Server Time
Goal: Prove whether the delay lives in the network or in the application.
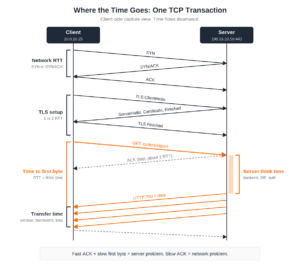
Action: Find the client’s request (an HTTP GET, a SQL query, an SMB read) and measure three intervals:
- Request to server ACK: about one RTT. This is the network.
- Request to first response byte: time to first byte. Subtract the RTT and the remainder is server think time.
- First response byte to last response byte: transfer time, governed by bandwidth, window size, and loss.
Worked example: RTT is 38 ms. The client sends a GET at 0.000 s. The server ACKs at 0.039 s. The first response byte arrives at 2.412 s. Server think time is roughly 2.412 minus 0.038, or 2.37 seconds. The network delivered the request quickly; the server took over two seconds to answer.
The fast ACK, slow data pattern: If the server acknowledges the request within one RTT but the data arrives seconds later, the network is fine and the server is slow (backend database, authentication, disk). This single observation settles most “it’s the network” disputes.
List the largest gaps in the trace, sorted worst first:
tshark -r slow.pcap -o tcp.calculate_timestamps:TRUE -Y "tcp.time_delta > 0.5" \
  -T fields -e frame.number -e tcp.stream -e ip.src -e tcp.time_delta \
  | sort -k4 -rn | head -20
With TLS keys loaded, measure HTTP response time directly:
tshark -r slow.pcap -o tls.keylog_file:tls-keys.log -Y "http.time > 1" \
  -T fields -e http.response_for.uri -e http.time
For each large gap, ask who is waiting on whom by looking at the packet after the gap:
| Pattern Around the Gap | Meaning |
|---|---|
| Client sent, silence, server responds | Server think time (or network, if even the ACK is late) |
| Server sent, silence, client acts | Client processing or the user |
| Silence, then a retransmission | Loss followed by a retransmission timeout |
| Zero window just before the silence | Receiving application is not reading its buffer |
Verification: For the slow transaction, you can write down RTT, server think time, and transfer time, and they add up to roughly the observed delay.
Step 6: Hunt Loss and Retransmissions
Goal: Determine whether packet loss is inflating the transaction and where it happens.
Action: Filter with tcp.analysis.retransmission || tcp.analysis.fast_retransmission and read the pattern:
| What You See | What It Means |
|---|---|
| Duplicate ACKs, then fast retransmission | Loss detected quickly and recovered in about one RTT. Modest impact. |
| Retransmission after a long gap (200 ms to 1 s+), gaps doubling | Retransmission timeout (RTO). The connection stalls entirely. Very damaging. |
| Spurious retransmission | The data was received. Usually an RTT spike from queuing (bufferbloat), not true loss. |
| Out-of-order segments | Multipath or load-balancer reordering. Heavy reordering triggers false fast retransmits. |
| Previous segment not captured | The capture missed a packet: loss upstream of you, or your capture dropped it. |
Location tells you where the loss happens. If your trace shows both the original segment and its retransmission, the original was lost downstream of your capture point. If you only see the retransmission, the original was lost before it reached you.
Small loss rates matter more than people expect. The Mathis approximation gives the throughput ceiling for a TCP flow under steady random loss:
Throughput <= (MSS / RTT) x (1.22 / sqrt(loss))

MSS 1460 bytes, RTT 50 ms, 1% loss:
(11,680 bits / 0.05 s) x (1.22 / 0.1) = about 2.85 Mbps
One percent loss on a 50 ms path caps a single flow near 3 Mbps, no matter how large the circuit is.
Summarize and plot loss from the command line:
tshark -r slow.pcap -q -z expert,warn
tshark -r slow.pcap -q -z io,stat,1,tcp.analysis.retransmission
Verification: You know the retransmission count, whether recovery was fast retransmit or RTO, and which side of your capture point lost the packets.
Step 7: Check Windows and Flow Control
Goal: Determine whether throughput is limited by the TCP window rather than by bandwidth or loss.
Action: Filter with tcp.analysis.zero_window || tcp.analysis.window_full.
- Zero window: the receiver’s buffer is full and it is telling the sender to stop. The receiving application is not reading data fast enough. This is a host or application problem, not a network problem. Look for zero-window probes and the window update that follows.
- Window full: the sender has filled the receiver’s advertised window and must wait for ACKs. The transfer is window-limited.
- Bytes in flight flat against a ceiling: throughput is capped by the window. The Stevens graph shows this as a staircase: a burst, a pause of one RTT, another burst.
The window versus RTT math tells you whether you have found the limit:
Max throughput = window / RTT

64 KB window, 50 ms RTT:  (65,535 x 8) / 0.05 = about 10.5 Mbps
Window needed for 1 Gbps at 50 ms (the BDP): 1,000,000,000 x 0.05 / 8 = 6.25 MB
If the observed throughput matches window divided by RTT, adding bandwidth will not help. The fix is window scaling, larger socket buffers, or a closer server.
Verification: Observed throughput is explained by one of three ceilings: link bandwidth, window divided by RTT, or the loss-based ceiling from Step 6.
Step 8: Identify Chatty and Protocol Behavior
Goal: Catch delays caused by how the application uses the network rather than by the network itself.
Action: Look for these patterns:
- Many small sequential turns. Count the request/response round trips in a transaction and multiply by the RTT. An application making 400 sequential calls across a 40 ms WAN spends 16 seconds on latency alone, and no bandwidth upgrade fixes that. SMB, database drivers, and poorly designed APIs are the usual sources.
- Nagle and delayed ACK interaction. A steady, repeating gap of about 40 ms (Linux) or 200 ms (Windows) where a small segment waits for an ACK that is being deliberately delayed.
- Connection churn. A new TCP and TLS handshake for every request instead of connection reuse. Each one costs one to three extra RTTs.
- Resets. Check who sent the RST and when. Compare the RST’s TTL to the server’s normal packets; a different TTL usually means a firewall or IPS generated it (idle timeout, session table, inspection verdict).
- TLS handshake cost. TLS 1.2 adds two RTTs, TLS 1.3 adds one. Watch for slow certificate delivery or OCSP and CRL checks that stall the client.
Useful counters:
# How many connections did one user action open?
tshark -r slow.pcap -Y "tcp.flags.syn==1 && tcp.flags.ack==0" | wc -l

# Who sent resets, and with what TTL?
tshark -r slow.pcap -Y "tcp.flags.reset==1" -T fields -e ip.src -e ip.ttl \
  | sort | uniq -c

# SMB2 service response times (count of calls and average per command)
tshark -r slow.pcap -q -z smb2,srt
Verification: You can state how many round trips and connections the transaction required, and whether that count, multiplied by RTT, explains the delay.
Step 9: Account for Everything Before the First SYN
Goal: Catch delays that happen before the application connection exists.
Action: Time from the user’s click to the first SYN is often spent on name resolution, authentication, or proxy discovery. Filter the start of the trace with dns || kerberos || ldap || http.request.uri contains "wpad" and look for:
- Slow or retried DNS queries (covered in detail in Step 10).
- Kerberos ticket requests or LDAP lookups that take seconds against a distant or overloaded domain controller.
tshark -r slow.pcap -q -z ldap,srtsummarizes LDAP response times. - Proxy auto-discovery (WPAD/PAC) lookups that time out before the browser falls back to a direct connection.
- HTTP redirects that send the client to a second server, which means a second DNS lookup, handshake, and TLS negotiation.
Verification: The time between the user action and the first SYN is accounted for, and it is small relative to the total.
Step 10: Analyze UDP Flows
Goal: Measure performance for protocols with no ACKs, no sequence numbers, and no windows.
Action: UDP gives you nothing at the transport layer to judge loss or delay. You measure at the application layer, by pairing requests with responses or by reading the application’s own sequence numbers.
DNS
- Response time:
dns.timeis the time between a query and its matching response. - Unanswered queries:
dns.flags.response == 0 && !dns.response_in. Look for clients retrying (commonly after 1, 2, or 5 seconds) or failing over to a second resolver. That retry interval becomes user-visible delay. - Truncation:
dns.flags.truncated == 1forces a retry over TCP. If TCP/53 is blocked, resolution breaks. - Search-suffix walking: a single lookup expanding into several queries for
name.corp.example,name.example, and so on, each with its own round trip.
tshark -r slow.pcap -Y "dns.flags.response==1" \
  -T fields -e dns.qry.name -e dns.time -e dns.flags.rcode | sort -k2 -rn | head
Voice and Video (RTP)
Use Telephony > RTP > RTP Streams, then Stream Analysis. Wireshark reads RTP sequence numbers and timestamps to report loss (sequence gaps), jitter (variation in arrival time), maximum delta (largest gap between packets), and sequence errors. Jitter consistently above about 30 ms degrades voice quality. If you see SIP signaling but RTP flowing in only one direction, suspect NAT, a SIP ALG, or a missing firewall pinhole. Check RTCP as well, because endpoints report their own view of loss and jitter there, and confirm that DSCP markings survive the path with ip.dsfield.dscp == 46 for EF.
tshark -r voip.pcap -q -z rtp,streamsQUIC and HTTP/3
QUIC runs over UDP/443 and encrypts almost everything, including packet numbers. Without keys you can still measure handshake timing (Initial to Handshake packets), overall gaps, and throughput in the I/O graph. With SSLKEYLOGFILE set, Wireshark decrypts QUIC and shows ACK frames and stream data. If a network blocks or rate-limits UDP/443, browsers fall back to TCP after a delay, and that fallback can itself be the slowness.
Custom UDP Applications
- Pair requests and responses by the 5-tuple and measure response times.
- Identical payloads repeated at regular intervals mean the application’s own retry timer is firing, which usually indicates loss or no response.
- ICMP port unreachable (
icmp.type == 3 && icmp.code == 3) means nothing is listening, or a device is rejecting the traffic. - Bursts and gaps in the I/O graph, compared against the expected send rate, reveal pacing or queuing problems.
Verification: For each UDP flow, you have a response time or a loss and jitter figure, measured from application-layer data.
Step 11: Check Fragmentation and MTU
Goal: Catch the “small packets work, large packets vanish” class of problems.
Action: Large UDP datagrams (DNS with DNSSEC, IKE, some VPN and video protocols) get IP-fragmented. If any single fragment is lost, the entire datagram is lost, and many firewalls drop fragments outright.
- Find fragments with
ip.flags.mf == 1 || ip.frag_offset > 0. - Find “fragmentation needed” messages with
icmp.type == 3 && icmp.code == 4. These drive Path MTU Discovery. - If those ICMP messages are filtered somewhere on the path, you get a PMTUD black hole. It hits TCP too: the handshake succeeds, small requests work, then the connection hangs on the first full-size segment, followed by repeated RTO retransmissions of the same large segment.
Verification: Either no fragmentation or black-hole pattern is present, or you have identified the hop that needs an MSS clamp or an ICMP allow rule.
Verification and Validation
Build and Reconcile the Time Budget
The analysis is complete when your measured buckets add up to what the user experienced and one bucket clearly dominates. Example for the 12 second Orders report:
| Bucket | Measured | Evidence |
|---|---|---|
| DNS lookup | 0.02 s | dns.time on the A record |
| TCP connect + TLS 1.2 | 0.11 s | 3 RTT at 38 ms |
| App turns | 1.37 s | 36 sequential API calls x 38 ms |
| Server think time | 10.2 s | Fast ACKs, 10.2 s total wait for first bytes |
| Transfer | 0.29 s | 1.4 MB, no window or loss limit |
| Loss recovery | 0 s | No retransmissions |
| Total | 11.99 s | Matches the 12 s user report |
The success criteria are simple: the total lands within about 10 percent of the user-reported time, and a single dominant bucket (here, server think time) points to the owning team with packet-level evidence.
Compare Good Versus Bad
Run the same summaries on the baseline capture and the slow capture:
tshark -r good.pcap -q -z conv,tcp > good-conv.txt
tshark -r slow.pcap -q -z conv,tcp > slow-conv.txt
tshark -r good.pcap -q -z expert,warn > good-expert.txt
tshark -r slow.pcap -q -z expert,warn > slow-expert.txt
diff good-expert.txt slow-expert.txt
Expected result for a healthy baseline: near-identical RTT between the two traces, zero or near-zero retransmissions in the good trace, and a clear difference in exactly one bucket between them. If the RTT changed, look at the path. If only server think time changed, hand it to the application team.
Troubleshooting and Gotchas
NIC Offload Makes the Trace Lie
Symptom: Segments of 30 KB or more, and checksum errors on every outbound packet, in a capture taken on the client or server.
Cause: TSO, GSO, GRO, and LRO hand the capture stack packets before the NIC segments them or after it coalesces them. The wire never saw those giant frames.
Resolution: Capture from a TAP or SPAN port instead, or temporarily disable offload on a dedicated capture host only:
sudo ethtool -K eth0 tso off gso off gro off lro offDisable checksum validation in Wireshark (Preferences > Protocols > IPv4 and TCP) so false checksum errors do not distract you.
FortiGate Sniffer Shows Nothing, or Only the Handshake
Symptom: diagnose sniffer packet shows the SYN exchange and then goes quiet while the session is clearly passing traffic.
Cause: After the session is established, it is offloaded to the NP processor and bypasses the CPU where the sniffer runs.
Resolution: Set auto-asic-offload disable on the matching policy as shown in Step 2, clear the session so it is rebuilt on the CPU path, capture, and then re-enable offload.
diagnose sys session filter dst 198.18.10.50
diagnose sys session clear
Missing SYN Breaks Window Analysis
Symptom: Wireshark reports window full or zero window conditions that do not make sense, or the calculated window size looks tiny.
Cause: The capture started mid-connection, so Wireshark never saw the window scale option and treats the raw window field as unscaled.
Resolution: Recapture starting before the user action. If that is impossible, set the TCP preference “Scaling factor to use when not available from capture” to the value the endpoints normally negotiate.
False Loss from a Dropping Capture
Symptom: Many “previous segment not captured” and “ACKed unseen segment” warnings, but no retransmissions follow.
Cause: The capture dropped packets, not the network. The endpoints received everything, which is why nothing was retransmitted. SPAN ports and busy capture hosts are common culprits.
Resolution: Check the dropped count that dumpcap or tcpdump prints on exit, use a capture filter to reduce volume, write to fast local disk, or move to a TAP.
Clock Skew Between Capture Points
Symptom: A packet appears to arrive at the server before the client sent it.
Cause: Capture hosts are not time-synchronized.
Resolution: Sync all capture hosts with NTP before testing. When comparing two traces, align them on a shared packet (the SYN is ideal) and compare deltas rather than absolute timestamps.
Quick Reference: Display Filters
| Purpose | Filter |
|---|---|
| All TCP problems | tcp.analysis.flags && !tcp.analysis.window_update |
| Retransmissions | tcp.analysis.retransmission || tcp.analysis.fast_retransmission |
| Duplicate ACKs | tcp.analysis.duplicate_ack |
| Zero window or window full | tcp.analysis.zero_window || tcp.analysis.window_full |
| Resets | tcp.flags.reset == 1 |
| Connection attempts | tcp.flags.syn == 1 && tcp.flags.ack == 0 |
| SYN retransmissions | tcp.flags.syn == 1 && tcp.analysis.retransmission |
| Large gaps in a stream | tcp.time_delta > 0.2 |
| Slow ACKs | tcp.analysis.ack_rtt > 0.1 |
| Slow HTTP responses | http.time > 1 |
| Slow DNS | dns.time > 0.5 |
| Unanswered DNS | dns.flags.response == 0 && !dns.response_in |
| ICMP errors | icmp.type == 3 || icmp.type == 11 |
| IP fragments | ip.flags.mf == 1 || ip.frag_offset > 0 |
| Fragmentation needed | icmp.type == 3 && icmp.code == 4 |
Quick Reference: Symptom to Likely Cause
| Symptom in the Capture | Likely Cause |
|---|---|
| Fast ACK, slow data response | Server, application, or backend |
| Slow SYN/ACK or SYN retransmissions | Path, firewall policy, or server listen queue |
| RTO retransmissions with doubling gaps | Packet loss, congestion, or a black hole |
| Zero window from the receiver | Receiving application or host cannot keep up |
| Throughput equals window / RTT, flat bytes in flight | Window-limited: check window scaling and buffers |
| Many sequential small round trips | Chatty application: latency-bound, not bandwidth-bound |
| Regular 40 ms or 200 ms gaps | Nagle and delayed ACK interaction |
| Large packets vanish, small ones work | MTU or PMTUD black hole |
| DNS retries at 1 s, 2 s, or 5 s | Unresponsive resolver or DNS packet loss |
| RTP sequence gaps and high jitter | Loss or queuing on the path: check QoS |
| RST with an unexpected TTL | A middlebox (firewall or IPS) reset the session |
The One Question
Every step in this guide answers the same question: where is the time going? Measure the RTT, split each transaction into network time and server time, count the round trips, and check for loss and window limits. When the buckets add up to what the user felt, you have your answer and the evidence to back it up.
Recent posts
-

-

DNS is one of those technologies that quietly underpins... Full Story
-

BGP issues on FortiGate firewalls usually trace back to... Full Story
-

Every time your laptop talks to your router, a... Full Story
-

If you've spent any time configuring NAT on a... Full Story
-

If you have spent any time configuring firewall policies... Full Story
-

High availability on FortiGate is one of those features... Full Story
-

If you've configured SD-WAN on a FortiGate, you've almost... Full Story
-

FortiLink is the management protocol that turns a FortiSwitch... Full Story
-

FortiSwitches are pretty rock solid from Mean Time Between... Full Story
-

This is a quicky tip. Have you ever gone... Full Story
-

DNS is one of those quiet pieces of internet... Full Story
-

This article is an updated version of the previous... Full Story
-

You will add ns2 as a secondary (slave) BIND9... Full Story
-

In the process of deploying my lab, I needed... Full Story
-

RFC 8805, used to be known as Self-Correcting IP... Full Story
-

Years back, I wrote an article about certificate pinning. ... Full Story
-

FortiGates have the ability to send alerts to Microsoft... Full Story
-

In this post, I am going to walk through... Full Story
-

Troubleshooting VoIP on a FortiGate can feel like trying... Full Story
-

Prior to FortiOS 7.0, there were three commands to... Full Story
-

In this post, I am going to go over... Full Story
-

What we are going to do: We are going... Full Story
-

Choosing between FGCP (FortiGate Clustering Protocol) and FGSP (FortiGate... Full Story
-

Creating a VLAN on macOS (The "Pro" Move) A... Full Story
-

This blog post explores the logic behind how macOS... Full Story
-

Pretty Fly for a Wi-Fi Tell My Wi-Fi Love... Full Story
-

Part of my daily gig is creating BoMs (Bill-of-Materials)... Full Story
-

ICMP introduces several security risks, but careful filtering, rate... Full Story
-

The command diag debug application dhcps -1 enables full... Full Story
-

In the world of FortiOS, execute tac report is... Full Story
-

LLDP; What is it The Link Layer Discovery Protocol... Full Story
-

What it actually does When you run diagnose fdsm... Full Story
-

Monkey Bites are bite-sized, high-impact security insights designed for... Full Story
-

I have run macOS in macOS with Parallels but... Full Story
-

Don't be confused with my other FortiNAC posts where... Full Story
-

This is the third session in a multi-part article... Full Story
-

Today I was configuring key-based authentication on a FortiGate... Full Story
-

Netcat, often called the "Swiss Army knife" of networking,... Full Story
-

At its core, IEEE 802.1X is a network layer... Full Story
-

In case you did not see the previous FortiNAC... Full Story
-

This is our 5th session where we are going... Full Story
-

Now that we have Wireshark installed and somewhat configured,... Full Story
-

The Philosophy of Packet Analysis Troubleshooting isn't about looking... Full Story
-

I have been playing with all forms of grep... Full Story
-

Three engines, two bundle locations, two update pipelines, and... Full Story
-

2026 refresh of the original IPTable Firewall GUI post... Full Story