
If you've spent any time configuring user authentication on... Full Story
By Manny Fernandez
October 8, 2026
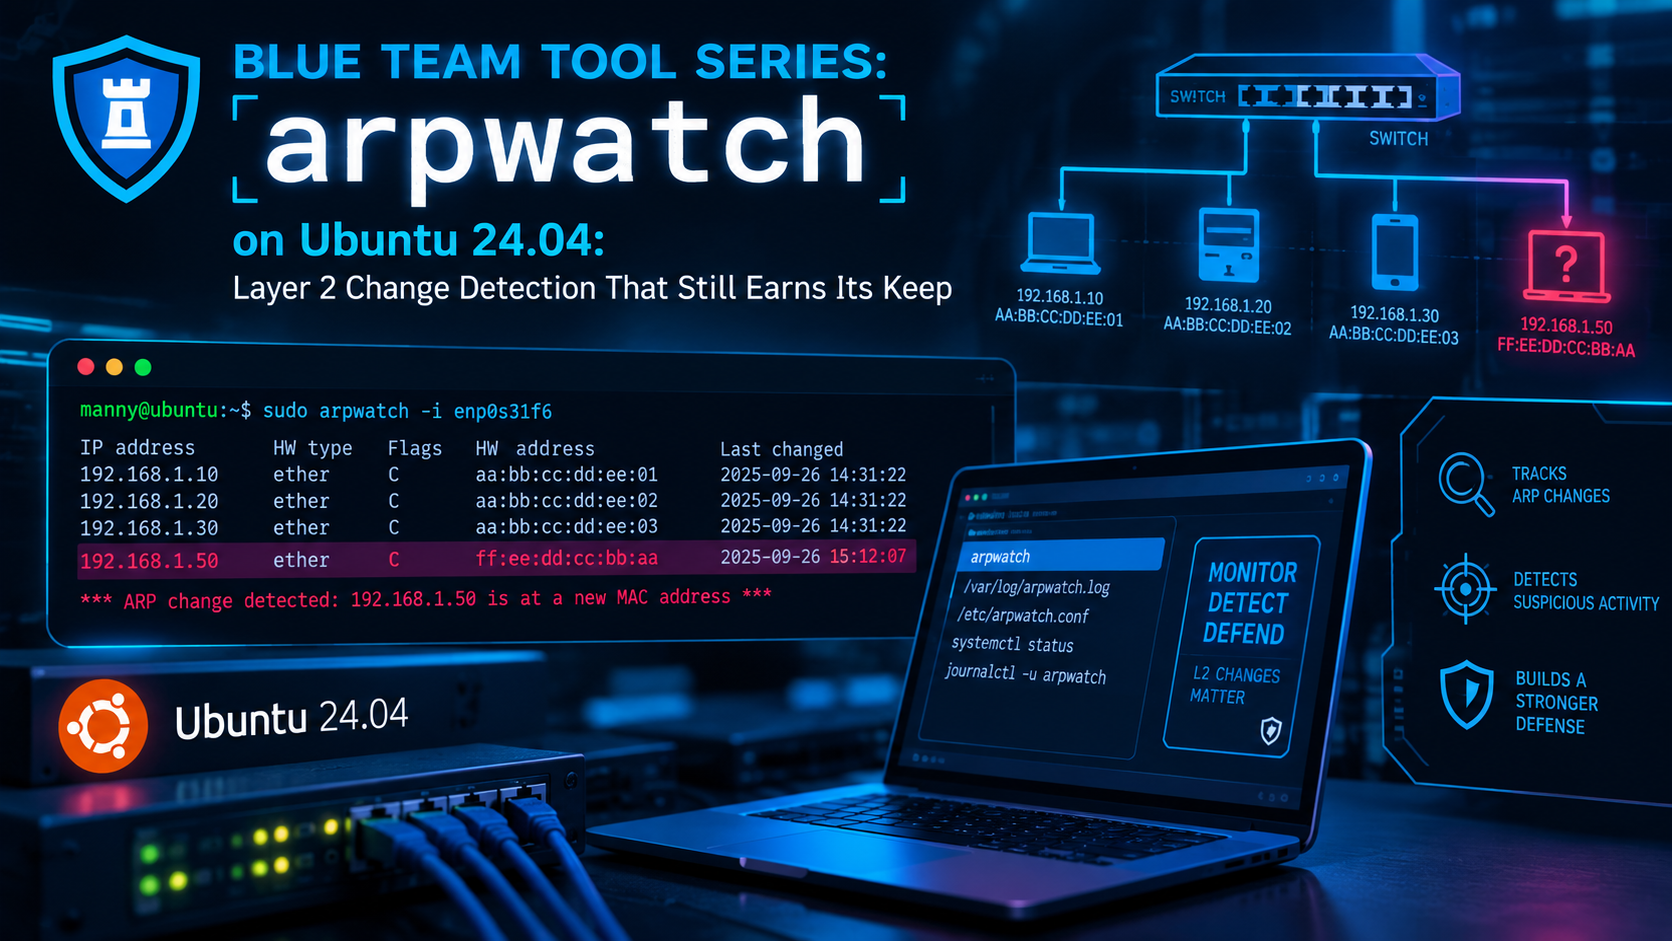
Blue Team Tool Series: “arpwatch” on Ubuntu 24.04: Layer 2 Change Detection That Still Earns Its Keep
Executive Summary
ARP has no authentication. Any host on a broadcast domain can claim any IP address, and every neighbor will believe it. That single design fact is the root of ARP spoofing, ARP cache poisoning, and a lot of quiet man-in-the-middle work. arpwatch does not stop any of that. What it does is watch every ARP packet it can see, remember which MAC address owns which IP address, and tell you the moment that relationship changes. When I had my own firewall, “Safe-T-Net” back in the day, I ran it as an “early warning tool” that would let me know as soon as a new client would connect to the network. On certain VLANs, this is critical.
It is a small, decades-old tool from Craig Leres at Lawrence Berkeley National Laboratory, and it is still one of the cheapest ways to get a Layer 2 change log on a segment you care about: server VLANs, OT cells, management networks, and anywhere a new MAC address should be a rare event.
| Item | Detail |
|---|---|
| Objective | Deploy arpwatch as a systemd-managed sensor on Ubuntu 24.04 LTS, tune out the noise, forward alerts to email or a SIEM, and prove it fires with a controlled test. |
| Target audience | Network and security engineers, SOC analysts, and homelabbers who want Layer 2 visibility without buying a NAC. |
| Outcome | A per-interface arpwatch instance with a baseline database, clean alerting, and a validated detection for MAC changes and flip flops. |
How arpwatch Works
arpwatch opens the interface with libpcap and applies a filter for ARP and RARP only. On the Debian and Ubuntu build the effective filter is (arp or rarp) and not vlan, with anything you pass via -F ANDed on the end. For each packet it pulls the sender MAC and sender IP, then checks them against its database file (/var/lib/arpwatch/IFNAME.dat on Ubuntu).
- If the pairing is already known and current, it updates the timestamp and moves on.
- If the MAC address has never been seen, it raises new station.
- If a known IP address shows up with a different MAC address, it raises changed ethernet address or, if the MAC swapped back to the previous one, flip flop.
- If the source IP does not belong to the local subnet, it logs a bogon.
Every event is written to syslog. Reportable events are also emailed unless you tell it not to. The database is held in memory and flushed to disk periodically and on a clean shutdown, so do not hand-edit the .dat file while the service is running.
Event Reference
| Event | What arpwatch saw | What it usually means |
|---|---|---|
| new station | A MAC address not in the database | New device, NIC swap, VM clone, or phone MAC randomization |
| new activity | A known pair used again after six months or more | Dormant device came back; worth a look on static networks |
| changed ethernet address | Known IP now answered by a new MAC | Hardware replacement, IP conflict, or ARP spoofing |
| flip flop | IP bounced back to the previously seen MAC | HA or FHRP failover, IP conflict, or an active MITM fighting the real host |
| reused old ethernet address | IP moved to the third or older MAC in history | Same as flip flop but with more than two claimants |
| bogon | Source IP not local to the subnet | Misconfigured host, secondary subnet on the wire, or spoofing |
| ethernet mismatch | Frame source MAC differs from the MAC inside the ARP payload | Proxy ARP, some virtualization stacks, or crafted packets |
| ethernet broadcast / ip broadcast | All-ones or all-zeros MAC, or a broadcast IP as sender | Broken stacks or crafted packets |
Practitioner read: on a server, OT, or management VLAN, a changed ethernet address or flip flop for the default gateway IP is the alert you actually care about. Everything else is context.
Prerequisites and Architecture
Assumed Knowledge
- Comfort with the Linux CLI,
systemctl, andjournalctl. - Working understanding of ARP, gratuitous ARP, and broadcast domains.
- Ability to configure a SPAN or mirror port on your switch if you want full visibility.
Lab Environment
| Component | Role | Addressing |
|---|---|---|
| Ubuntu Server 24.04 LTS | arpwatch sensor, NIC ens18 on the user VLAN |
10.0.10.25/24 |
| FortiGate | Default gateway for VLAN 10 | 10.0.10.1 |
| Linux test client | Used to trigger a controlled MAC change | 10.0.10.60 |
| DHCP scope | Dynamic clients (candidate for suppression) | 10.0.10.100 to 10.0.10.199 |
| SIEM or syslog collector | Receives arpwatch syslog | 10.0.20.50 |
Placement: What the Sensor Can Actually See
This is the part most arpwatch write-ups skip. On a switched network, ARP requests and gratuitous ARPs are broadcast, so every port sees them. ARP replies are unicast, so a plain access port only sees replies addressed to the sensor itself. A lot of spoofing tools send unicast replies straight to the victim, which a plain access port will never see.
| Sensor placement | Promiscuous | Sees requests and GARP | Sees other hosts’ replies |
|---|---|---|---|
| Plain access port | Off (-p, Ubuntu default) |
Yes | No |
| Plain access port | On | Yes | No, the switch never forwards them |
| SPAN or mirror port | On | Yes | Yes |
| VLAN trunk with subinterfaces | Per subinterface | Yes, per VLAN | Only with mirroring |
Recommendation: for detection that matters, mirror the VLAN (or at least the gateway and critical server ports) to a dedicated sensor NIC and run that instance with promiscuous mode on. For a cheap new-device log, a plain access port with the Ubuntu defaults is fine.
Step-by-Step Implementation
Step 1: Install arpwatch
Goal: get the package, the service user, and the default directories in place.
Action: install from the Ubuntu archive and confirm what landed.
sudo apt update
sudo apt install -y arpwatch

dpkg -l arpwatch | tail -n 1
id arpwatch
ls -l /etc/arpwatch/ /var/lib/arpwatch/
cat /etc/default/arpwatch
Verification: id arpwatch returns a system user, and /etc/default/arpwatch shows the global defaults. On Ubuntu those are typically ARGS="-N -p" (suppress bogon reports, no promiscuous mode) and RUNAS="arpwatch".
Step 2: Understand the Debian and Ubuntu Config Model
Goal: know which file controls what before you change anything. Older guides reference /etc/arpwatch.conf or /etc/sysconfig/arpwatch. Those are legacy or RHEL paths and do nothing on a current Ubuntu box.
| File or unit | Purpose |
|---|---|
| /etc/default/arpwatch | Global options for every instance (ARGS, RUNAS) |
| /etc/arpwatch/IFNAME.iface | Per-interface overrides in sh syntax |
| arpwatch@IFNAME.service | systemd template unit, one instance per interface |
| /var/lib/arpwatch/IFNAME.dat | Per-interface MAC/IP database |
| /etc/arpwatch/README | Package notes on the variables the .iface file accepts |
Action: read the template unit and the README on your own box, because the variable handling is package-specific.
systemctl cat arpwatch@.service
cat /etc/arpwatch/README
In the current packaging, ARGS in an .iface file replaces the global ARGS, and IFACE_ARGS adds extra flags for that interface only. If your README says otherwise, trust the README.
Step 3: Create the Per-Interface Config
Goal: define the instance for ens18 with a report recipient and the local subnet declared.
Action (plain access port, Ubuntu defaults):
sudo tee /etc/arpwatch/ens18.iface >/dev/null <<'EOF'
# arpwatch instance for ens18 (VLAN 10, 10.0.10.0/24)
IFACE_ARGS="-m soc-alerts@example.com -n 10.0.10.0/24"
EOF
Action (SPAN or mirror port): replace the global ARGS so -p is dropped and the NIC goes promiscuous.
sudo tee /etc/arpwatch/ens18.iface >/dev/null <<'EOF'
# arpwatch instance for ens18 on a SPAN port
ARGS="-N"
IFACE_ARGS="-m soc-alerts@example.com -n 10.0.10.0/24"
EOF
Verification: cat /etc/arpwatch/ens18.iface shows the variables with no stray quotes.
Step 4: Seed the Database and Start the Instance
Goal: make sure the data file exists with the right owner, then enable the unit.
Action: the man page is explicit that an empty data file must exist before the first run. Recent unit files create it for you, but doing it yourself is harmless and avoids a confusing first failure.
DAT=/var/lib/arpwatch/ens18.dat
[ -e "$DAT" ] || sudo install -o arpwatch -g arpwatch -m 644 /dev/null "$DAT"

sudo systemctl enable --now arpwatch@ens18
systemctl status arpwatch@ens18 --no-pager
Verification: the unit is active (running) and the process line shows your flags.
ps -o user,args -C arpwatchExpect to see the process running as arpwatch with -i ens18, -f /var/lib/arpwatch/ens18.dat, and the flags you configured.
Step 5: Decide How Alerts Leave the Box
Goal: get events somewhere a human or a correlation rule will see them. arpwatch hands reports to sendmail, so email only works if an MTA is installed.
Option A, email: install a relay-only MTA (for example postfix in satellite mode, or msmtp-mta) pointed at your mail relay, then test it.
command -v sendmail || echo "no sendmail binary, email reports will fail"
printf 'Subject: arpwatch test\n\nrelay ok\n' | sendmail soc-alerts@example.com
Option B, syslog to SIEM (recommended): disable email with -Q and forward the arpwatch program tag with rsyslog. This keeps the sensor dumb and lets your SIEM (Wazuh, FortiAnalyzer, or anything else that ingests syslog) do the correlation.
sudo tee /etc/arpwatch/ens18.iface >/dev/null <<'EOF'
IFACE_ARGS="-Q -n 10.0.10.0/24"
EOF

sudo tee /etc/rsyslog.d/60-arpwatch.conf >/dev/null <<'EOF'
if $programname == 'arpwatch' then @@10.0.20.50:514
EOF

sudo systemctl restart rsyslog arpwatch@ens18
@@ is TCP; use a single @ for UDP. Wazuh’s default ruleset includes arpwatch decoders and rules inherited from OSSEC, so check your manager’s ruleset for them before writing your own.
Step 6: Tune Out the Noise
Goal: keep alerts rare enough that someone still reads them.
| Noise source | Flag | Example |
|---|---|---|
| DHCP scope on a mask boundary (e.g. 10.0.10.128/26) | -z net/mask (dotted mask only, no CIDR) | -z 10.0.10.128/255.255.255.192 |
| Second subnet on the same wire | -n net/width | -n 10.0.11.0/24 |
| Bogon chatter | -N | Already in the Ubuntu default ARGS |
| A known noisy MAC (HA, FHRP, lab box) | -F pcap filter | -F ‘not ether src 00:00:5e:00:01:0a’ |
Note that -z does not accept prefix lengths, and it only matches ranges that sit on a mask boundary. The lab scope (10.0.10.100 to 10.0.10.199) does not, so a pcap filter on the ARP sender address is cleaner:
# /etc/arpwatch/ens18.iface
IFACE_ARGS="-Q -n 10.0.10.0/24 \
  -F 'not (arp[14:4] >= 0x0a000a64 and arp[14:4] <= 0x0a000ac7)'"
arp[14:4] is the sender protocol address in an Ethernet/IPv4 ARP payload, and 0x0a000a64 to 0x0a000ac7 is 10.0.10.100 to 10.0.10.199. Test the expression with sudo tcpdump -ni ens18 'arp and not (...)' first, then restart the instance with sudo systemctl restart arpwatch@ens18 and confirm with ps -o args -C arpwatch that the filter arrived as a single argument. How quotes survive the trip from the .iface file to the command line depends on the unit file, which is why Step 2 has you read it.
Step 7: Watch Multiple VLANs from One Sensor
Goal: cover several VLANs without deploying several boxes. Because the built-in filter excludes 802.1Q-tagged frames, point arpwatch at untagged VLAN subinterfaces, one instance each.
Action: trunk the VLANs to ens19, create subinterfaces with netplan, then start an instance per subinterface.
sudo tee /etc/netplan/60-arpwatch-vlans.yaml >/dev/null <<'EOF'
network:
  version: 2
  ethernets:
    ens19: {}
  vlans:
    ens19.20:
      id: 20
      link: ens19
    ens19.30:
      id: 30
      link: ens19
EOF
sudo chmod 600 /etc/netplan/60-arpwatch-vlans.yaml
sudo netplan apply

for IF in ens19.20 ens19.30; do
  echo 'IFACE_ARGS="-Q"' | sudo tee /etc/arpwatch/$IF.iface >/dev/null
  sudo systemctl enable --now arpwatch@$IF
done
Verification: systemctl list-units 'arpwatch@*' shows one running instance per interface, each with its own .dat file.
Verification and Validation
Check the Baseline
Give the sensor a few minutes (or a business day on a quiet segment) to learn the network. Every first sighting is a new station event, so expect a burst at startup.
journalctl -t arpwatch --since "15 min ago" --no-pager | tail -n 20

# The .dat file is flushed periodically and on stop
sudo cat /var/lib/arpwatch/ens18.dat
Each database line holds the MAC, the IP, a Unix timestamp of last activity, and a hostname if one resolved.
Trigger a Controlled MAC Change
On the lab test client (10.0.10.60, NIC ens18), swap to a locally administered MAC and announce it with a gratuitous ARP. Do this only on a host and network you own.
ORIG=$(cat /sys/class/net/ens18/address)
sudo ip link set dev ens18 down
sudo ip link set dev ens18 address 02:de:ad:be:ef:01
sudo ip link set dev ens18 up
sudo arping -U -c 3 -I ens18 10.0.10.60

# Put it back to generate a flip flop
sudo ip link set dev ens18 down
sudo ip link set dev ens18 address "$ORIG"
sudo ip link set dev ens18 up
sudo arping -U -c 3 -I ens18 10.0.10.60
Expected success output on the sensor (representative; exact field layout varies slightly by build):
$ journalctl -t arpwatch -f
arpwatch: changed ethernet address 10.0.10.60 2:de:ad:be:ef:1 (bc:24:11:4a:7:c2)
arpwatch: flip flop 10.0.10.60 bc:24:11:4a:7:c2 (2:de:ad:be:ef:1)
Notice the MAC formatting: arpwatch drops leading zeros in each octet (2:de:ad:be:ef:1, not 02:de:ad:be:ef:01). Normalize that in your SIEM parser before you try to join these events against DHCP or switch MAC tables.
Dry Run Without Touching the Service
Debug mode runs in the foreground and prints reports to stderr instead of mailing them. Combine it with -r to replay a capture, which is handy for testing filters or reviewing a PCAP from an incident.
sudo tcpdump -i ens18 -w /tmp/arp.pcap arp -c 500

: > /tmp/replay.dat
sudo arpwatch -d -r /tmp/arp.pcap -f /tmp/replay.dat
Troubleshooting and Gotchas
Service Will Not Start
Symptom: arpwatch@ens18 fails immediately or restarts in a loop.
Diagnose:
journalctl -u arpwatch@ens18 -b --no-pager | tail -n 30
ls -l /var/lib/arpwatch/
ip -br link show ens18
Resolution: the usual causes are a missing or root-owned .dat file (the process drops to the arpwatch user and cannot write), a typo in the instance name versus the real interface name, or quoting errors in the .iface file. Recreate the data file with the install command from Step 4 and match the instance name to ip -br link exactly.
It Only Ever Reports new station
Symptom: you see new devices, but a spoofing test with unicast replies never alerts.
Diagnose: confirm what the NIC actually receives.
sudo tcpdump -ni ens18 -c 50 'arp' | awk '{print $3, $4, $5, $6}'
ip -d link show ens18 | grep -o 'promiscuity [0-9]*'
Resolution: if you only see Request who-has and no replies between other hosts, the port is not mirrored. Move the sensor to a SPAN port and set ARGS="-N" in the .iface file so promiscuous mode is enabled.
Flip Flop Storms
Symptom: the same IP bounces between two MACs over and over.
Diagnose: look up both MACs before you assume an attack.
| MAC pattern | Likely source |
|---|---|
| 00:09:0f:09:xx:xx | FortiGate FGCP HA virtual MAC during a failover |
| 00:00:5e:00:01:xx | VRRP virtual router MAC |
| 00:00:0c:07:ac:xx | Cisco HSRPv1 virtual MAC |
| Second hex digit of 2, 6, A, or E | Locally administered MAC, often phone or laptop privacy MAC |
| Two different real vendor OUIs | Genuine IP conflict or an active man-in-the-middle |
Resolution: filter known HA and FHRP MACs with -F, exclude privacy-MAC Wi-Fi segments or move them under -z, and treat the last row as an incident until proven otherwise.
Quick Hits
- No email arrives: there is no MTA. Either install one (Step 5, Option A) or add
-Qand rely on syslog. - Tagged traffic ignored: by design. Use VLAN subinterfaces (Step 7).
- Stale entries after re-IPing a subnet: stop the instance, move the old
.dataside, recreate an empty one, start again. - Vendor names missing in reports: the vendor lookup comes from the packaged
ethercodes.db, which ages. Treat vendor strings as a hint, not an identity.
Where arpwatch Fits Next to Your FortiGate and FortiSwitch
arpwatch is detection, not prevention. If the segment sits behind FortiSwitch, enable DHCP snooping and Dynamic ARP Inspection on the VLAN so forged ARP from untrusted ports is dropped at the edge. arpwatch then becomes the independent witness: it tells you when something changed that the switch allowed, and it keeps a history you can correlate with the FortiGate’s own view.
# On the FortiGate, compare its ARP table against the arpwatch database
get system arp
diagnose ip arp list
A mismatch between the gateway’s ARP entry for a critical server and the MAC arpwatch has on record is exactly the kind of signal worth an automation stitch or a SIEM correlation rule.
Quick Reference: Flags
| Flag | Purpose |
|---|---|
| -i IFACE | Interface to listen on |
| -f FILE | Database file (Ubuntu instances use /var/lib/arpwatch/IFNAME.dat) |
| -n NET/WIDTH | Additional local network, suppresses bogons for it |
| -N | Do not report bogons |
| -a | Process bogons normally and report their events (Debian patch) |
| -p | Disable promiscuous mode (Debian patch) |
| -F FILTER | Extra pcap filter ANDed onto (arp or rarp) and not vlan (Debian patch) |
| -z NET/MASK | Ignore an IP range, dotted mask only (Debian patch) |
| -m ADDR | Report recipient, default root (Debian patch) |
| -Q | Never send email reports (Debian patch) |
| -s PATH | Alternate sendmail program (Debian patch) |
| -u USER | Drop privileges to USER (Debian patch) |
| -d | Debug: foreground, reports to stderr |
| -r FILE | Read from a pcap file instead of the wire |
Flags marked as Debian patches exist in the Debian and Ubuntu package. Builds from the upstream LBL tarball or other distributions may spell some of them differently, so check man arpwatch on the box you are running.
Recent posts
-

-

DNS is one of those technologies that quietly underpins... Full Story
-

BGP issues on FortiGate firewalls usually trace back to... Full Story
-

Every time your laptop talks to your router, a... Full Story
-

If you've spent any time configuring NAT on a... Full Story
-

If you have spent any time configuring firewall policies... Full Story
-

High availability on FortiGate is one of those features... Full Story
-

If you've configured SD-WAN on a FortiGate, you've almost... Full Story
-

FortiLink is the management protocol that turns a FortiSwitch... Full Story
-

FortiSwitches are pretty rock solid from Mean Time Between... Full Story
-

This is a quicky tip. Have you ever gone... Full Story
-

DNS is one of those quiet pieces of internet... Full Story
-

This article is an updated version of the previous... Full Story
-

You will add ns2 as a secondary (slave) BIND9... Full Story
-

In the process of deploying my lab, I needed... Full Story
-

RFC 8805, used to be known as Self-Correcting IP... Full Story
-

Years back, I wrote an article about certificate pinning. ... Full Story
-

FortiGates have the ability to send alerts to Microsoft... Full Story
-

In this post, I am going to walk through... Full Story
-

Troubleshooting VoIP on a FortiGate can feel like trying... Full Story
-

Prior to FortiOS 7.0, there were three commands to... Full Story
-

In this post, I am going to go over... Full Story
-

What we are going to do: We are going... Full Story
-

Choosing between FGCP (FortiGate Clustering Protocol) and FGSP (FortiGate... Full Story
-

Creating a VLAN on macOS (The "Pro" Move) A... Full Story
-

This blog post explores the logic behind how macOS... Full Story
-

Pretty Fly for a Wi-Fi Tell My Wi-Fi Love... Full Story
-

Part of my daily gig is creating BoMs (Bill-of-Materials)... Full Story
-

ICMP introduces several security risks, but careful filtering, rate... Full Story
-

The command diag debug application dhcps -1 enables full... Full Story
-

In the world of FortiOS, execute tac report is... Full Story
-

LLDP; What is it The Link Layer Discovery Protocol... Full Story
-

What it actually does When you run diagnose fdsm... Full Story
-

Monkey Bites are bite-sized, high-impact security insights designed for... Full Story
-

I have run macOS in macOS with Parallels but... Full Story
-

Don't be confused with my other FortiNAC posts where... Full Story
-

This is the third session in a multi-part article... Full Story
-

Today I was configuring key-based authentication on a FortiGate... Full Story
-

Netcat, often called the "Swiss Army knife" of networking,... Full Story
-

At its core, IEEE 802.1X is a network layer... Full Story
-

In case you did not see the previous FortiNAC... Full Story
-

This is our 5th session where we are going... Full Story
-

Now that we have Wireshark installed and somewhat configured,... Full Story
-

The Philosophy of Packet Analysis Troubleshooting isn't about looking... Full Story
-

Executive Summary Objective: Give you a working command of... Full Story
-

You have configured it a dozen times. Server IP,... Full Story
-

Executive Summary Objective: Walk through every message a FortiGate... Full Story