
If you've spent any time configuring user authentication on... Full Story
By Manny Fernandez
September 29, 2026
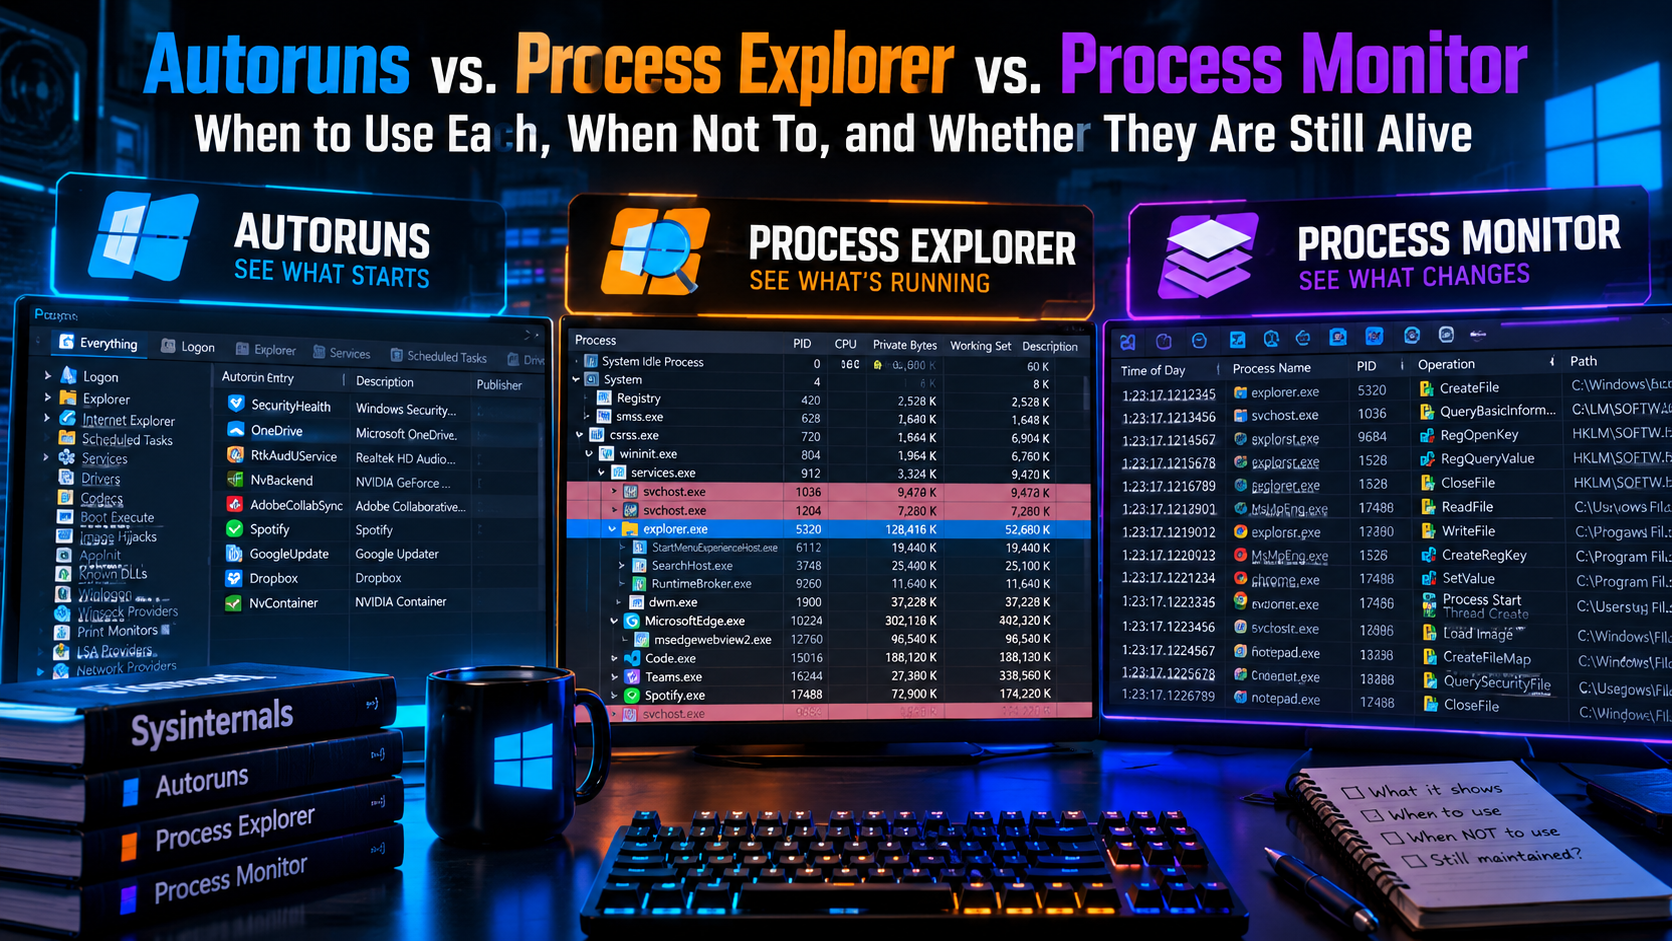
Autoruns vs. Process Explorer vs. Process Monitor: When to Use Each, When Not To, and Whether They Are Still Alive
Objective: Pick the right Sysinternals tool in the first minute of a Windows investigation instead of the fifth. Audience: SOC analysts, incident responders, desktop/server engineers, and SEs who get asked “why is this box doing that?”
The one-sentence version
All three tools come from Mark Russinovich’s Sysinternals suite, and all three get lumped together as “the process tools.” They answer three completely different questions:
| Tool | The question it answers | Time model | Binary |
|---|---|---|---|
| Autoruns | What is configured to run? | State at rest (config, persistence) | Autoruns64.exe, autorunsc64.exe |
| Process Explorer | What is running right now, and what does it hold? | Live snapshot, refreshed on an interval | procexp64.exe |
| Process Monitor | What did it actually do, step by step? | Event timeline (every file, registry, process, network, IPC operation) | Procmon64.exe |
If you remember nothing else: Autoruns is the past and the future (what will launch), Process Explorer is the present, Process Monitor is the recording. Most real investigations use all three in that order.
Prerequisites and environment
- Windows endpoint or server with local administrator rights. All three tools load a kernel driver or read protected locations, so standard user sessions give you a partial and misleading view.
- The 64-bit binaries on x64 and ARM64 systems (
Autoruns64.exe,procexp64.exe,Procmon64.exe; ARM64 builds ship as*64a.exe). The 32-bit binaries on a 64-bit OS hit WOW64 redirection and miss things. - A change window or at least a heads-up to whoever owns the EDR. Process Explorer and Process Monitor load signed Microsoft drivers, and some EDR policies alert on that.
- Optional:
wingetor the Microsoft Store for keeping the tools current (covered in the lifecycle section).
Autoruns: the persistence map
What it is
Autoruns enumerates every autostart extensibility point (ASEP) Windows knows about: Run and RunOnce keys, services and drivers, scheduled tasks, Winlogon entries, Explorer shell extensions, AppInit DLLs, Image File Execution Options hijacks, boot execute, Winsock providers, print monitors, LSA providers, WMI event subscriptions, Office add-ins, codecs, and, since v14.2, Windows packaged apps (MSIX/AppX) configured to start. It ships with autorunsc, a command-line version that outputs CSV, tab-delimited, XML, or JSON.
When to use it
- Persistence hunting. Something keeps coming back after a reboot. Autoruns is the fastest way to see every place it could be re-launched from.
- Post-incident validation. After remediation, prove nothing is left in an ASEP. Save a baseline
.arnfile and use File > Compare against it later. - Slow logon and slow boot triage. Kill the noise from vendor updaters, tray apps, and shell extensions that load into Explorer.
- Offline analysis. File > Analyze Offline System points Autoruns at a mounted image or a disk from a dead box, which is excellent for IR on a machine you do not want to boot.
- Fleet sweeps.
autorunscwith signature verification and hashes produces a CSV you can stack across hundreds of endpoints to find the one outlier.
:: Full ASEP sweep, all users, verify signatures, hash everything, hide
:: signed Microsoft entries, CSV out, no banner, accept EULA silently
autorunsc64.exe -accepteula -nobanner -a * -s -h -m -c * > C:\IR\%COMPUTERNAME%_autoruns.csv

:: Same sweep, but also check hashes against VirusTotal (sends HASHES only)
autorunsc64.exe -accepteula -nobanner -a * -s -h -m -v -vt -c * > C:\IR\%COMPUTERNAME%_autoruns_vt.csv
Flag reference: -a * = all ASEP categories, -s = verify digital signatures, -h = file hashes, -m = hide signed Microsoft entries, -v = VirusTotal lookup by hash, -vt = accept VirusTotal terms non-interactively, -c = CSV, the trailing * = all user profiles.
When NOT to use it
- Real-time detection. Autoruns is a point-in-time scan. It will not tell you when a Run key was written or by which process. For that you want Sysmon (Event IDs 12, 13, 14 for registry, 1 for process create) or your EDR telemetry.
- In-memory-only or living-off-the-land activity. If the attacker never touches an ASEP (injected shellcode, a one-shot PowerShell download cradle), there is nothing for Autoruns to find.
- Bulk “cleanup” on production servers. Unchecking entries moves them into an
AutorunsDisabledkey or folder, which is recoverable, but Delete is not. Unchecking the wrong service or driver on a domain controller is a very bad afternoon. - Figuring out why something is slow right now. That is a Process Explorer question.
Process Explorer: Task Manager with the lid off
What it is
Process Explorer shows the live process tree with parent/child relationships, per-process CPU, memory, I/O, GPU, and thread activity, plus a lower pane that lists every handle (files, registry keys, mutexes, sections, events) or every DLL a process has loaded. Version 17 added a dark theme, a multi-pane layout with a threads pane, and faster startup. Recent 17.x releases added a parent PID column, CPU core-type information on hybrid Intel parts, and System Information dialog improvements.
When to use it
- “The file is in use by another process.” Find > Find Handle or DLL (
Ctrl+F), type part of the path, and it tells you exactly which process holds it. You can close the handle, but read the gotchas first. - Which service inside
svchost.exeis eating CPU. Hover or open Properties > Services on the svchost instance; drill into the Threads tab to see the start address and the service DLL responsible. - Suspicious process triage. Enable Options > Verify Image Signatures and Options > VirusTotal.com > Check VirusTotal.com, then add the Verified Signer and VirusTotal columns. Unsigned image, odd parent (Word spawning
cmd.exe), running from%TEMP%or%APPDATA%: that is your short list. - DLL version and side-loading questions. Switch the lower pane to DLL view (
Ctrl+D) and confirm whichversion.dllorlibcryptoa process actually loaded, and from which path. - Handle or memory leaks. Add the Handles, Private Bytes, and GDI Objects columns and watch the trend over an hour.
- Replacing Task Manager on your own admin workstation. Options > Replace Task Manager makes
Ctrl+Shift+Escopen Process Explorer.
When NOT to use it
- History. Process Explorer shows what exists at refresh time. A process that lives for 200 ms between refreshes may never appear. Use Process Monitor or Sysmon Event ID 1 for short-lived processes.
- Scripting and automation. There is no real CLI. For scripted equivalents use
handle64.exe(open handles),listdlls64.exe(loaded DLLs), andpslist64.exe(process list). - Network forensics. The TCP/IP tab shows endpoints per process, but for the full live socket table use TCPView, and for content use Wireshark or a FortiGate packet capture.
- Proving why an operation failed. Process Explorer shows state, not results. “Access denied” and “file not found” live in Process Monitor.
:: Scripted equivalents when you cannot (or should not) open a GUI
handle64.exe -accepteula -nobanner -a "C:\Data\locked.xlsx"
listdlls64.exe -accepteula -nobanner -d version.dll
pslist64.exe -accepteula -nobanner -t
Process Monitor: the flight recorder
What it is
Process Monitor (Procmon) replaced the old Filemon and Regmon tools. It records file system, registry, process/thread, network, and profiling events in real time, with full stack traces per operation, non-destructive filtering, and boot-time logging. The 2026 releases added a Process Tree PID filter that matches any ancestor process ID (v4.05) and a new IPC event class for named pipes and mailslots (v4.1), which is a genuinely big deal for lateral-movement and C2 investigations that use SMB named pipes.
When to use it
- Access denied, file not found, path not found. Filter on
Resultis notSUCCESSfor the process in question. The firstACCESS DENIEDorNAME NOT FOUNDright before the app errors out is usually the answer. - DLL search-order and side-loading analysis. Every
NAME NOT FOUNDon a.dllin an application folder is a candidate hijack path. - Reverse-engineering what an installer or updater changes. Record the install, then use Tools > File Summary and Tools > Registry Summary.
- Boot and logon problems. Options > Enable Boot Logging captures from very early in boot until you launch Procmon again after logon.
- Malware detonation in a lab. Pair Procmon with Process Explorer and a packet capture in an isolated VM, and you have the core of a dynamic-analysis workflow.
- Named pipe activity (v4.1+). Watch which process creates or connects to a pipe such as
\\.\pipe\msagent_*or anything unexpected.
:: Headless capture for a remote session or a scheduled repro.
:: Always use a backing file on a disk with free space, never the pagefile default.
Procmon64.exe /AcceptEula /Quiet /Minimized /BackingFile C:\IR\trace.pml /LoadConfig C:\IR\filters.pmc

:: ... reproduce the issue ...

:: Stop the capture cleanly (flushes and closes the PML)
Procmon64.exe /Terminate

:: Convert to CSV for grep, Excel, or a SIEM upload
Procmon64.exe /OpenLog C:\IR\trace.pml /SaveAs C:\IR\trace.csv
Build filters.pmc once in the GUI (Filter > Filter…, then File > Export Configuration) and reuse it. Also enable Filter > Drop Filtered Events so excluded events never hit memory.
When NOT to use it
- Always-on monitoring. Procmon is a diagnostic capture tool, not a sensor. Leaving it running on a production server will consume memory and disk quickly (tens of thousands of events per second on a busy box). Continuous telemetry is Sysmon’s job, forwarded to your SIEM (FortiSIEM, Wazuh, Sentinel, whatever you run).
- Long unfiltered captures. Without Drop Filtered Events and a backing file, a 10-minute capture can exhaust RAM and hang the host you are trying to fix.
- Quick “who has this file open” questions. That is 5 seconds in Process Explorer and 10 minutes of filtering in Procmon.
- Packet content. Procmon network events show TCP/UDP send and receive by process with sizes, not payloads.
Head-to-head comparison
| Criteria | Autoruns | Process Explorer | Process Monitor |
|---|---|---|---|
| Primary question | What will run? | What is running? | What did it do? |
| Data type | Configuration snapshot | Live state | Event stream |
| Catches short-lived processes | Only if persisted | Often misses them | Yes |
| Kernel driver | No (reads config) | Yes (PROCEXP driver) | Yes (PROCMON driver) |
| Command-line version | Yes, autorunsc |
No (use handle, listdlls, pslist) | Yes, via switches on Procmon64.exe |
| Offline or dead-box analysis | Yes | No | Opens saved PML files only |
| Signature and VirusTotal checks | Yes | Yes | No |
| Performance impact | Negligible | Low | Moderate to high if unfiltered |
| Best for | Persistence, baselines, fleet sweeps | Locks, CPU, svchost, triage | Errors, DLL hijacks, installers, boot |
| Wrong tool for | Real-time detection | History and automation | Continuous monitoring |
Putting them together: a real triage flow
Scenario: a user reports a console window that flashes at logon and the EDR flagged an unsigned binary.
- Step 1, Autoruns (where does it launch from?). Run with Hide Microsoft Entries and Verify Code Signatures. Find the unsigned entry under Logon or Scheduled Tasks, note the image path and the ASEP location. Right-click, Jump to Entry to confirm the raw registry value or task XML.
- Step 2, Process Explorer (is it alive, and what is it holding?). Find the process, check the parent, the command line, the Verified Signer column, and the VirusTotal hit ratio. Look at the handle pane for open files in odd places and named mutexes. Suspend it rather than Kill it if you want memory for later (
procdump64.exe -ma <PID>). - Step 3, Process Monitor (what does it touch?). Filter
Process Name is <binary>(or use the Process Tree PID filter to catch children), log off and back on, and review file writes, registry writes, network connects, and named pipe activity. - Step 4, remediate and verify. Remove the ASEP in Autoruns (uncheck first, delete once confirmed), delete the binary, reboot, and rerun Autoruns against the baseline
.arnwith File > Compare.
Lifecycle: are these tools still actively developed?
Short answer: yes, all three are actively maintained by Microsoft as of September 2026, and 2026 has been one of the busiest release years in the suite’s history. Microsoft acquired Sysinternals in 2006; Mark Russinovich still authors the tools, and releases are announced on the Sysinternals Blog on Microsoft Tech Community and on the “What’s New” feed on learn.microsoft.com/sysinternals.
| Tool | Current version (as of Sep 2026) | Recent notable changes |
|---|---|---|
| Autoruns | v14.3 (June 17, 2026) | v14.2 (May 2026) added Windows packaged apps (MSIX/AppX). v14.3 fully aligned autorunsc with the GUI, including packaged apps. |
| Process Explorer | v17.14 (September 10, 2026) | v17.0 dark theme and threads pane; 2026 releases added a parent PID column, Intel core-type info, and System Information dialog improvements. |
| Process Monitor | v4.1x (v4.1 on Aug 19, 2026; a bug-fix 4.11 followed in September) | v4.05 added Process Tree PID (ancestor) filtering; v4.1 added the IPC event class for named pipes and mailslots. |
Two lifecycle notes worth knowing:
- OS support is moving forward. Recent Process Explorer download pages list Windows 11 as the minimum client OS (Server 2016+ on the server side). If you still support Windows 10 endpoints after its end of support, keep an older known-good build in your IR kit and check the Runs on section of each download page before you upgrade.
- Linux siblings exist. Procmon for Linux (eBPF-based) and Sysmon for Linux live on GitHub under the Sysinternals org. There is no Linux Autoruns or Process Explorer.
Keeping them current
:: winget (IDs as published in the winget-pkgs repo; confirm with 'winget search sysinternals')
winget install --id Microsoft.Sysinternals.Autoruns -e
winget install --id Microsoft.Sysinternals.ProcessExplorer -e
winget install --id Microsoft.Sysinternals.ProcessMonitor -e
winget upgrade --all --include-unknown

:: Or run the latest build directly, no install, from Sysinternals Live
\\live.sysinternals.com\tools\procexp64.exe
The full Sysinternals Suite is also in the Microsoft Store, which auto-updates. For IR jump kits, pin versions: download the ZIPs, record SHA-256 hashes, and refresh the kit on a schedule instead of pulling from the internet on a compromised host.
Troubleshooting and gotchas
1. The drivers are a known attacker target
Process Explorer’s signed kernel driver has been abused in the wild (the Backstab tool and several “EDR killer” families) to terminate protected security processes. That is not a reason to avoid the tool, but it is a reason to (a) never leave the driver loaded on servers when you are done, (b) make sure your EDR alerts on the driver being loaded by anything other than the genuine procexp64.exe signed by Microsoft, and (c) consider Microsoft’s vulnerable driver blocklist and WDAC/HVCI policies.
:: Check whether a Sysinternals driver is currently loaded
driverquery /v | findstr /i "PROCEXP PROCMON"
fltmc filters
2. VirusTotal checks can leak data
Checking hashes is fine. Submit Unknown Executables uploads the actual file to VirusTotal, where it becomes available to other VirusTotal subscribers. Never enable uploads for internal or customer-built binaries.
3. Procmon ran the box out of memory
Symptom: the host becomes unresponsive a few minutes into a capture. Fix: always use /BackingFile on a volume with free space, set filters before capturing, enable Drop Filtered Events, and cap Options > History Depth. Kill a runaway capture from another session with Procmon64.exe /Terminate.
4. Closing handles and deleting ASEPs is not free
Closing a handle in Process Explorer from under a process can corrupt data or crash the app. Deleting an Autoruns entry is permanent. Default to uncheck in Autoruns and to stopping the owning process gracefully in Process Explorer.
Verdict
These are not competing tools, they are three lenses on the same machine. Autoruns tells you what is set up to run, Process Explorer tells you what is running and what it holds, and Process Monitor tells you exactly what happened. Reach for them in that order for security work, reverse the first two for performance work, and hand continuous monitoring off to Sysmon or your EDR. And since all three are still shipping updates in 2026, keep your copies current.
Recent posts
-

-

DNS is one of those technologies that quietly underpins... Full Story
-

BGP issues on FortiGate firewalls usually trace back to... Full Story
-

Every time your laptop talks to your router, a... Full Story
-

If you've spent any time configuring NAT on a... Full Story
-

If you have spent any time configuring firewall policies... Full Story
-

High availability on FortiGate is one of those features... Full Story
-

If you've configured SD-WAN on a FortiGate, you've almost... Full Story
-

FortiLink is the management protocol that turns a FortiSwitch... Full Story
-

FortiSwitches are pretty rock solid from Mean Time Between... Full Story
-

This is a quicky tip. Have you ever gone... Full Story
-

DNS is one of those quiet pieces of internet... Full Story
-

This article is an updated version of the previous... Full Story
-

You will add ns2 as a secondary (slave) BIND9... Full Story
-

In the process of deploying my lab, I needed... Full Story
-

RFC 8805, used to be known as Self-Correcting IP... Full Story
-

Years back, I wrote an article about certificate pinning. ... Full Story
-

FortiGates have the ability to send alerts to Microsoft... Full Story
-

In this post, I am going to walk through... Full Story
-

Troubleshooting VoIP on a FortiGate can feel like trying... Full Story
-

Prior to FortiOS 7.0, there were three commands to... Full Story
-

In this post, I am going to go over... Full Story
-

What we are going to do: We are going... Full Story
-

Choosing between FGCP (FortiGate Clustering Protocol) and FGSP (FortiGate... Full Story
-

Creating a VLAN on macOS (The "Pro" Move) A... Full Story
-

This blog post explores the logic behind how macOS... Full Story
-

Pretty Fly for a Wi-Fi Tell My Wi-Fi Love... Full Story
-

Part of my daily gig is creating BoMs (Bill-of-Materials)... Full Story
-

ICMP introduces several security risks, but careful filtering, rate... Full Story
-

The command diag debug application dhcps -1 enables full... Full Story
-

In the world of FortiOS, execute tac report is... Full Story
-

LLDP; What is it The Link Layer Discovery Protocol... Full Story
-

What it actually does When you run diagnose fdsm... Full Story
-

Monkey Bites are bite-sized, high-impact security insights designed for... Full Story
-

I have run macOS in macOS with Parallels but... Full Story
-

Don't be confused with my other FortiNAC posts where... Full Story
-

This is the third session in a multi-part article... Full Story
-

Today I was configuring key-based authentication on a FortiGate... Full Story
-

Netcat, often called the "Swiss Army knife" of networking,... Full Story
-

At its core, IEEE 802.1X is a network layer... Full Story
-

In case you did not see the previous FortiNAC... Full Story
-

This is our 5th session where we are going... Full Story
-

Now that we have Wireshark installed and somewhat configured,... Full Story
-

The Philosophy of Packet Analysis Troubleshooting isn't about looking... Full Story
-

Objective: Pick the right Sysinternals tool in the first... Full Story
-

I have been playing with all forms of grep... Full Story
-

Executive Summary If you typed egrep out of muscle... Full Story