If you've spent any time configuring user authentication on... Full Story
By Manny Fernandez
May 30, 2026
A Practical Guide to Ping: Your First Tool for Network Troubleshooting
When something on a network breaks, the first instinct of most engineers is to reach for ping. It is one of the oldest utilities in the networking toolbox, it ships with virtually every operating system, and it answers the single most important question in troubleshooting: can these two machines reach each other at all? This post walks through what ping does, how to read its output, and how to combine it with a few related tools to diagnose real problems.
What Ping Actually Does
Ping sends a small packet, called an ICMP Echo Request, to a target host and waits for the host to send back an ICMP Echo Reply. By measuring how long that round trip takes, and by counting how many replies come back, ping tells you two things: whether the destination is reachable, and how healthy the path to it is.
The name itself is a nod to sonar. A submarine sends out a sound pulse and listens for the echo to gauge distance and presence. Ping does the same thing with packets.
Because ICMP is a lightweight protocol that lives close to the network layer, ping bypasses most of the complexity of application traffic. That makes it a clean signal. If ping works but your website does not load, you have learned that the basic network path is fine and the problem lives higher up the stack.
Basic Usage
The simplest invocation is just the command followed by a hostname or IP address:
ping example.com
On Linux and macOS, ping runs continuously until you stop it with Ctrl+C. On Windows, it defaults to sending four packets and then stopping. You can target a hostname or a raw IP address. Targeting an IP address directly is a useful trick on its own, which we will return to later.
Reading the Output
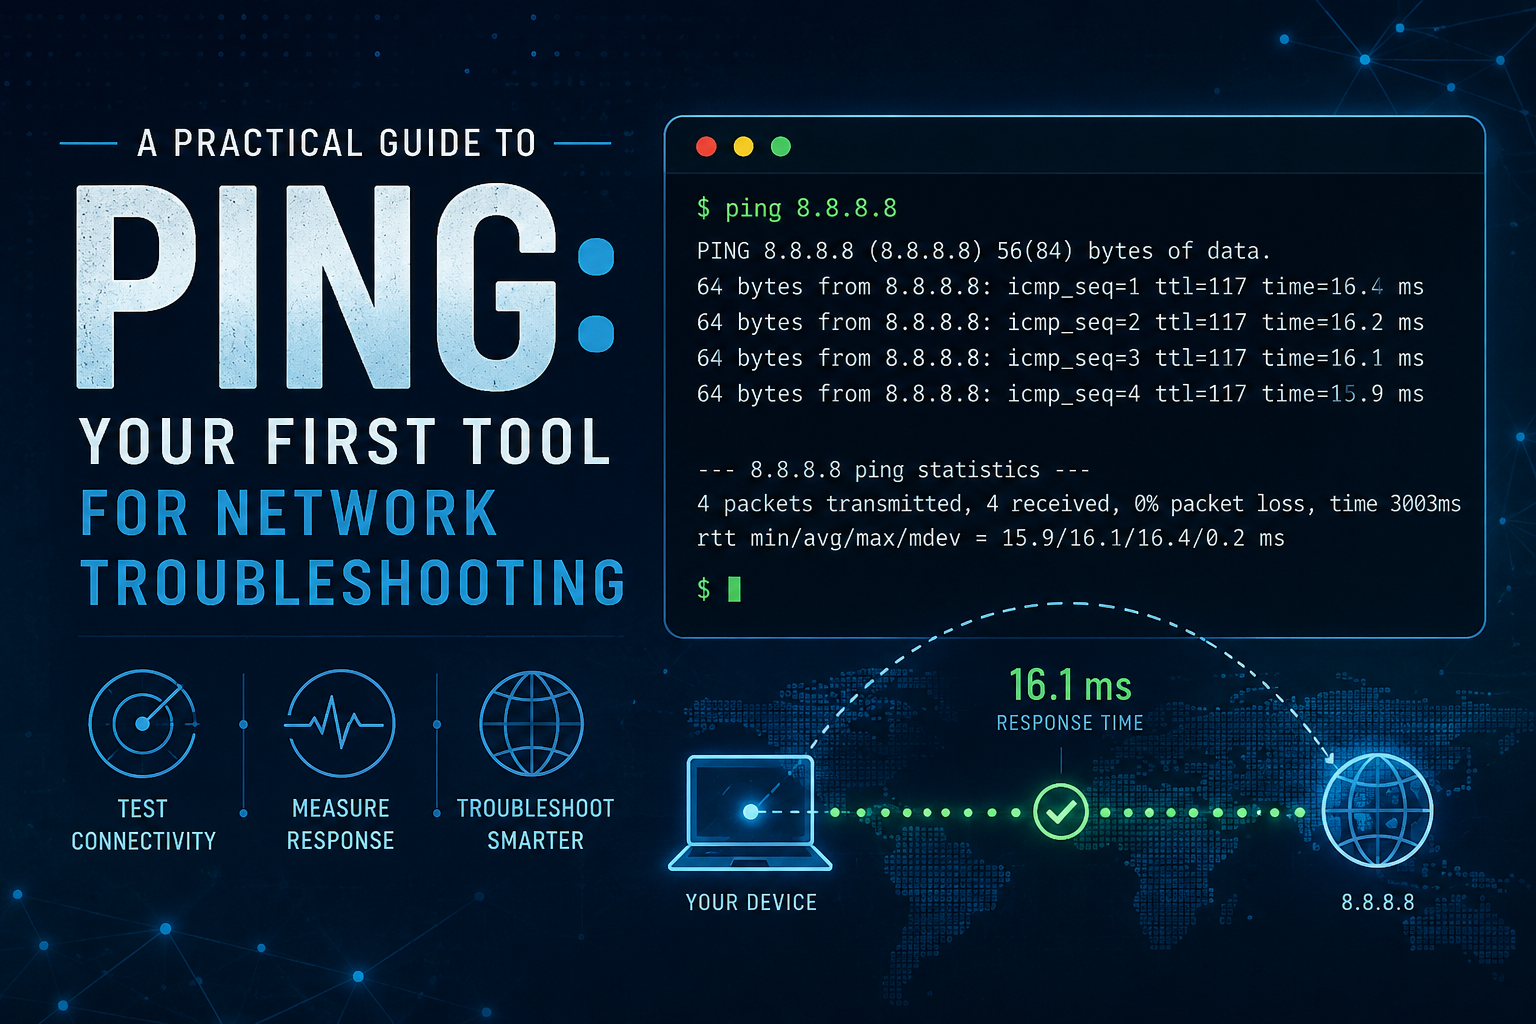
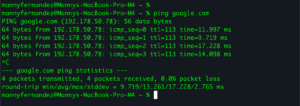
Here is a typical run on Linux:
PING example.com (93.184.216.34) 56(84) bytes of data.
64 bytes from 93.184.216.34: icmp_seq=1 ttl=56 time=11.6 ms
64 bytes from 93.184.216.34: icmp_seq=2 ttl=56 time=12.0 ms
64 bytes from 93.184.216.34: icmp_seq=3 ttl=56 time=11.4 ms
64 bytes from 93.184.216.34: icmp_seq=4 ttl=56 time=11.8 ms
^C
--- example.com ping statistics ---
4 packets transmitted, 4 received, 0% packet loss, time 3005ms
rtt min/avg/max/mdev = 11.412/11.700/12.043/0.241 ms
Each line and number is telling you something specific.
icmp_seq is the sequence number of each packet. It counts up by one for every request sent. If you see gaps in the sequence, for example numbers jumping from 4 to 6, that means a packet was lost in transit.
ttl stands for Time To Live. It starts at a fixed value on the destination host and is decremented by one at every router along the way. The value you see in the reply tells you how many hops were left when the packet arrived. By knowing common starting values (64 for Linux, 128 for Windows, 255 for many network devices), you can estimate both the number of hops and sometimes the operating system of the remote host. A reply with ttl=56 most likely started at 64 and crossed 8 routers.
time is the round trip time, the single most useful number ping gives you. It measures how long the request took to reach the destination and the reply to come back. Lower is better. On a local network this is often under 1 ms. To a server in another country it might be 100 ms or more.
The summary block at the bottom is where the real diagnosis happens. Packet loss is the headline figure. Zero percent is what you want. rtt min/avg/max/mdev breaks the timing down into the fastest reply, the average, the slowest, and the mean deviation. That last value, mdev, is a measure of jitter, or how much the latency varies. A low average with a high mdev means the connection is unstable even if it looks fast on average.
Interpreting Common Results
Different failure modes produce different output, and learning to recognize them is most of the skill.
Steady replies with low, consistent times. The path is healthy. If your application is still misbehaving, the problem is not basic connectivity.
Request timed out, or no reply at all. The packet went out and nothing came back. This can mean the host is down, a firewall is dropping ICMP, a router along the way has no route to the destination, or the host simply does not exist. Note that many servers and corporate networks deliberately block ICMP, so a timeout does not always mean the host is truly unreachable. It means ICMP specifically is not getting through.
Destination host unreachable. This is different from a timeout. Here a router is actively telling you it has no path to the destination. The reply is coming from an intermediate device, not silence. This usually points to a routing problem or a missing default gateway.
Intermittent loss, for example 30 percent packet loss. Some packets get through and some do not. This is often the most frustrating pattern and usually indicates congestion, a failing cable, wireless interference, or an overloaded router. Connections will feel slow and unreliable rather than fully broken.
High or wildly varying times. If average time is high but loss is zero, you have a slow but stable path, common over long distances or saturated links. If the times swing dramatically, you have jitter, which is especially damaging to voice and video calls.
Unknown host or name resolution failure. Ping never even sent a packet because it could not turn the hostname into an IP address. This is a DNS problem, not a connectivity problem.
Useful Options for Troubleshooting
A handful of flags turn ping from a simple yes-or-no test into a real diagnostic instrument. Flag syntax differs between operating systems, so both forms are noted below.
Limit the number of packets. Instead of pinging forever, send a fixed count. On Linux and macOS use -c, on Windows use -n.
ping -c 5 example.com
ping -n 5 example.com
Change the packet size. The default payload is small. Sending larger packets can expose problems that small packets hide, such as fragmentation issues or marginal hardware. On Linux use -s, on Windows use -l.
ping -s 1400 example.com
ping -l 1400 example.com
Set the do-not-fragment flag. Combined with a specific size, this is the classic way to discover the Maximum Transmission Unit, or MTU, of a path. If a packet is too large to pass without being fragmented and fragmentation is forbidden, ping will tell you. You shrink the size until packets get through, and that reveals the largest size the path supports. On Windows use -f, on Linux use -M do.
ping -M do -s 1472 example.com
ping -f -l 1472 example.com
Adjust the interval. By default ping waits about a second between packets. Speeding this up gives you a faster read on an intermittent problem, though sending packets very rapidly may require administrator privileges. Use -i on Linux.
ping -i 0.2 example.com
Flood mode. On Linux, running ping -f as root sends packets as fast as the network will carry them and prints a dot for each one, erasing a dot for each reply. It is a quick stress test of a link, but it should be used carefully and only on networks you own, because it generates significant traffic.
Set a timeout. This controls how long ping waits for each reply before giving up, which is handy in scripts. Use -W on Linux for the per-packet timeout.
A Step-by-Step Troubleshooting Approach
Ping is most powerful when used methodically, working outward from your own machine. The idea is to isolate where the failure occurs by testing progressively more distant targets.
Step one: ping your own loopback address.
ping 127.0.0.1
This packet never leaves your computer. If it fails, the problem is your local network stack or configuration, not the network at all. If it succeeds, your TCP/IP software is working.
Step two: ping your own IP address. This confirms your network interface is configured and active.
Step three: ping your default gateway. Your gateway is usually your router, often an address like 192.168.1.1. If you can reach it, your local network connection is good. If you cannot, the problem is between you and your router: a cable, a wireless issue, or a misconfigured address. You can find your gateway with ip route on Linux or ipconfig on Windows.
Step four: ping an external IP address directly. A reliable choice is a public DNS server such as 8.8.8.8. If this works, your connection to the wider internet is functioning. If it fails while the gateway succeeds, the problem is at your router or with your internet provider.
Step five: ping an external hostname.
ping example.com
This is the same test as step four but with one extra ingredient: DNS. If pinging 8.8.8.8 works but pinging a hostname fails, you have isolated the problem to DNS. Your connectivity is fine; your machine just cannot translate names into addresses. The fix lives in your DNS settings.
This sequence is the heart of ping-based troubleshooting. Each step that succeeds rules out a layer, and the first step that fails points directly at the culprit.
Where Ping Stops and Other Tools Begin
Ping tells you whether a path works and how good it is, but it does not tell you where along the path a problem sits. For that, two companion tools take over.
Traceroute (called tracert on Windows, traceroute on Linux and macOS) maps every router between you and a destination, showing the latency to each hop. If ping to a distant server shows high latency or loss, traceroute reveals which specific hop introduces it. It works by cleverly manipulating the TTL value, sending packets designed to expire at each successive router so that each one identifies itself.
traceroute example.com
tracert example.com
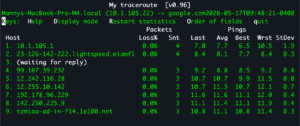
MTR (My Traceroute) combines ping and traceroute into one live, continuously updating display. It runs traceroute repeatedly and shows ongoing loss and latency statistics for every hop at once. For diagnosing intermittent problems, MTR is far more revealing than a single ping or a single traceroute, because it accumulates evidence over time.
mtr example.com
A practical workflow looks like this: use ping to confirm a problem exists and to gauge its severity, then use traceroute or MTR to locate exactly where on the path it occurs. Ping answers “is it broken and how badly,” and traceroute answers “where.”
To install on macOS, use Homebrew
brew install mtr
Note: on macOS, you are required to preface the command with sudo
Without the sudo command, you will get an error similar to this one…
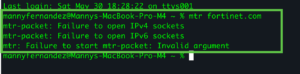
A few other tools fill remaining gaps. For DNS-specific issues, nslookup and dig test name resolution directly. For checking whether a specific service port is open, since ping only tests ICMP and not TCP, tools like nc (netcat), telnet, or PowerShell’s Test-NetConnection let you probe an actual port such as 443 for HTTPS or 22 for SSH.
A Few Closing Cautions
Ping is simple, but a few caveats are worth keeping in mind. A failed ping does not always mean a host is down, because ICMP is frequently filtered by firewalls and security policies. A successful ping does not guarantee that an application will work, because the service on that host could be down even while the machine answers ICMP. And ping measures the network path, not the server’s processing time, so a fast ping to a slow website points you away from the network and toward the application.
Used with those limits in mind, ping remains the fastest way to take the pulse of a network. Start local, work outward, watch the loss and timing figures, and hand off to traceroute and MTR when you need to know not just whether something is broken, but where.
Recent posts
-

-

DNS is one of those technologies that quietly underpins... Full Story
-

BGP issues on FortiGate firewalls usually trace back to... Full Story
-

Every time your laptop talks to your router, a... Full Story
-

If you've spent any time configuring NAT on a... Full Story
-

If you have spent any time configuring firewall policies... Full Story
-

High availability on FortiGate is one of those features... Full Story
-

If you've configured SD-WAN on a FortiGate, you've almost... Full Story
-

FortiLink is the management protocol that turns a FortiSwitch... Full Story
-

FortiSwitches are pretty rock solid from Mean Time Between... Full Story
-

This is a quicky tip. Have you ever gone... Full Story
-

DNS is one of those quiet pieces of internet... Full Story
-

This article is an updated version of the previous... Full Story
-

You will add ns2 as a secondary (slave) BIND9... Full Story
-

In the process of deploying my lab, I needed... Full Story
-

RFC 8805, used to be known as Self-Correcting IP... Full Story
-

Years back, I wrote an article about certificate pinning. ... Full Story
-

FortiGates have the ability to send alerts to Microsoft... Full Story
-

In this post, I am going to walk through... Full Story
-

Troubleshooting VoIP on a FortiGate can feel like trying... Full Story
-

Prior to FortiOS 7.0, there were three commands to... Full Story
-

In this post, I am going to go over... Full Story
-

What we are going to do: We are going... Full Story
-

Choosing between FGCP (FortiGate Clustering Protocol) and FGSP (FortiGate... Full Story
-

Creating a VLAN on macOS (The "Pro" Move) A... Full Story
-

This blog post explores the logic behind how macOS... Full Story
-

Pretty Fly for a Wi-Fi Tell My Wi-Fi Love... Full Story
-

Part of my daily gig is creating BoMs (Bill-of-Materials)... Full Story
-

ICMP introduces several security risks, but careful filtering, rate... Full Story
-

The command diag debug application dhcps -1 enables full... Full Story
-

In the world of FortiOS, execute tac report is... Full Story
-

LLDP; What is it The Link Layer Discovery Protocol... Full Story
-

What it actually does When you run diagnose fdsm... Full Story
-

Monkey Bites are bite-sized, high-impact security insights designed for... Full Story
-

I have run macOS in macOS with Parallels but... Full Story
-

Don't be confused with my other FortiNAC posts where... Full Story
-

This is the third session in a multi-part article... Full Story
-

Today I was configuring key-based authentication on a FortiGate... Full Story
-

Netcat, often called the "Swiss Army knife" of networking,... Full Story
-

At its core, IEEE 802.1X is a network layer... Full Story
-

In case you did not see the previous FortiNAC... Full Story
-

This is our 5th session where we are going... Full Story
-

Now that we have Wireshark installed and somewhat configured,... Full Story
-

The Philosophy of Packet Analysis Troubleshooting isn't about looking... Full Story
-

Overview FortiOS 8.0 introduces custom tags as a first-class... Full Story
-

These are two distinct mechanisms on FortiOS, and conflating... Full Story
-

Replacement messages are the pages and text blocks that... Full Story