If you've spent any time configuring user authentication on... Full Story
By Manny Fernandez
June 23, 2026
FortiGate Threat Weight Tracking A practitioner guide to risk scoring, configuration, and tuning in FortiOS 7.x and 8.x
1. What Threat Weight Tracking Is
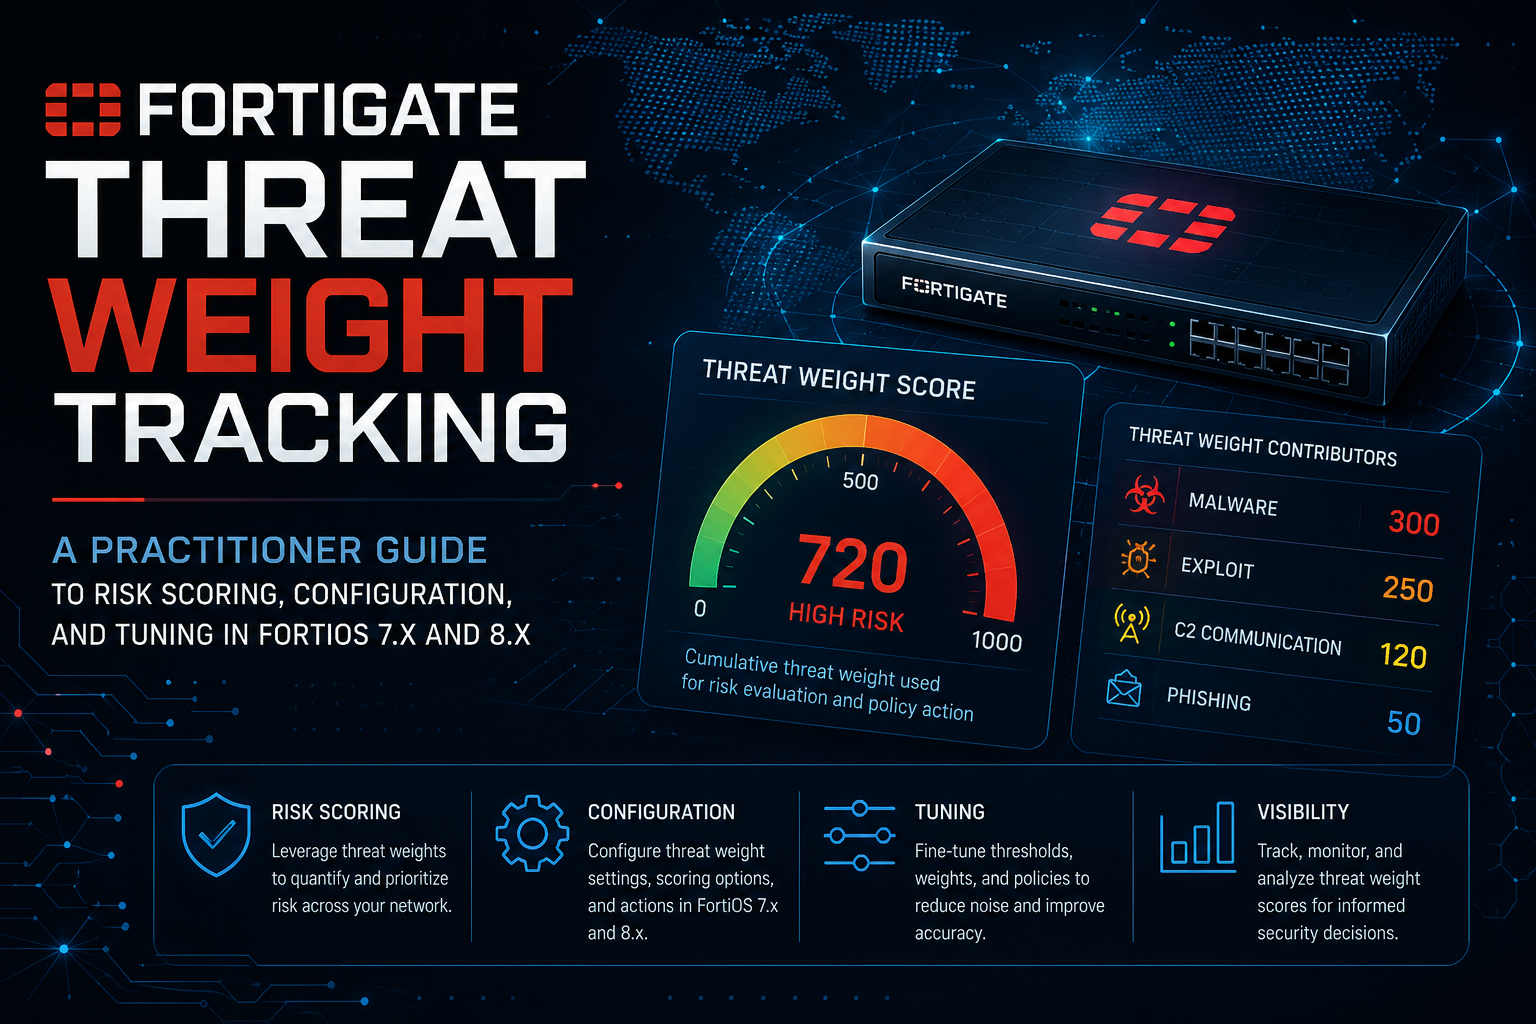
Threat Weight (sometimes called Threat Weight Tracking or Client Reputation in older code) is a scoring engine inside FortiOS that aggregates security events and assigns a numeric risk score so you can rank the riskiest sources, destinations, countries, and sessions on your network.
It does not block traffic on its own. It is a logging and visibility feature. The security inspection (AV, IPS, web filter, app control) still does the detecting and blocking. Threat Weight takes those detections, multiplies them by administrator-defined weights, and rolls them up into an aggregate score that drives the Top Threats FortiView dashboard and reporting.
When Threat Weight is active, FortiOS stamps three extra fields onto traffic logs:
| Field | Log key | Meaning |
| Threat level | crlevel |
The severity band (low, medium, high, critical) assigned to the event. |
| Threat score | crscore |
The numeric weight contribution from that event. |
| Threat action | craction |
A bitmask describing the threat type that triggered the score. |
Scores accumulate per source (and per destination, country, and session) over the logging window, and the Top Threats view sorts entities by total score.
2. Why It Matters in the Field
The value is triage. A busy FortiGate can generate thousands of UTM events per hour. Threat Weight turns that noise into a ranked list so an analyst can answer “which internal host is behaving worst right now” in one glance rather than grepping logs.
Typical use cases:
– Identifying the most compromised or risky internal endpoints for follow-up.
– Spotting a single source generating disproportionate IPS or botnet hits.
– Country and destination risk ranking for outbound traffic reviews.
– Feeding aggregate risk scores into QBR and executive reporting where raw event counts are too granular.
3. Prerequisites
Threat Weight only scores what your policies actually inspect. Before tuning weights, confirm the inputs exist:
1. UTM profiles are applied to the relevant firewall policies (antivirus, IPS, web filter, application control, DNS filter, email filter as applicable).
2. Logging is enabled on those policies (set logtraffic all or at minimum utm).
3. A log destination with enough retention exists (memory, disk, FortiAnalyzer, or FortiGate Cloud). Memory logging on small units is volatile and rotates fast, which truncates the scoring window.
4. The device has the Top Threats dashboard widget available if you want the GUI view.
If a category has no inspection profile generating logs, its weight is irrelevant because no events feed it.
4. Configuration: GUI
Threat Weight logging is enabled by default. To customize it:
1. Go to Log & Report > Threat Weight.
2. Adjust the per-category weights and the risk level values as needed.
3. Click Apply.
To view results, add the Top Threats monitor:
1. From the tree menu, open Dashboard and in the FortiView section click the + (Add Monitor).
2. In the Security section, enable Show More and select Top Threats.
3. Configure and click Add Monitor.
In the Top Threats view you can pivot by Sources, Destinations, Countries/Regions, or Sessions, and double-click an entry to drill into the underlying log details.
GUI menu visibility varies. If you do not see Log & Report > Threat Weight, the feature is still configurable from the CLI, and some trimmed GUI profiles hide it. The CLI is the authoritative interface.
5. Configuration: CLI
The full configuration tree lives under config log threat-weight. The structure is consistent across FortiOS 7.0, 7.2, 7.4, 7.6, and 8.0.
5.1 Top-level structure
config log threat-weight
set status{enable|disable}
set blocked-connection{disable|low|medium|high|critical}
set failed-connection{disable|low|medium|high|critical}
set url-block-detected{disable|low|medium|high|critical}
set botnet-connection-detected{disable|low|medium|high|critical}
config level
set low <integer>
set medium <integer>
set high <integer>
set critical <integer>
end
config ips
set info-severity{disable|low|medium|high|critical}
set low-severity{disable|low|medium|high|critical}
set medium-severity{disable|low|medium|high|critical}
set high-severity{disable|low|medium|high|critical}
set critical-severity{disable|low|medium|high|critical}
end
config web
edit <id>
set category <integer>
set level{disable|low|medium|high|critical}
next
end
config geolocation
edit <id>
set country <country-code>
set level{disable|low|medium|high|critical}
next
end
config application
edit <id>
set category <integer>
set level{disable|low|medium|high|critical}
next
end
config malware
set virus-infected{disable|low|medium|high|critical}
set virus-file-type-executable{disable|low|medium|high|critical}
set virus-outbreak-prevention{disable|low|medium|high|critical}
set botnet-connection{disable|low|medium|high|critical}
set malware-list{disable|low|medium|high|critical}
set ems-threat-feed{disable|low|medium|high|critical}
set fsa-malicious{disable|low|medium|high|critical}
set fsa-high-risk{disable|low|medium|high|critical}
set fsa-medium-risk{disable|low|medium|high|critical}
set content-disarm{disable|low|medium|high|critical}
set fortindr-malicious{disable|low|medium|high|critical}
set inline-block{disable|low|medium|high|critical}
end
end
The exact set of leaves under config malware grew across releases. Run set ? inside each subtable on your specific build to see what is available rather than assuming.
5.2 Understanding the two layers
There are two layers, and confusing them is the most common mistake:
1. The config level block defines the point value of each band. For example, low is worth 5 points, medium 10, high 30, critical 50. This is the score that a band contributes.
2. Every other setting maps a detection type to one of those bands. For example, “a critical-severity IPS hit is a high band event” or “a botnet connection is a critical band event.”
So tuning is a two-step exercise: set what each band is worth, then assign detection types to bands.
5.3 Worked example: aggressive internal endpoint scoring
Goal: make botnet and high-severity IPS hits dominate the Top Sources view, while down-weighting routine web blocks.
config log threat-weight
set status enable
config level
set low 5
set medium 10
set high 30
set critical 50
end
set botnet-connection-detected critical
set blocked-connection low
set url-block-detected low
config ips
set info-severity disable
set low-severity low
set medium-severity medium
set high-severity high
set critical-severity critical
end
config malware
set virus-infected high
set botnet-connection critical
set virus-outbreak-prevention high
end
end
After this, a host with two botnet detections scores 100 from those alone (2 x 50), which will float it to the top of the Sources list regardless of how many low-value URL blocks a different host accumulates.
5.4 Web category example
To score traffic to a specific web filter category, reference the category ID:
config log threat-weight
config web
edit 1
set category 26
set level high
next
end
end
Category IDs come from the FortiGuard web filter category list. Confirm the ID on your build with config webfilter profile references or the FortiGuard category table, because numbering must match what the web filter engine actually logs.
5.5 Geolocation example
config log threat-weight
config geolocation
edit 1
set country "KP"
set level critical
next
edit 2
set country "RU"
set level high
next
end
end
Country codes are ISO two-letter codes. Geolocation scoring only fires when the matched session is logged, so the originating policy still needs traffic logging.
5.6 Verifying the configuration
show log threat-weight
get log threat-weight
diagnose sys session list# confirm sessions are being logged
To confirm the fields are landing in logs, inspect a traffic log entry and look for crscore, crlevel, and craction.
6. Best Practices
1. Start from defaults, change one thing at a time. The default weights are sane. Make a single category change, watch the Top Threats view for a day, then iterate. Wholesale rewrites make it impossible to tell what moved the needle.
2. Anchor your band values with headroom. Leave gaps between low, medium, high, and critical (for example 5 / 10 / 30 / 50, not 1 / 2 / 3 / 4). Wide gaps ensure a single critical event outranks a flood of low events, which is usually what you want for triage.
3. Disable noise sources. Informational IPS severity and routine URL blocks generate enormous volume. Set info-severity disable and keep url-block-detected low or disabled so they do not bury real threats.
4. Treat botnet and malware as critical. Outbound botnet connections and confirmed virus infections are the highest-signal indicators of an already-compromised host. Weight them so they always surface.
5. Pair Threat Weight with FortiAnalyzer for the real value. On-box memory and disk windows are short. FortiAnalyzer aggregates crscore across time and across multiple FortiGates, which is where the scoring becomes genuinely useful for hunting and reporting.
6. Document your weights. Custom weighting is invisible to the next analyst. Keep the show log threat-weight output in your run-book so scores are interpretable later.
7. Re-baseline after major UTM changes. Turning on a new IPS sensor or web filter profile changes the event mix, which shifts scores. Revisit weights after any significant security profile change.
7. Gotchas
1. It scores, it does not block. The single most common misunderstanding. A high Threat Weight score does not stop traffic. If you want enforcement, that comes from the UTM profiles and policies, or from automation stitches triggered on the logs, not from Threat Weight itself.
2. No logs, no score. If a policy is not logging, the events feeding Threat Weight never exist. A “clean” Top Threats view can mean a quiet network or it can mean logging is off. Verify logging before trusting the silence.
3. Memory logging truncates the window. On smaller models logging to memory, the buffer rotates quickly and scores reset, so a host that misbehaved an hour ago may have vanished from the list.
4. Category IDs drift. Web and application category IDs reference FortiGuard tables. If you hard-code an ID that does not match what the inspection engine logs, the weight silently never applies. Always validate the ID against the live build.
5. craction is a bitmask, not a label. When parsing logs in a SIEM, do not treat craction as a single readable value. It encodes threat type as a bitmask and needs decoding against the FortiOS log reference for your version.
6. GUI may hide the menu. Depending on feature visibility settings and platform, Log & Report > Threat Weight may not appear in the GUI even though it is fully active. Do not assume it is off because the menu is missing.
7. Per-VDOM, not global. Threat Weight configuration is scoped to the VDOM. In multi-VDOM deployments you tune each VDOM independently, and scores do not aggregate across VDOMs on the box.
8. Limitations
1. Visibility feature only. Threat Weight produces scores and dashboards. It is not an enforcement, quarantine, or response mechanism by itself.
2. Local scoring window. On-box aggregation is bounded by log storage. Long-horizon trending requires FortiAnalyzer or another external collector.
3. Administrator-defined, not adaptive. Weights are static values you set. The engine does not learn or auto-tune based on environment behavior; it applies exactly the numbers you configure.
4. Bounded to FortiGate-observed events. It can only score what this FortiGate inspects and logs. Threats that bypass the box, or that are seen only by other sensors, do not contribute.
5. No cross-entity correlation. It ranks sources, destinations, countries, and sessions independently. It does not build an attack narrative linking a source to a destination to a technique; that correlation belongs to FortiAnalyzer, FortiSIEM, or a SOC platform.
6. Coarse severity model. Everything collapses into four bands. Two very different high-severity events in the same band contribute identically, which can flatten nuance.
9. Version Notes: FortiOS 7.x to 8.x
The core model (status, level block, per-category band assignment, and the crscore / crlevel / craction log fields) is stable and consistent from 7.0 through 8.0. The practical differences across releases are additive rather than structural:
– The config malware subtable expanded over time to include newer detection sources such as EMS threat feeds, FortiSandbox verdict tiers, content disarm (CDR), and FortiNDR malicious verdicts. Earlier 7.0 builds expose fewer leaves than 7.4, 7.6, and 8.0.
– Default band values and default category-to-band mappings have been adjusted between releases, so a config migrated from an older version may not match the newer defaults. Review show log threat-weight after an upgrade.
– Top Threats FortiView placement and labeling shifted between 7.0, 7.2, and later GUIs, but the underlying data source is the same scoring engine.
Practical rule: the commands you script against config log threat-weight will carry forward across 7.x and 8.x, but always run set ? on the target build to enumerate the malware and category leaves available there, and re-check defaults after any major upgrade.
10. Quick Reference
| Task | Command or path |
| Enter config | config log threat-weight |
| Enable | set status enable |
| Set band values | config level then set low/medium/high/critical <int> |
| Map IPS severities | config ips then set <severity> <band> |
| Score botnet | set botnet-connection-detected critical |
| Score a web category | config web / edit <id> / set category <id> / set level <band> |
| Score a country | config geolocation / edit <id> / set country <cc> / set level <band> |
| Review config | show log threat-weight |
| View results | Dashboard > Top Threats (FortiView) |
| Log fields to parse | crscore, crlevel, craction |
How It Works
Threat Weight functions like a credit score system, but for risk. You define how many “points” a security event is worth, and FortiOS tallies them up per client.
* Risk Level Assignment: Security events are categorized into four standard risk levels: Low, Medium, High, and Critical. You can customize the exact numerical weight or score modifier associated with each level.
* Cross-Profile Tracking: The tracking covers an array of security vectors:
* Malware/Antivirus: Triggers for blocked malware, botnet connections, or FortiSandbox detections.
* Web Activity: Visiting blocked URLs, high-risk URL categories, or malicious sites.
* Intrusion Prevention (IPS): The severity level of specific network attacks targeted at or coming from the host.
* Application Control: Usage of risky applications (e.g., unauthorized P2P software or proxy bypass tools).
* Packet-Based Inspection: Accumulating points for excessive failed connection attempts or traffic repeatedly dropping against firewall policies.
An Illustrative Scenario
Consider how a host’s score accumulates over a short window:
Host (192.168.1.50) Activity: Visits an unrated/risky website --> Web Filter adds10points (Low) Attempts an unauthorized SSH login --> IPS adds30points (Medium) Triggers a blocked botnet callback --> Malware Protection adds50points (Critical) ==================================================================================== Total Threat Score:90
Even though the firewall successfully blocked individual events (like the botnet callback), the fact that one specific endpoint triggered all three actions signals to an administrator that the host is highly likely to be compromised.
Why Use It?
1. Identifying “Quiet” Hazards
A single blocked download or a dropped packet won’t always trigger a critical system alert. Threat Weight helps bubble up low-level, repetitive anomalous activity that might otherwise stay buried in dense log volumes.
2. Streamlining Incident Response
Instead of hunting through separate logs for individual IPS, AV, or Web Filtering alerts, administrators can look at FortiView (such as the Threat Map or Compromised Hosts console) to see immediately which local IPs have the highest threat scores.
3. Driving Automation (Security Fabric Integration)
When combined with the wider Fortinet Security Fabric, crossing a specific Threat Weight threshold can trigger automated stitches. For example, if a client’s score exceeds 100, the fabric can instruct FortiClient EMS to quarantine the endpoint, or signal a FortiSwitch to move the host port into an isolated VLAN until it can be remediated.
Administrative Note: Turning on Threat Weight Tracking automatically ensures that Log Allowed Traffic is tracking across policies to accurately measure client trends. This can cause a slight increase in log generation, so ensuring your FortiAnalyzer or logging solution is sized accordingly is best practice.
Recent posts
-

-

DNS is one of those technologies that quietly underpins... Full Story
-

BGP issues on FortiGate firewalls usually trace back to... Full Story
-

Every time your laptop talks to your router, a... Full Story
-

If you've spent any time configuring NAT on a... Full Story
-

If you have spent any time configuring firewall policies... Full Story
-

High availability on FortiGate is one of those features... Full Story
-

If you've configured SD-WAN on a FortiGate, you've almost... Full Story
-

FortiLink is the management protocol that turns a FortiSwitch... Full Story
-

FortiSwitches are pretty rock solid from Mean Time Between... Full Story
-

This is a quicky tip. Have you ever gone... Full Story
-

DNS is one of those quiet pieces of internet... Full Story
-

This article is an updated version of the previous... Full Story
-

You will add ns2 as a secondary (slave) BIND9... Full Story
-

In the process of deploying my lab, I needed... Full Story
-

RFC 8805, used to be known as Self-Correcting IP... Full Story
-

Years back, I wrote an article about certificate pinning. ... Full Story
-

FortiGates have the ability to send alerts to Microsoft... Full Story
-

In this post, I am going to walk through... Full Story
-

Troubleshooting VoIP on a FortiGate can feel like trying... Full Story
-

Prior to FortiOS 7.0, there were three commands to... Full Story
-

In this post, I am going to go over... Full Story
-

What we are going to do: We are going... Full Story
-

Choosing between FGCP (FortiGate Clustering Protocol) and FGSP (FortiGate... Full Story
-

Creating a VLAN on macOS (The "Pro" Move) A... Full Story
-

This blog post explores the logic behind how macOS... Full Story
-

Pretty Fly for a Wi-Fi Tell My Wi-Fi Love... Full Story
-

Part of my daily gig is creating BoMs (Bill-of-Materials)... Full Story
-

ICMP introduces several security risks, but careful filtering, rate... Full Story
-

The command diag debug application dhcps -1 enables full... Full Story
-

In the world of FortiOS, execute tac report is... Full Story
-

LLDP; What is it The Link Layer Discovery Protocol... Full Story
-

What it actually does When you run diagnose fdsm... Full Story
-

Monkey Bites are bite-sized, high-impact security insights designed for... Full Story
-

I have run macOS in macOS with Parallels but... Full Story
-

Don't be confused with my other FortiNAC posts where... Full Story
-

This is the third session in a multi-part article... Full Story
-

Today I was configuring key-based authentication on a FortiGate... Full Story
-

Netcat, often called the "Swiss Army knife" of networking,... Full Story
-

At its core, IEEE 802.1X is a network layer... Full Story
-

In case you did not see the previous FortiNAC... Full Story
-

This is our 5th session where we are going... Full Story
-

Now that we have Wireshark installed and somewhat configured,... Full Story
-

The Philosophy of Packet Analysis Troubleshooting isn't about looking... Full Story
-

A vendor-neutral deep dive into the control plane and... Full Story
-

If you have ever dug through a drawer full... Full Story
-

In this article, I will cover the basic AC... Full Story