
If you've spent any time configuring user authentication on... Full Story
By Manny Fernandez
July 14, 2026
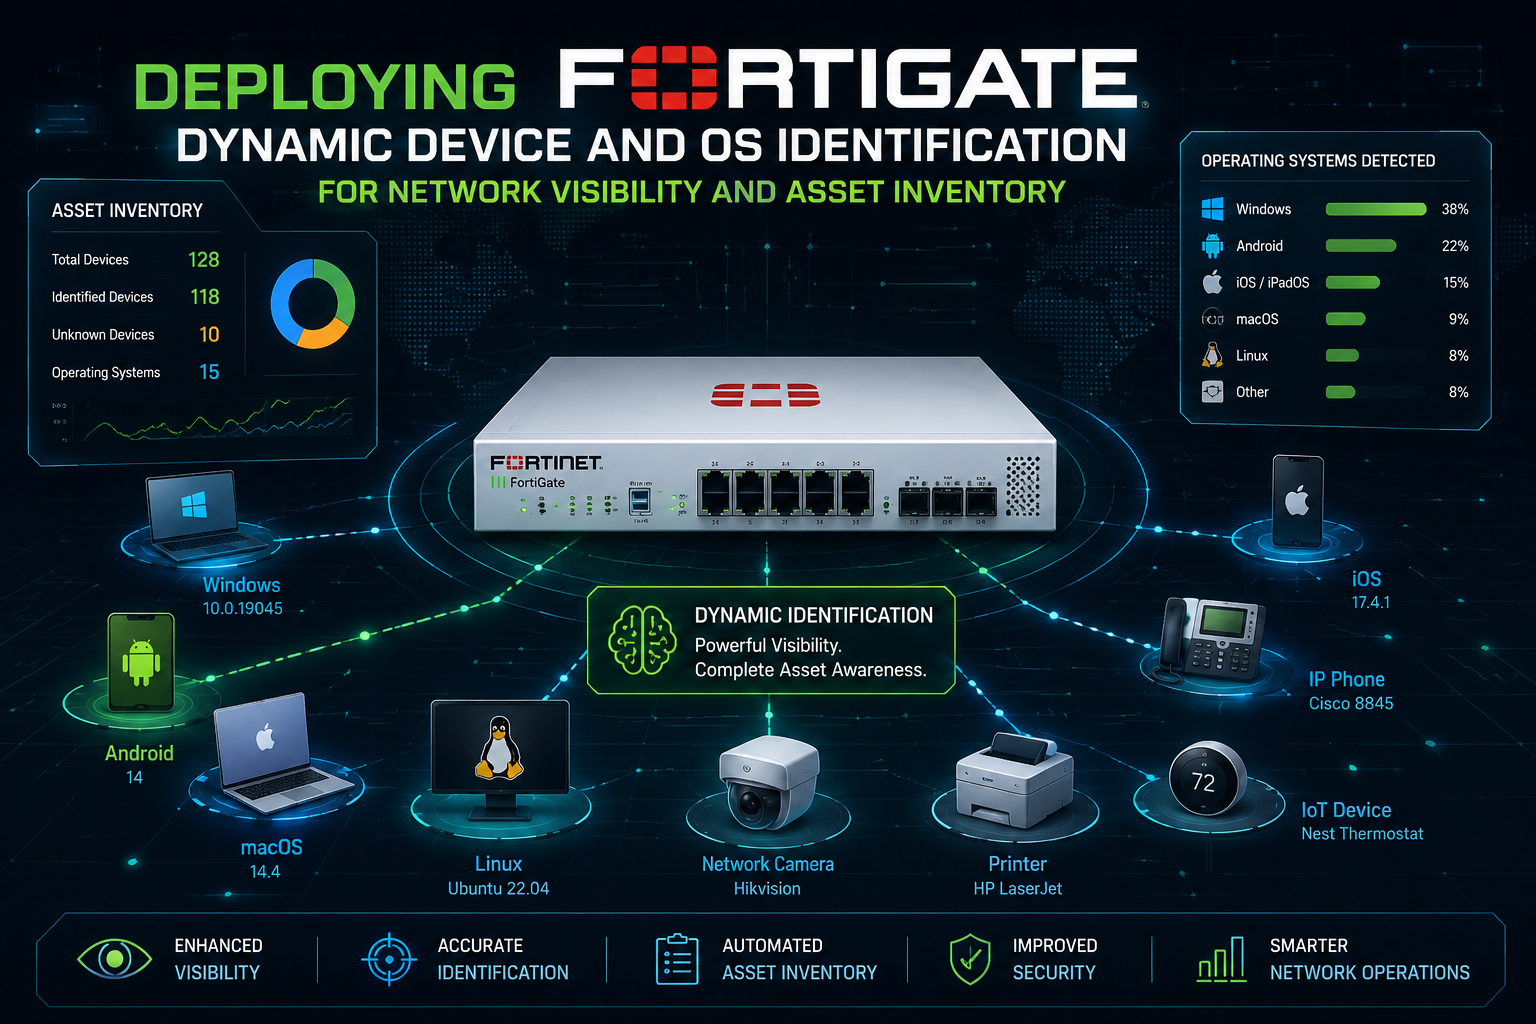
Deploying FortiGate Dynamic Device and OS Identification for Network Visibility and Asset Inventory
1. Executive Summary
Objective: This guide walks through enabling and operationalizing FortiGate’s Dynamic Device and OS Identification (device detection) so the firewall passively builds a live inventory of every host on your LAN, including MAC, IP, operating system, hostname, vendor, and logged-in user. You will configure it on the right interfaces, validate it from both the GUI and CLI, consume the data in the Asset Identity Center, and turn detected devices into MAC-based policy objects.
This matters because device detection is the foundation layer for ZTNA posture, IoT/OT visibility, dynamic MAC-based policy, and security rating. Most teams enable it on one interface, see a table populate, and stop. The value is in knowing what it can and cannot see, where it stores state, and how to verify it when the inventory looks wrong.
Target Audience: Network and security engineers, FortiGate administrators, and SOC/NOC analysts who own a FortiGate fleet and need accurate, automatic asset inventory without deploying a separate NAC product on day one.
2. Prerequisites and Architecture
Assumed Knowledge
You should be comfortable with the FortiOS GUI and CLI, the difference between an interface role (LAN/WAN/DMZ/Undefined) and zones, basic firewall policy construction, and the idea of a Layer 2 broadcast domain. Familiarity with DHCP, ARP, and HTTP User-Agent strings helps you reason about how passive detection works.
How Detection Actually Works
Device detection is passive. The FortiGate inspects traffic it already sees on an enabled interface and fingerprints the source host. It does not actively probe by default. Common passive signals include MAC OUI (vendor) lookups, DHCP option fingerprinting, HTTP User-Agent strings, TCP/IP stack characteristics, and LLDP/CDP. It can also ingest richer data from FortiClient/FortiClient EMS, managed FortiSwitch and FortiAP, and FortiGuard device signatures.
Two consequences fall directly out of “passive”:
– The FortiGate must be in the traffic path for the host (typically the default gateway or an inter-VLAN router). A device that only talks within its own L2 segment and never crosses the FortiGate may never be fingerprinted, or may show up with partial data.
– On a WAN interface, sources are usually behind NAT and far away, so the OS frequently cannot be determined. Detection is designed for directly connected LAN and DMZ ports.
Version note (active scanning): Older FortiOS (6.x) offered active scanning to probe hosts that could not be identified passively. Active scanning was removed starting in 7.0. On 7.x and 8.0, treat device detection as passive only.
Environment and Lab Requirements
| Requirement | Detail |
| FortiGate platform | Physical or VM. Models below the 200 series have limited memory for the device database (see Gotchas). |
| FortiOS version | 7.4.x, 7.6.x, or 8.0.x recommended. CLI is consistent back to 6.2.1; the GUI consumption page differs by version. |
| Licensing (base feature) | None. Core device and OS identification works with no add-on license. |
| Licensing (IoT vulnerabilities) | Attack Surface Security Rating service license (called IoT Detection Service on 7.4) to populate IoT/OT vulnerability data. |
| Licensing (OT Purdue mapping) | FortiGuard Industrial Security Service (ISS) license for the Industrial Database (ISDB) used by OT View and default-purdue-level. |
| Test endpoints | At least 2 to 3 hosts on the target LAN segment with distinct OSes (for example Windows, Linux, an Android/iOS phone) to validate OS fingerprinting. |
| Optional fabric inputs | A managed FortiSwitch and/or FortiAP to validate L2 edge detection and LLDP enrichment. |
Component Table
| Component | Role | Example value |
| FortiGate (FGT-EDGE-01) | Performs passive detection, stores the device DB, hosts Asset Identity Center | 10.10.0.1 |
| LAN interface | Interface where device-identification is enabled | port3 / role LAN / 10.10.10.1/24 |
| Detection daemon | Builds and maintains the in-memory device DB | cid (7.2+), src-vis (pre-7.2) |
| Managed FortiSwitch (optional) | Edge L2 detection, LLDP enrichment | S148-FSW-01 |
| Test endpoint A | Windows host for OS fingerprint validation | 10.10.10.50 |
| Test endpoint B | Linux host for OS fingerprint validation | 10.10.10.51 |
3. Step-by-Step Implementation Workflow
Phase 1: Enable Device Detection on the LAN Interface
The Goal: Turn on passive detection for the interface that serves the segment you want inventoried.
The Action: Choose a directly connected LAN or DMZ interface with the role set to LAN, DMZ, or Undefined. Do not start with a WAN interface, and do not start with a high-density Wi-Fi or guest interface (see Gotchas for why).
The Code/CLI:
config system interface
edit "port3"
set device-identification enable
next
end
To confirm the current state of an interface:
show system interface port3 | grep device-identification
GUI Verification: Go to Network > Interfaces, edit the interface, and confirm Device Detection is enabled under the Networked Devices (or Administrative Access / interface settings) section. The toggle maps one-to-one to the device-identification CLI setting.
Phase 2: Confirm the Detection Daemon Is Running
The Goal: Verify the process responsible for building the device database is alive before you expect data.
The Action: Identify and check the detection daemon. The daemon name changed across versions, so check the one that matches your build.
The Code/CLI:
diagnose sys top-summary | grep -i cid
On FortiOS 7.2 and later the daemon is cid (Client Identification daemon). On releases before 7.2 it is src-vis. If the process is missing or repeatedly restarting, that is your first signal that the inventory will be empty or stale regardless of interface configuration.
GUI Verification: No direct GUI element exposes the daemon. Proceed to Phase 4 to confirm data is flowing.
Phase 3 (Optional): Enable Detection Across Managed FortiSwitch and FortiAP
The Goal: Push detection to the access edge so devices are identified at the switch port or AP, and enrich the database with LLDP data (for example VoIP phones advertising themselves).
The Action: When endpoints connect through a managed FortiSwitch, the FortiGate needs the switch to synchronize device data on a non-zero interval. The default data-sync-interval of 0 disables this sync, which is the single most common reason FortiSwitch-attached devices never appear.
The Code/CLI:
config switch-controller system
set data-sync-interval 60
end
Set the interval (in seconds, valid range 30 to 1800) to a value that balances freshness against control-plane load. Sixty seconds is a reasonable starting point.
GUI Verification: After the interval elapses, devices attached to FortiSwitch ports should begin appearing in the Asset Identity Center with their FortiSwitch and port columns populated. LLDP-capable devices (such as FortiFone or third-party IP phones) will show enriched type and family data.
Phase 4: Consume the Inventory in the Asset Identity Center
The Goal: View the live inventory, including detected OS, and confirm the feature is producing usable data.
The Action: Open the consumption page. The location depends on your FortiOS version.
| FortiOS version | Where to view detected devices |
| 7.4.2+, 7.6.x, 8.0.x | Security Fabric > Asset Identity Center (Asset view groups by device, Identity view groups by user) |
| 7.0.x to early 7.4 | Security Fabric > Asset Identity Center (table-centric layout) |
| 6.2 / 6.4 | Dashboard > Users & Devices (legacy Device Inventory widget) |
In the Asset view you get donut charts for Software OS, Vulnerability Level, Status, and Interface, plus a device table. The default columns include Device, Software OS, Address, User, FortiClient User, Vulnerabilities, Status, and Endpoint Tags. Optional columns (Device Family, Device Type, Hardware Vendor, Hostname, FortiSwitch, and more) are available through the table’s column configuration (gear icon).
The Code/CLI (equivalent view from the shell):
diagnose user device list
This prints each detected host with its MAC, IP, detected OS, hostname, the interface it was seen on, and last-seen timing.
GUI Verification: You have success when the Asset list shows your test endpoints with a recognizable Software OS value (for example “Windows 11” or a Linux variant) and the correct source interface. Newly connected hosts may take a short time to fingerprint; force traffic from the host (open a browser, renew DHCP) to accelerate detection.
Phase 5: Turn Detected Devices into MAC-Based Policy Objects
The Goal: Use the inventory operationally by pinning a known device to policy via its MAC address, independent of the IP it receives.
The Action: Since 6.2.1, device-based control is handled through MAC address objects rather than a separate device list. Create a Device (MAC Address) address object and reference it in a firewall policy.
The Code/CLI:
config firewall address
edit "PRINTER-HR-FLOOR2"
set type mac
set macaddr "aa:bb:cc:dd:ee:ff"
next
end
Then reference it as the source (or destination) in a policy:
config firewall policy
edit 0
set name "HR-Printer-Egress"
set srcintf "port3"
set dstintf "port1"
set srcaddr "PRINTER-HR-FLOOR2"
set dstaddr "all"
set action accept
set schedule "always"
set service "ALL"
next
end
GUI Verification: Go to Policy & Objects > Addresses, click Create New > Address, set Type to Device (MAC Address), and enter the MAC. The object then appears in the source/destination selectors when building a policy under Policy & Objects > Firewall Policy.
Phase 6 (Optional, License-Gated): IoT and OT Identification with Purdue Levels
The Goal: Extend identification to IoT/OT assets and map them to Purdue model levels for industrial environments.
The Action: This layer requires the appropriate FortiGuard license and an application control sensor in the inspecting policy. Device detection must be enabled on the LAN interface that serves the IoT/OT devices.
The Code/CLI (set a default Purdue level per interface, 7.4+):
config system interface
edit "port4"
set device-identification enable
set default-purdue-level 3
next
end
Valid default-purdue-level values are 1, 1.5, 2, 2.5, 3, 3.5, 4, 5, and 5.5. The default is 3. A manual override on an individual device in the GUI always takes precedence over the interface default.
GUI Verification: Confirm a valid license is active (Attack Surface Security Rating / IoT Detection Service for vulnerabilities, Industrial Security Service for OT). In Security Fabric > Asset Identity Center, the OT View tab renders a topology mapped to Purdue levels. FortiGates and managed FortiSwitches are statically pinned to Level 2; other detected devices default to Level 3 and can be dragged to other levels when the view is unlocked. Hovering the Vulnerabilities count on a device opens the IoT/OT vulnerability table with CVE references.
4. Verification and Validation
Work through these checks in order. Each one isolates a different layer of the pipeline.
1. Confirm the interface setting is committed.
show system interface port3 | grep device-identification
Expected: set device-identification enable. If this line is absent, the setting did not save.
2. Confirm the database has entries and is counting.
diagnose user device stats
Expected: non-zero device counts. A flat zero here, with traffic flowing on the interface, points to a daemon or traffic-path problem rather than a config problem.
3. List the detected devices and inspect OS attribution.
diagnose user device list
Expected: one block per host showing MAC, IP, detected OS, hostname, and the interface. This is your ground truth. If the GUI looks wrong but this looks right, the issue is display/refresh, not detection.
4. Inspect the in-memory device store directly.
diagnose user-device-store device memory list
Expected: detailed records including ipv4_address, mac, hardware_vendor, hardware_type, and hardware_family. On licensed units, IoT records add fields like iot_info (vendor/product/version) and iot_vulnerability entries.
5. Query the unified user/device store (7.0+).
diagnose user-device-store unified device-query
diagnose user-device-store unified user-query
diagnose user-device-store unified list
Expected: the unified data structure that the Asset Identity Center renders. Useful when the GUI and diagnose user device list disagree.
What success looks like: Your test endpoints appear in Security Fabric > Asset Identity Center with correct Software OS, correct source interface, a recent Last Seen, and matching records under diagnose user device list. MAC-based address objects you created resolve to the right hosts in policy.
5. Troubleshooting and Gotchas
Gotcha 1: Detection Enabled on Wi-Fi, Guest, or Low-End Hardware, and the Database Balloons
The device database lives in FortiGate memory. On high-churn interfaces (large Wi-Fi or guest SSIDs with constant client turnover) the table can grow very large, and on platforms below the 200 series memory is tight. This shows up as memory pressure or conserve mode rather than an obvious “detection” error.
– Diagnose: Check database size and system memory.
diagnose user device stats
diagnose hardware sysinfo memory
– Resolution: Do not enable device-identification on busy guest or Wi-Fi interfaces. Scope detection to the LAN segments where you actually need inventory. On constrained hardware, enable it selectively rather than fleet-wide.
Gotcha 2: OS Shows as Unknown or Devices Are Missing on a WAN Interface
Passive detection needs to see local, fingerprintable traffic. Across a WAN, sources are typically behind NAT and the OS cannot be determined, which is by design. The Device Detection toggle is not even offered when an interface role is set to WAN.
– Diagnose: Confirm the interface role and that the FortiGate is the host’s gateway.
show system interface <name> | grep role
diagnose user device list
– Resolution: Enable detection on the directly connected LAN/DMZ interface that is the host’s default gateway, not on the transit/WAN side. If a segment routes through the FortiGate but devices still do not appear, verify the hosts are actually generating traffic that crosses the firewall (intra-VLAN-only chatter is invisible to it).
Gotcha 3: FortiSwitch-Attached Devices Never Appear
When endpoints connect through a managed FortiSwitch, device data only flows up to the FortiGate if data-sync-interval is non-zero. The default is 0, which silently disables the sync, so the inventory looks empty for every switch-attached host even though detection is “enabled.”
– Diagnose: Check the sync interval.
show switch-controller system | grep data-sync-interval
– Resolution: Set a non-zero interval (30 to 1800 seconds).
config switch-controller system
set data-sync-interval 60
end
Gotcha 4: GUI and CLI Disagree, or the Inventory Looks Stale
If the Asset Identity Center is blank or wrong but the CLI shows correct data (or vice versa), the rendering layer (WAD’s user-device-store context) may need to be inspected.
– Diagnose: Enter the WAD user-info context and dump store stats. The application ID differs by version.
diagnose debug enable
diagnose test application wad 2500# switch to wad-user-info context
diagnose test application wad 168# store stats dump on 7.0
diagnose test application wad 178# store stats dump on 7.2 / 7.4
diagnose test application wad 2000# switch back to WAD manager context
– Resolution: When finished, always clear the debug session so you do not leave verbose logging running.
diagnose debug disable
diagnose debug reset
Gotcha 5: A Single Physical Device Shows as Multiple Entries
A host with several NICs (or a device seen across multiple interfaces) can appear as separate inventory entries. FortiOS allows you to manually consolidate these into one device record so reporting and policy treat it as a single asset. Do this from the Asset Identity Center device actions, then re-validate with diagnose user device list.
Recent posts
-

-

DNS is one of those technologies that quietly underpins... Full Story
-

BGP issues on FortiGate firewalls usually trace back to... Full Story
-

Every time your laptop talks to your router, a... Full Story
-

If you've spent any time configuring NAT on a... Full Story
-

If you have spent any time configuring firewall policies... Full Story
-

High availability on FortiGate is one of those features... Full Story
-

If you've configured SD-WAN on a FortiGate, you've almost... Full Story
-

FortiLink is the management protocol that turns a FortiSwitch... Full Story
-

FortiSwitches are pretty rock solid from Mean Time Between... Full Story
-

This is a quicky tip. Have you ever gone... Full Story
-

DNS is one of those quiet pieces of internet... Full Story
-

This article is an updated version of the previous... Full Story
-

You will add ns2 as a secondary (slave) BIND9... Full Story
-

In the process of deploying my lab, I needed... Full Story
-

RFC 8805, used to be known as Self-Correcting IP... Full Story
-

Years back, I wrote an article about certificate pinning. ... Full Story
-

FortiGates have the ability to send alerts to Microsoft... Full Story
-

In this post, I am going to walk through... Full Story
-

Troubleshooting VoIP on a FortiGate can feel like trying... Full Story
-

Prior to FortiOS 7.0, there were three commands to... Full Story
-

In this post, I am going to go over... Full Story
-

What we are going to do: We are going... Full Story
-

Choosing between FGCP (FortiGate Clustering Protocol) and FGSP (FortiGate... Full Story
-

Creating a VLAN on macOS (The "Pro" Move) A... Full Story
-

This blog post explores the logic behind how macOS... Full Story
-

Pretty Fly for a Wi-Fi Tell My Wi-Fi Love... Full Story
-

Part of my daily gig is creating BoMs (Bill-of-Materials)... Full Story
-

ICMP introduces several security risks, but careful filtering, rate... Full Story
-

The command diag debug application dhcps -1 enables full... Full Story
-

In the world of FortiOS, execute tac report is... Full Story
-

LLDP; What is it The Link Layer Discovery Protocol... Full Story
-

What it actually does When you run diagnose fdsm... Full Story
-

Monkey Bites are bite-sized, high-impact security insights designed for... Full Story
-

I have run macOS in macOS with Parallels but... Full Story
-

Don't be confused with my other FortiNAC posts where... Full Story
-

This is the third session in a multi-part article... Full Story
-

Today I was configuring key-based authentication on a FortiGate... Full Story
-

Netcat, often called the "Swiss Army knife" of networking,... Full Story
-

At its core, IEEE 802.1X is a network layer... Full Story
-

In case you did not see the previous FortiNAC... Full Story
-

This is our 5th session where we are going... Full Story
-

Now that we have Wireshark installed and somewhat configured,... Full Story
-

The Philosophy of Packet Analysis Troubleshooting isn't about looking... Full Story
-

FortiOS applies a CLI change the moment you type... Full Story
-

macOS file management runs on BSD userland tools sitting... Full Story
-

Practitioners call FortiOS's onboard automation engine a lot of... Full Story