If you've spent any time configuring user authentication on... Full Story
By Manny Fernandez
June 22, 2026
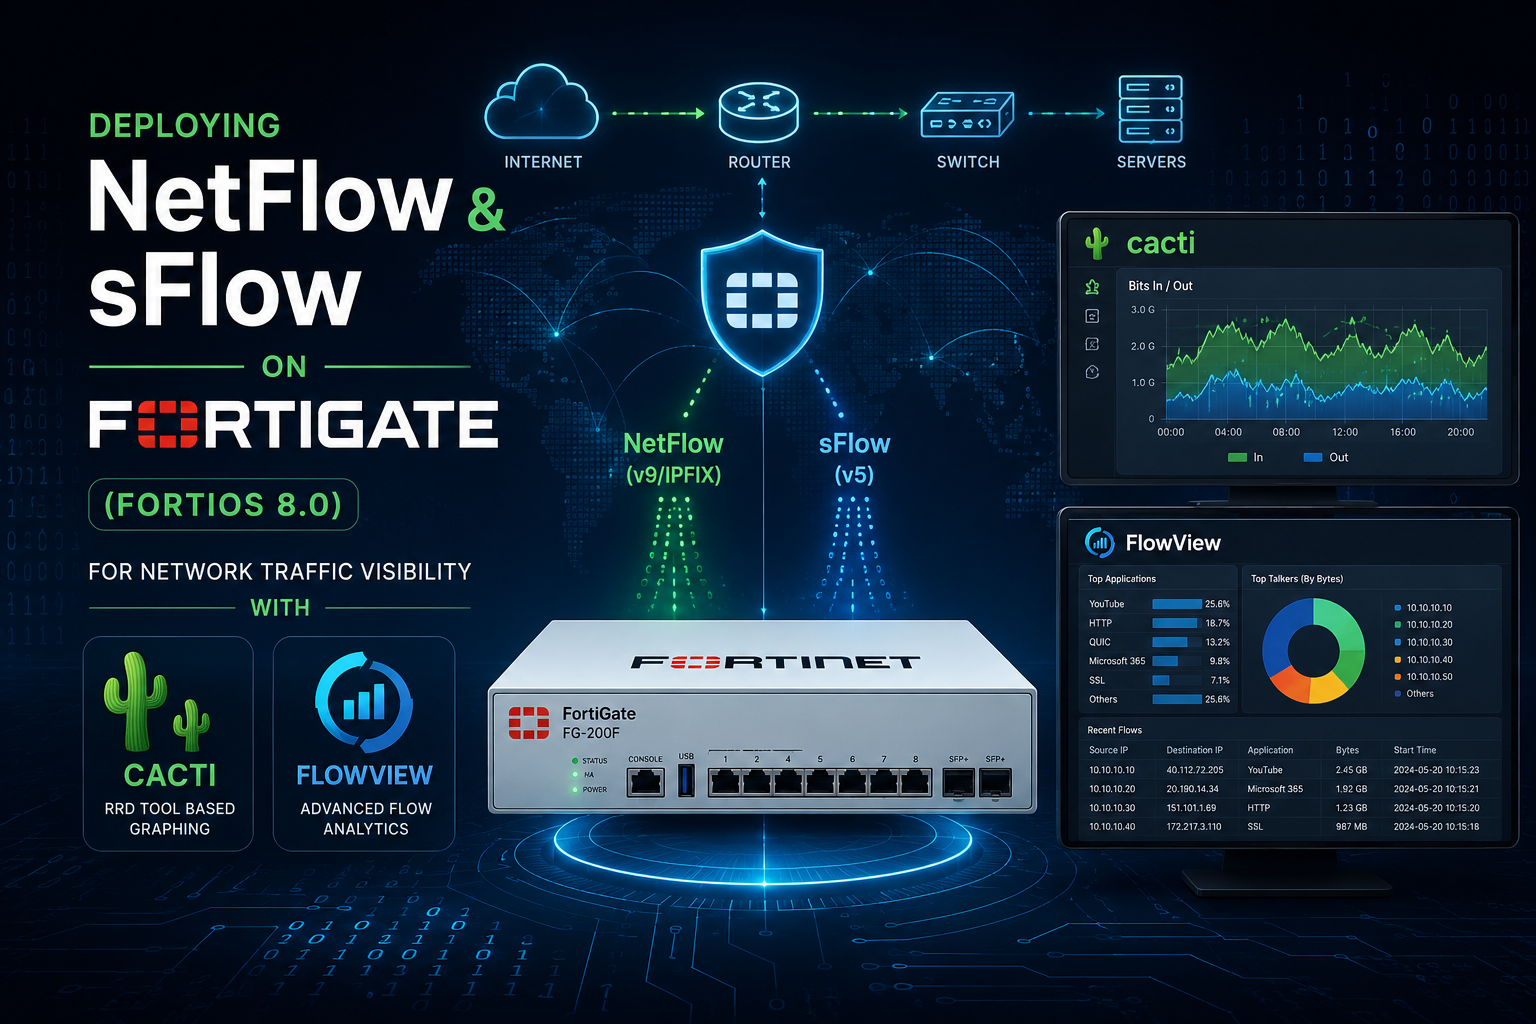
Deploying NetFlow and sFlow on FortiGate (FortiOS 8.0) for Network Traffic Visibility with Cacti and FlowView
1. Title and Executive Summary
Objective: This guide walks you through configuring both NetFlow v9 and sFlow v5 export on a FortiGate running FortiOS 8.0, then collecting and visualizing that telemetry in Cacti using the FlowView plugin. It matters because firewall logs tell you what was blocked, while flow data tells you what is actually traversing your network, which conversations dominate bandwidth, and where anomalies originate, all without the cost of full packet capture.
Target Audience: Network Engineers, Security Engineers, and System Administrators responsible for perimeter and internal traffic visibility. This is also useful for SOC analysts who need conversation-level context (top talkers, top protocols, AS paths) to triage bandwidth and exfiltration concerns.
2. Prerequisites and Architecture
Assumed Knowledge
You should be comfortable with the FortiGate CLI (entering global vs VDOM context, config/edit/set/next/end syntax), basic IP routing and interface naming on FortiGate, and core flow concepts (flow records, sampling, collector vs agent). On the collector side, you should know how to administer a Linux host, install packages, and navigate the Cacti web console and plugin manager. Familiarity with UDP transport and how to read a packet sniffer output is helpful for validation.
A Critical Distinction Before You Start
NetFlow and sFlow are not interchangeable, and the difference drives the entire design:
– NetFlow (v9 on FortiGate) is a stateful, session-aware export. FortiGate builds flow records from its own session table, so you get accurate byte and packet counts per conversation. On FortiGate, NetFlow does not support packet sampling. Every session is accounted for. This is your choice when accounting accuracy matters (billing, capacity planning, security forensics).
– sFlow (v5 on FortiGate) is a stateless, packet-sampling export. The agent grabs 1 of every N packets plus periodic interface counters and ships them to the collector. It scales beautifully at high throughput and is excellent for trend and top-talker analysis, but the byte counts are statistical estimates, not exact totals.
A common real-world pattern is to run sFlow on very high-throughput interfaces where full accounting would be costly, and NetFlow where you need exact per-session accounting. You can run both on the same FortiGate, but be deliberate about which interface uses which, because they share the same underlying daemon (sflowd).
Something to consider: As a Network / Security Engineer, you may want to have a Cacti / FlowView running as a VM so if you are on-site at a customer and need run Net/sFlow you already have the plumbing. In the past, I created and exported a OVF. Now that I run M-Series Macs only, it does not work well. I could send it to my customers, and have them deploy it.
Environment and Lab Requirements
| Requirement | Detail |
| FortiGate firmware | FortiOS 8.0.x (GA). CLI shown uses the 8.0 config collectors table structure. |
| FortiGate licensing | None. NetFlow and sFlow are base FortiOS features and require no add-on license or FortiGuard subscription. |
| Collector host | Linux (Debian/Ubuntu LTS or RHEL/Rocky 9). 2 vCPU / 4 GB RAM minimum for a lab; size up for production volume. |
| Cacti | Cacti 1.2.x with PHP 8.x, MySQL/MariaDB, and SNMP libraries. (see previous article) |
| FlowView plugin | FlowView (the Cacti flow-collection plugin) plus its UDP listener. FlowView ingests NetFlow v5/v9 and sFlow. |
| Network access | UDP reachability from FortiGate source IP to collector (NetFlow 2055/9996, sFlow 6343 are common defaults). |
| CLI access | SSH or console. Both NetFlow and sFlow are CLI-only on FortiGate; there is no GUI collector page. |
Component Table
| Component | Role | Example Address / Value |
| LAB-FGT-01 | FortiGate firewall (flow exporter / agent) | Mgmt 10.10.0.1, source-ip 10.10.0.1 |
| port1 (WAN) | Internet-facing interface, sampled by sFlow | 203.0.113.2/30 |
| internal (LAN) | LAN interface, accounted by NetFlow | 10.20.0.1/24 |
| cacti-flow-01 | Cacti + FlowView collector host | 10.10.20.50 |
| NetFlow listener | FlowView UDP listener for NetFlow v9 | 10.10.20.50 : UDP 2055 |
| sFlow listener | FlowView UDP listener for sFlow v5 | 10.10.20.50 : UDP 6343 |
Note: A single FlowView listener can often parse both NetFlow and sFlow, but using distinct UDP ports per protocol keeps the data streams cleanly separated and makes troubleshooting far easier. This guide uses separate ports.
3. Step-by-Step Implementation Workflow
Phase 1: Prepare the Collector (Cacti + FlowView)
The Goal: Stand up a working Cacti instance with the FlowView plugin enabled and a listener bound to the UDP ports the FortiGate will export to.
The Action: Install Cacti and its dependencies, install the FlowView plugin under the Cacti plugins directory, enable it in the plugin manager, then define the flow listeners. The exact package steps vary by distribution; the sequence below assumes a Debian/Ubuntu base. Install Cacti per the official Cacti documentation first, then layer FlowView on top.
The Code/CLI/Config:
# On the collector (cacti-flow-01), as root or via sudo
# 1. Base packages (adjust for your distro/Cacti version)
apt update
apt install -y apache2 mariadb-server php php-mysql php-snmp php-gd \
php-xml php-mbstring php-gmp snmp rrdtool
# 2. Deploy Cacti per official docs, then add the FlowView plugin
cd /var/www/html/cacti/plugins
git clone https://github.com/Cacti/plugin_flowview.git flowview
# 3. Set ownership so the Cacti poller can write capture data
chown -R www-data:www-data /var/www/html/cacti/plugins/flowview
# 4. Open the collector firewall for the two flow ports
ufw allow from 10.10.0.1 to any port 2055 proto udp#NetFlow v9
ufw allow from 10.10.0.1 to any port 6343 proto udp#sFlow v5
GUI Verification: In the Cacti web console, go to Console > Configuration > Plugins. Locate FlowView and click the install/enable action so its status shows Active. Then open Console > Presets > Flowview (the menu label may read FlowView Listeners depending on version) and create two listeners: one bound to UDP 2055 tagged for NetFlow, one bound to UDP 6343 tagged for sFlow. Confirm the listener processes are running before moving on.
For a full walk through deployment, see the previous post I did Deploying Cacti with NetFlow Support on Ubuntu Linux: Configuring Cisco, Fortinet and Juniper for Netflow
Phase 2: Configure NetFlow Export on the FortiGate
The Goal: Export full, session-accurate NetFlow v9 records from the LAN interface to the Cacti/FlowView NetFlow listener.
The Action: Define the NetFlow collector globally using the FortiOS 8.0 config collectors table, set the export timeouts, then enable the NetFlow sampler on the specific interface(s) you want to account. On FortiGate, the global block defines where and how flows are exported, and the per-interface netflow-sampler setting defines which interfaces actually generate records.
The Code/CLI/Config:
# Global NetFlow exporter definition (FortiOS 8.0 collector-table syntax)
config system netflow
set active-flow-timeout 1800
set inactive-flow-timeout 15
set template-tx-timeout 30
set template-tx-counter 20
config collectors
edit 1
set collector-ip 10.10.20.50
set collector-port 2055
set source-ip 10.10.0.1
set interface-select-method specify
set interface "port2"
next
end
end
# Enable the NetFlow sampler on the interface(s) to account.
# Direction options: tx (egress), rx (ingress), both.
config system interface
edit "internal"
set netflow-sampler both
next
end
For a multi-VDOM deployment (anything other than the management VDOM), NetFlow is configured per VDOM instead:
config vdom
edit <vdom_name>
config system vdom-netflow
set vdom-netflow enable
config collectors
edit 1
set collector-ip 10.10.20.50
set collector-port 2055
set source-ip 10.10.0.1
next
end
end
next
end
Key parameter notes:
– active-flow-timeout 1800 reports long-lived flows every 30 minutes so a multi-hour download still produces interim records rather than one record at session close.
– inactive-flow-timeout 15 flushes a flow 15 seconds after it goes idle.
– template-tx-timeout/template-tx-counter control how often FortiGate re-sends the NetFlow v9 template. The collector cannot decode data records until it has received the template, so these matter on collector restarts.
– source-ip must be an address the collector will recognize. In FlowView the device is keyed by source IP, so keep this stable.
GUI Verification: There is no GUI page for the NetFlow collector itself; it is CLI-only. You can, however, confirm the per-interface sampler indirectly: Network > Interfaces does not display the sampler, so verify with show system interface internal in the CLI and look for set netflow-sampler both.
Phase 3: Configure sFlow Export on the FortiGate
The Goal: Export sampled sFlow v5 datagrams from the high-throughput WAN interface to the Cacti/FlowView sFlow listener, with periodic counter polling.
The Action: Define up to three sFlow collectors globally using the same 8.0 config collectors table style, then enable the per-interface sflow-sampler with a sample rate, polling interval, and direction. Remember the sample rate is “1 in N“: a lower number samples more packets (more accuracy, more overhead).
The Code/CLI/Config:
# Global sFlow collector definition (FortiOS 8.0). Up to 3 collectors supported.
config system sflow
config collectors
edit 1
set collector-ip 10.10.20.50
set collector-port 6343
set source-ip 10.10.0.1
set interface-select-method specify
set interface "port2"
next
end
end
# Enable the sFlow agent on the interface to sample.
config system interface
edit "port1"
set sflow-sampler enable
set sample-rate 2000
set polling-interval 20
set sample-direction both
next
end
For a multi-VDOM (non-management) deployment:
config vdom
edit <vdom_name>
config system vdom-sflow
set vdom-sflow enable
set collector-ip 10.10.20.50
set collector-port 6343
set source-ip 10.10.0.1
set interface-select-method auto
end
next
end
Key parameter notes:
– sample-rate 2000 means 1 of every 2000 packets is sampled (the FortiGate default). On a saturated 10G link this is a sensible starting point. For a busy link where you want finer granularity, lower it toward 1000 or 512, but watch CPU.
– polling-interval 20 ships interface counter samples every 20 seconds, which feeds the utilization graphs independently of packet samples.
– sample-direction both samples ingress and egress. Valid range for sample-rate is 10 to 99999.
– sFlow is not supported on virtual interfaces such as VDOM links, IPsec, GRE, or SSL VPN interfaces. Apply it to physical, VLAN, or aggregate (802.3AD) interfaces only.
GUI Verification: sFlow is entirely CLI-driven on FortiGate; there is no GUI configuration page. Verify with show system interface port1 and confirm set sflow-sampler enable with your chosen rate.
Phase 4: Confirm Egress Path and Source IP
The Goal: Ensure the FortiGate actually sends the UDP export packets out an interface that can reach the collector, sourced from the IP the collector expects.
The Action: Flow export originates from the FortiGate itself (self-originated traffic). If ha-direct is enabled or the source IP is unreachable from the egress interface, exports silently fail. Confirm routing to the collector and that the source-ip you set is owned by a reachable interface.
The Code/CLI/Config:
# Confirm there is a route to the collector
get router info routing-table details 10.10.20.50
# Confirm the source-ip belongs to a real, up interface
diagnose ip address list | grep 10.10.0.1
If exports must leave via a routed data interface rather than the management interface, ensure the global NetFlow/sFlow source IP is set correctly and that interface-select-method points at the right egress. With ha-direct disabled, self-originated flow traffic tends to prefer the mgmt interface unless you override the source.
GUI Verification: Network > Static Routes to confirm a route toward the collector subnet exists, and Dashboard > Network to confirm the chosen egress interface is up.
4. Verification and Validation
Step 1: Verify the flow daemon sees your config
On FortiGate, both NetFlow and sFlow run under the single sflowd daemon. Test levels 3 and 4 dump the live configuration and cache state.
diagnose test application sflowd 3# dump current NetFlow/sFlow config
diagnose test application sflowd 4# dump cache and counters
What success looks like: Level 4 returns a NetFlow/sFlow cache summary showing your collector count and the number of flow-enabled interfaces, for example a line reporting Collectors=1 and Netflow_enabled_intf=1 (or the sFlow equivalent). If Collectors=0, the global collector block did not take effect.
Step 2: Confirm packets are leaving the FortiGate
Use the built-in sniffer to watch the export UDP packets toward the collector. Run one per protocol.
# NetFlow export toward the collector on UDP 2055
diagnose sniffer packet any 'host 10.10.20.50 and udp port 2055' 4
# sFlow export toward the collector on UDP 6343
diagnose sniffer packet any 'host 10.10.20.50 and udp port 6343' 4
What success looks like: A steady stream of outbound UDP packets from 10.10.0.1 to 10.10.20.50 on the respective port. NetFlow records appear when sessions close or hit the active timeout; sFlow datagrams appear continuously as packets are sampled and at each polling interval. No packets means either the sampler is not enabled on a trafficked interface, the source/route is wrong, or no traffic is flowing on the sampled interface.
Step 3: Confirm the collector is receiving
On the Cacti/FlowView host, verify the datagrams arrive and the listener is bound.
# Confirm the listener sockets are open
ss -lunp | grep -E '2055|6343'
# Watch raw arrivals at the OS level
tcpdump -ni any 'udp port 2055 or udp port 6343'
What success looks like: ss shows a process listening on UDP 2055 and 6343; tcpdump shows inbound datagrams from the FortiGate source IP. In the Cacti web console, FlowView > (your filter) should begin showing flow rows within a few minutes: top talkers, top protocols, and per-conversation byte counts. For NetFlow, the device should register keyed on the source-ip you configured.
Step 4: Sanity-check the data semantics
Generate known traffic (for example, a large file transfer across the `internal` interface) and confirm it appears. For NetFlow, the byte counts should closely match the actual transfer size because NetFlow on FortiGate is full accounting. For sFlow, expect the byte estimate to be approximately the true value scaled by the sample rate, so treat it as a trend indicator, not an exact figure.
5. Troubleshooting and Gotchas
Gotcha 1:
No flows arriving, yet the sampler is enabled (source IP / egress mismatch)
Symptom: diagnose test application sflowd 4 shows your collector, but the collector receives nothing and the FortiGate sniffer shows no export packets, or shows them leaving the wrong interface.
Why it happens: Flow export is self-originated traffic. With ha-direct disabled, FortiGate tends to push self-originated flow traffic out the management interface, and if your source-ip is not reachable from the actual egress path the packets are dropped. The 8.0 caveat also applies: source-ip and source-ip-interface are mutually exclusive, and source-ip/source-ip-interface are unavailable when ha-direct is enabled.
Diagnose and resolve:
diagnose sniffer packet any 'host 10.10.20.50 and udp port 2055' 4
get router info routing-table details 10.10.20.50
Set the global flow source-ip to an interface IP that has a valid route to the collector, and use interface-select-method specify with the correct egress interface. If the device is in HA with ha-direct enabled, remove source-ip from the flow config (it is unavailable in that mode) and rely on interface selection instead.
Gotcha 2:
The collector receives datagrams but cannot decode the records (missing NetFlow v9 template)
Symptom: tcpdump confirms UDP arriving on 2055, but FlowView shows empty or partial flows, or no fields populate.
Why it happens: NetFlow v9 is template-based. The collector cannot interpret data records until it has received the template that defines the field layout. If the collector (or its listener) restarted after the last template transmission, it will buffer or discard undecodable data records until the next template arrives.
Diagnose and resolve: Lower the template retransmission interval so templates are re-sent more frequently, then restart the listener so it picks up a fresh template within a minute or two.
config system netflow
set template-tx-timeout 1# re-send template every 1 minute
set template-tx-counter 20# or every 20 data packets, whichever first
end
Restart the FlowView listener on the collector after this change. Once a template is seen, the previously undecodable records begin parsing on the next cycle.
Gotcha 3:
Choosing the wrong protocol for the goal, or expecting sampling from NetFlow
Symptom: Either the FortiGate CPU climbs unexpectedly on a high-throughput interface, or byte totals from sFlow do not match reality and someone treats them as exact, or someone tries to set a NetFlow sample rate and it has no effect.
Why it happens: On FortiGate, NetFlow is full accounting with no sampling option, so pointing it at a saturated high-volume interface generates a large volume of records and load. sFlow is sampling by design, so its totals are statistical estimates scaled by sample-rate, never exact. These are not bugs; they are the defining behavior of each protocol.
Diagnose and resolve: Match the protocol to the interface role. Use sFlow on very high-throughput links where sampling controls overhead, and tune sample-rate upward (for example 4000 or 8000) if CPU is a concern, accepting coarser data. Use NetFlow where exact per-session accounting is required (forensics, billing, capacity), and scope it to interfaces whose volume the platform can handle. If you need both views, run sFlow and NetFlow on different interfaces rather than the same one, and remember both consume the shared sflowd daemon, so watch its load:
diagnose test application sflowd 4
get system performance status # confirm CPU headroom
Quick Reference: NetFlow vs sFlow on FortiOS 8.0
| Attribute | NetFlow v9 | sFlow v5 |
| Accounting model | Stateful, session-based, full | Stateless, packet-sampled |
| Sampling on FortiGate | Not supported (full only) | Required (1-in-N, default 2000) |
| Byte/packet accuracy | Exact | Statistical estimate |
| Per-interface knob | netflow-sampler {tx|rx|both} | sflow-sampler enable + sample-rate |
| Counter polling | No | Yes (polling-interval) |
| Virtual interface support | Broad | Not on VDOM link, IPsec, GRE, SSL |
| Underlying daemon | sflowd | sflowd |
| Common collector port | UDP 2055 / 9996 | UDP 6343 |
| Best for | Forensics, billing, exact capacity | Trends, top talkers, high-throughput |
Recent posts
-

-

DNS is one of those technologies that quietly underpins... Full Story
-

BGP issues on FortiGate firewalls usually trace back to... Full Story
-

Every time your laptop talks to your router, a... Full Story
-

If you've spent any time configuring NAT on a... Full Story
-

If you have spent any time configuring firewall policies... Full Story
-

High availability on FortiGate is one of those features... Full Story
-

If you've configured SD-WAN on a FortiGate, you've almost... Full Story
-

FortiLink is the management protocol that turns a FortiSwitch... Full Story
-

FortiSwitches are pretty rock solid from Mean Time Between... Full Story
-

This is a quicky tip. Have you ever gone... Full Story
-

DNS is one of those quiet pieces of internet... Full Story
-

This article is an updated version of the previous... Full Story
-

You will add ns2 as a secondary (slave) BIND9... Full Story
-

In the process of deploying my lab, I needed... Full Story
-

RFC 8805, used to be known as Self-Correcting IP... Full Story
-

Years back, I wrote an article about certificate pinning. ... Full Story
-

FortiGates have the ability to send alerts to Microsoft... Full Story
-

In this post, I am going to walk through... Full Story
-

Troubleshooting VoIP on a FortiGate can feel like trying... Full Story
-

Prior to FortiOS 7.0, there were three commands to... Full Story
-

In this post, I am going to go over... Full Story
-

What we are going to do: We are going... Full Story
-

Choosing between FGCP (FortiGate Clustering Protocol) and FGSP (FortiGate... Full Story
-

Creating a VLAN on macOS (The "Pro" Move) A... Full Story
-

This blog post explores the logic behind how macOS... Full Story
-

Pretty Fly for a Wi-Fi Tell My Wi-Fi Love... Full Story
-

Part of my daily gig is creating BoMs (Bill-of-Materials)... Full Story
-

ICMP introduces several security risks, but careful filtering, rate... Full Story
-

The command diag debug application dhcps -1 enables full... Full Story
-

In the world of FortiOS, execute tac report is... Full Story
-

LLDP; What is it The Link Layer Discovery Protocol... Full Story
-

What it actually does When you run diagnose fdsm... Full Story
-

Monkey Bites are bite-sized, high-impact security insights designed for... Full Story
-

I have run macOS in macOS with Parallels but... Full Story
-

Don't be confused with my other FortiNAC posts where... Full Story
-

This is the third session in a multi-part article... Full Story
-

Today I was configuring key-based authentication on a FortiGate... Full Story
-

Netcat, often called the "Swiss Army knife" of networking,... Full Story
-

At its core, IEEE 802.1X is a network layer... Full Story
-

In case you did not see the previous FortiNAC... Full Story
-

This is our 5th session where we are going... Full Story
-

Now that we have Wireshark installed and somewhat configured,... Full Story
-

The Philosophy of Packet Analysis Troubleshooting isn't about looking... Full Story
-

1. Executive Summary Objective: This guide turns a FortiAuthenticator... Full Story
-

DISCLAIMER: Please see link above for the official Fortinet... Full Story
-

The underlying assumption that Let’s Encrypt requires you to... Full Story