If you've spent any time configuring user authentication on... Full Story
By Manny Fernandez
May 22, 2026
Understanding and Tuning FortiGate Conserve Mode: A Practical Guide to Memory Thresholds
If your FortiGate has ever started dropping sessions during a traffic surge, or if you have logged in to find a yellow banner warning about “conserve mode,” you have already met one of FortiOS’s most important self-protection features. Conserve mode is the firewall’s way of saying, “I am running low on memory, and I am taking action before things crash.” Understanding how it works, what triggers it, and how to tune the thresholds is essential knowledge for anyone running a FortiGate in production.
This post walks through what conserve mode actually does, the three memory thresholds that govern it, how to view the current state, and how to configure the behavior to match your environment.
What Is Conserve Mode?
Every FortiGate model ships with a fixed amount of RAM, and that memory is shared across every process the device runs: session tables, routing, VPN, inspection engines, logging, the GUI, and so on. When memory usage climbs too high, the system risks becoming unstable. Rather than waiting for a kernel panic or process crash, FortiOS enters conserve mode, a graceful degradation state designed to free up memory and protect the device from itself.
When the FortiGate enters conserve mode, several things happen at once:
- A conserve mode banner appears in the GUI.

- Conserve mode log messages and SNMP traps are generated.
date=2026-05-22 time=15:32:00 devname=FGT-HA-Primary log_id=0100044545 type=event subtype=system level=critical msg="The system has entered conserve mode."
- Content inspection behavior changes based on how you have configured the AV and IPS fail-open settings.
- At the most severe threshold, the firewall stops accepting new sessions entirely.
Conserve mode is not a failure. It is a safety net. But it is also a signal that something needs attention, whether that is a memory leak, an undersized appliance, an inspection profile that is too heavy, or simply a need to retune the thresholds for your specific workload.
The Three Memory Thresholds
FortiOS uses three distinct memory thresholds to drive conserve mode behavior. Each one represents a percentage of total system RAM, and they are configured globally.
The Red Threshold (Default: 88%)
The red threshold is where conserve mode actually begins. Once memory usage crosses this line, the FortiGate enters conserve mode and starts altering how it handles new traffic that requires content inspection. This is the trigger point.
The Extreme Threshold (Default: 95%)
The extreme threshold is the panic line. When memory usage hits this percentage, the FortiGate starts dropping new sessions outright, regardless of inspection requirements. Users will absolutely notice this. New connections fail to establish, applications time out, and the firewall is effectively rationing what little memory it has left to keep existing sessions alive.
The Green Threshold (Default: 82%)
The green threshold is the recovery point. Once the FortiGate is in conserve mode, memory has to drop below this level before the system exits conserve mode and returns to normal operation. The gap between red (88%) and green (82%) creates hysteresis, which prevents the system from flapping in and out of conserve mode every time memory usage hovers near the trigger.
Viewing the Current State
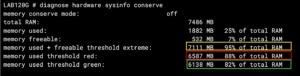
Before you change anything, check the current conserve mode status with this diagnostic command:
diagnose hardware sysinfo conserve
A healthy output looks something like this:
memory conserve mode: on
total RAM: 997 MB
memory used: 735 MB 73% of total RAM
memory freeable: 173 MB 17% of total RAM
memory used + freeable
threshold extreme: 947 MB 95% of total RAM
memory used threshold red: 877 MB 88% of total RAM
memory used threshold green: 817 MB 82% of total RAM
This output tells you the device’s total RAM, how much is in use, how much is freeable (cached memory that can be reclaimed), and the exact byte values that correspond to each threshold. If “memory conserve mode” shows “on,” your FortiGate is currently throttling.
You can also see real-time memory usage with:
get system performance status
1. memory conserve mode
This tells you the current status of the firewall’s self-protection mode. You will see one of four states:
* off Everything is healthy. The system has plenty of breathing room.
* on: The unit has entered Conserve Mode. It will freeze configuration changes and may start bypassing security features (like Antivirus) depending on your configuration, just to keep the device from crashing.
* freeable The device is under high memory pressure, but it hasn’t completely tripped into full conserve mode yet because it identifies memory it can quickly reclaim.
* extreme The system has reached a critical stage and will aggressively drop new incoming sessions to save itself.
2. total RAM
The total physical random-access memory (RAM) installed on your FortiGate hardware or allocated to your Virtual Machine (VM).
3. memory used
The absolute amount of memory currently occupied by FortiOS, the kernel, and active daemons (like the wad proxy or ipsengine). It also shows this as a percentage of your total RAM.
4. memory freeable
This represents memory that is currently cached or occupied by non-essential processes that the FortiGate can instantly clear out or “garbage collect” if a sudden spike of traffic demands it.
5. memory used + freeable threshold extreme (Default: 95%)
This is the ultimate emergency brake line. If your total used memory plus what can’t be quickly freed up hits this number, the FortiGate goes into extreme mode. At this point, the firewall will stop accepting or creating new sessions that require any security inspection.
6. memory used threshold red (Default: 88%)
The official entry gate for standard Conserve Mode. When your memory used passes this specific line, the system turns red, alerts go out, the GUI displays a red warning banner, and fail-open settings take effect.
7. memory used threshold green (Default: 82%)
And for historical context, the GUI dashboard shows a memory usage widget that tracks trends over time.
Configuring the Thresholds
The three thresholds are set under config system global. Here is the syntax:
config system global
    set memory-use-threshold-extreme 95
    set memory-use-threshold-red 88
    set memory-use-threshold-green 82
end
These values are the defaults Fortinet ships with, and for most deployments they are reasonable. However, there are legitimate reasons to adjust them.
When to Raise the Thresholds
If your FortiGate frequently sits at 80 to 85% memory usage during normal operation (which is common on devices running heavy UTM profiles, SSL inspection, or large session tables), it may be tripping into conserve mode unnecessarily. Raising the red threshold to 90 or 92% and the extreme threshold to 97% can give the system more headroom before it starts degrading service.
Be careful, though. Pushing the extreme threshold too high reduces the safety margin and can leave the device with no time to recover before it crashes. Most engineers will not push extreme above 97%.
When to Lower the Thresholds
Conversely, if you want a more conservative posture, particularly on a device that is critical and where you would rather fail to inspection-light mode early than risk instability, lowering the red threshold to 85% gives you an earlier warning and earlier protective action.
A Sample Tuned Configuration
Here is an example configuration for a busy FortiGate that runs hot but rarely crashes:
config system global
    set memory-use-threshold-extreme 96
    set memory-use-threshold-red 90
    set memory-use-threshold-green 84
end
This raises all three thresholds slightly, giving the device more room to operate before any throttling kicks in, while still preserving a 6-point gap between red and green for hysteresis.
Controlling Inspection Behavior in Conserve Mode
The thresholds tell the FortiGate when to enter conserve mode. Two additional settings tell it what to do with inspected traffic once it gets there.
Proxy-Based Inspection (Antivirus)
config system global
    set av-failopen {pass | off | one-shot}
end
- pass (default): New sessions requiring proxy-based AV inspection are allowed through without scanning. Availability is prioritized over security.
- off New sessions that require proxy-based inspection are blocked. Security is prioritized over availability.
- one-shot Similar to
pass, but once the FortiGate exits conserve mode, the setting remains in pass behavior until manually reset. This is useful for diagnosing recurring conserve mode events.
Flow-Based Inspection (IPS)
config ips global
    set fail-open {enable | disable}
end
- disable (default): The IPS engine drops new sessions that require flow-based inspection. Security is prioritized.
- enable The IPS engine stops scanning and passes new packets without inspection. Availability is prioritized.
Notice the inverse defaults: by default, AV fails open (traffic passes) and IPS fails closed (traffic drops). This is an important asymmetry to understand. If you want a uniform “security first” posture, set av-failopen off. If you want a uniform “availability first” posture, set IPS fail-open enable.
A Quick Decision Matrix
| Priority | AV Setting | IPS Setting |
|---|---|---|
| Maximum availability | av-failopen pass (default) |
set fail-open enable |
| Maximum security | av-failopen off |
set fail-open disable (default) |
| Balanced (default) | av-failopen pass |
set fail-open disable |
| Diagnostic / one-time | av-failopen one-shot |
set fail-open enable |
Which posture is correct depends entirely on your environment. A bank or healthcare network may prefer failing closed to ensure no untouched traffic ever reaches sensitive systems. A retail point-of-sale environment may prefer failing open so transactions continue during a memory spike. There is no universally correct answer.
Practical Recommendations
A few field-tested suggestions:
- Monitor before you tune Use SNMP or FortiAnalyzer to graph memory usage over a week or two. If you are nowhere near
88%, leave the thresholds alone. If you are bouncing into conserve mode regularly, investigate the root cause first. - Root cause matters more than threshold tuning Hitting conserve mode usually points to a real problem: oversized session counts, runaway logging, an inspection profile applied where it should not be, or a device that has simply outgrown its RAM. Raising thresholds to suppress the symptom can mask a growing problem.
- Document any changes If you adjust thresholds away from defaults, write it down. The next engineer to troubleshoot a conserve mode event will thank you for noting that the red threshold is now
92rather than88. - Consider hardware acceleration and worker tuning On physical FortiGates, make sure NP and CP offload features are doing their job. On VM editions, allocating more RAM is often the simplest fix.
- Test your fail-open settings Use a lab or maintenance window to verify that AV and IPS behave the way you expect when the device is under memory pressure. Discovering during an outage that your IPS is dropping all sessions because
fail-openwas at default is not the ideal time to learn the difference.
Closing Thoughts
Conserve mode is one of those features that most administrators ignore until it fires for the first time. By then, you are troubleshooting under pressure with users complaining. Take a few minutes now to check diagnose hardware sysinfo conserve on your firewalls, review your thresholds, and decide whether your AV and IPS fail-open settings match your security posture. A small amount of preventive tuning pays off the first time your firewall hits a memory spike and handles it gracefully.
The default thresholds work for most environments, but “most” is not “all.” Knowing what the knobs do, and when to turn them, is the difference between reacting to an incident and preventing one.
Recent posts
-

-

DNS is one of those technologies that quietly underpins... Full Story
-

BGP issues on FortiGate firewalls usually trace back to... Full Story
-

Every time your laptop talks to your router, a... Full Story
-

If you've spent any time configuring NAT on a... Full Story
-

If you have spent any time configuring firewall policies... Full Story
-

High availability on FortiGate is one of those features... Full Story
-

If you've configured SD-WAN on a FortiGate, you've almost... Full Story
-

FortiLink is the management protocol that turns a FortiSwitch... Full Story
-

FortiSwitches are pretty rock solid from Mean Time Between... Full Story
-

This is a quicky tip. Have you ever gone... Full Story
-

DNS is one of those quiet pieces of internet... Full Story
-

This article is an updated version of the previous... Full Story
-

You will add ns2 as a secondary (slave) BIND9... Full Story
-

In the process of deploying my lab, I needed... Full Story
-

RFC 8805, used to be known as Self-Correcting IP... Full Story
-

Years back, I wrote an article about certificate pinning. ... Full Story
-

FortiGates have the ability to send alerts to Microsoft... Full Story
-

In this post, I am going to walk through... Full Story
-

Troubleshooting VoIP on a FortiGate can feel like trying... Full Story
-

Prior to FortiOS 7.0, there were three commands to... Full Story
-

In this post, I am going to go over... Full Story
-

What we are going to do: We are going... Full Story
-

Choosing between FGCP (FortiGate Clustering Protocol) and FGSP (FortiGate... Full Story
-

Creating a VLAN on macOS (The "Pro" Move) A... Full Story
-

This blog post explores the logic behind how macOS... Full Story
-

Pretty Fly for a Wi-Fi Tell My Wi-Fi Love... Full Story
-

Part of my daily gig is creating BoMs (Bill-of-Materials)... Full Story
-

ICMP introduces several security risks, but careful filtering, rate... Full Story
-

The command diag debug application dhcps -1 enables full... Full Story
-

In the world of FortiOS, execute tac report is... Full Story
-

LLDP; What is it The Link Layer Discovery Protocol... Full Story
-

What it actually does When you run diagnose fdsm... Full Story
-

Monkey Bites are bite-sized, high-impact security insights designed for... Full Story
-

I have run macOS in macOS with Parallels but... Full Story
-

Don't be confused with my other FortiNAC posts where... Full Story
-

This is the third session in a multi-part article... Full Story
-

Today I was configuring key-based authentication on a FortiGate... Full Story
-

Netcat, often called the "Swiss Army knife" of networking,... Full Story
-

At its core, IEEE 802.1X is a network layer... Full Story
-

In case you did not see the previous FortiNAC... Full Story
-

This is our 5th session where we are going... Full Story
-

Now that we have Wireshark installed and somewhat configured,... Full Story
-

The Philosophy of Packet Analysis Troubleshooting isn't about looking... Full Story
-

You have twenty years of muscle memory. You type... Full Story
-

Have you ever wanted to do some testing on... Full Story
-

Ask ten engineers to define "a network" and you... Full Story